Joukyou Shoujin's Ascensionism ~ This Week's Observed Stocks Glimmering Chart View ~
We have not been in touch for a while. This is Akiko Shiro.
It has been getting colder day by day as I have come here, and I hope everyone is not how your health is doing?
This is a personal matter, but on October 17 I held an in-person seminar hosted by Monex Securities.
During that seminar, you asked about how we choose the stocks we trade, so I will公開 the stocks I’m watching this week.
The chart I will be using here is the Glitter Chart (kirameki chart) that I explained in the video.
You’ll be able to understand how I use the Glitter Chart.
This week Tuesday is a holiday, so don’t push yourself!!
I would like to say that, but funds may flow into the emerging markets.
This week is a chance!!
So I’ll introduce a few stocks I’ve been watching a little.
First, 7681 Leocan
Please take a look at the daily chart since the listing.
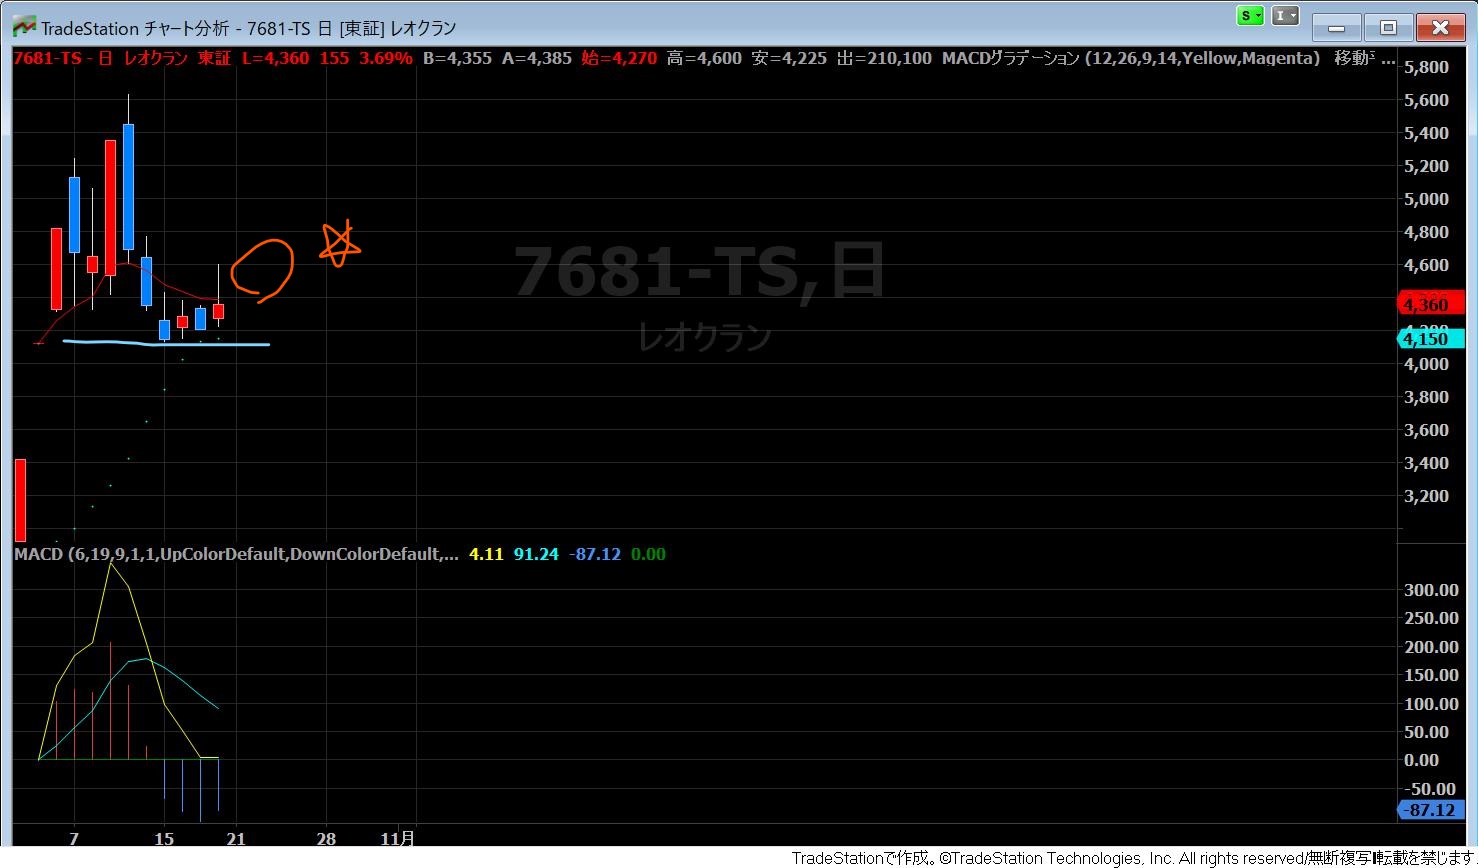
This is a very clean chart.
If it crosses above the 5-day line, it looks like a very interesting chart.
If possible, I’d like to target it with a higher opening of the upper shadow.
Next stock is 6754 Henitz
Daily chart from June 20 to October 18
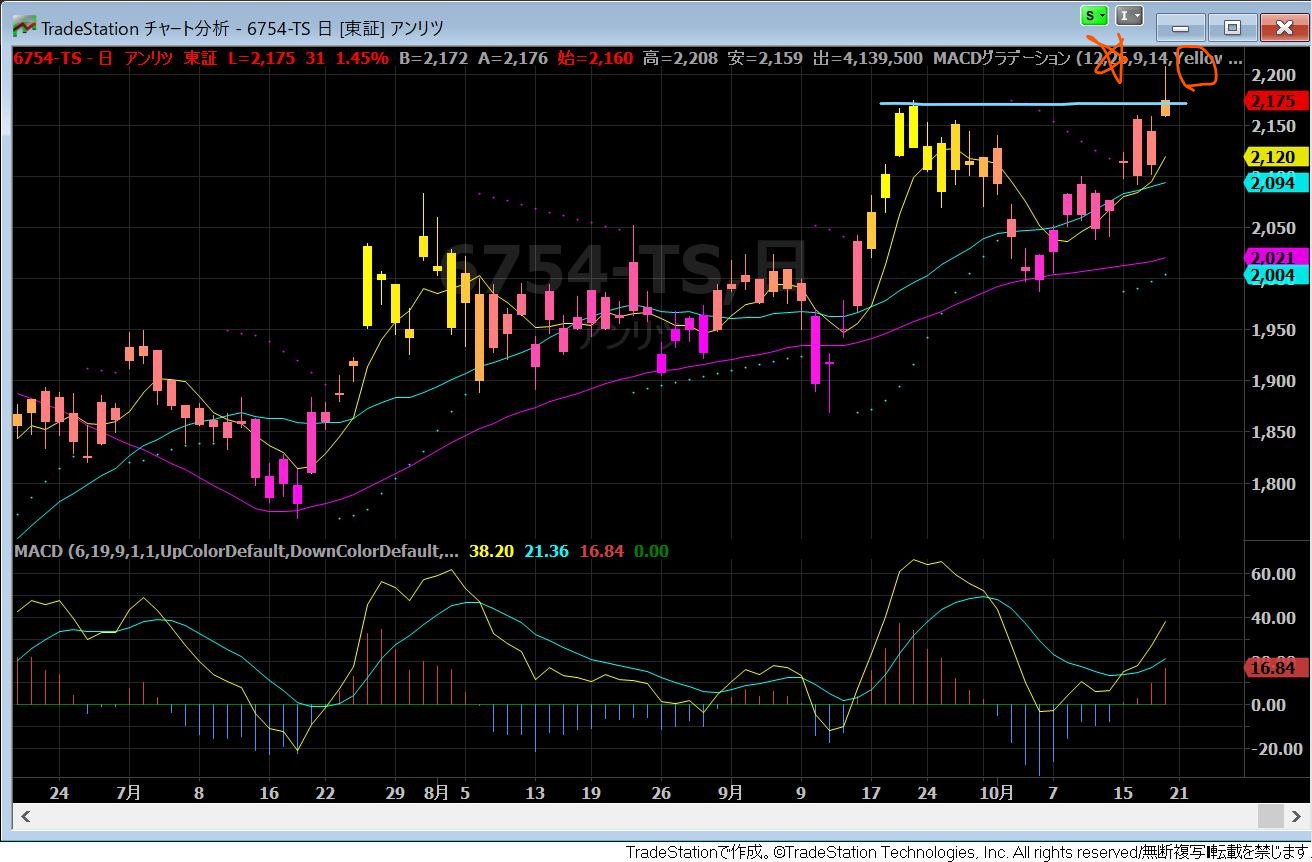
This also aims for a move beyond the upper shadow!!
I want to clearly exceed the previous high
The MACD has improved, the gradient shifts from pink to orange, and I’m期待 a strong move toward yellow
Next is 4461 Daiichi Kogyo Seiyaku
Please look at the daily chart from June 20 to October 18.
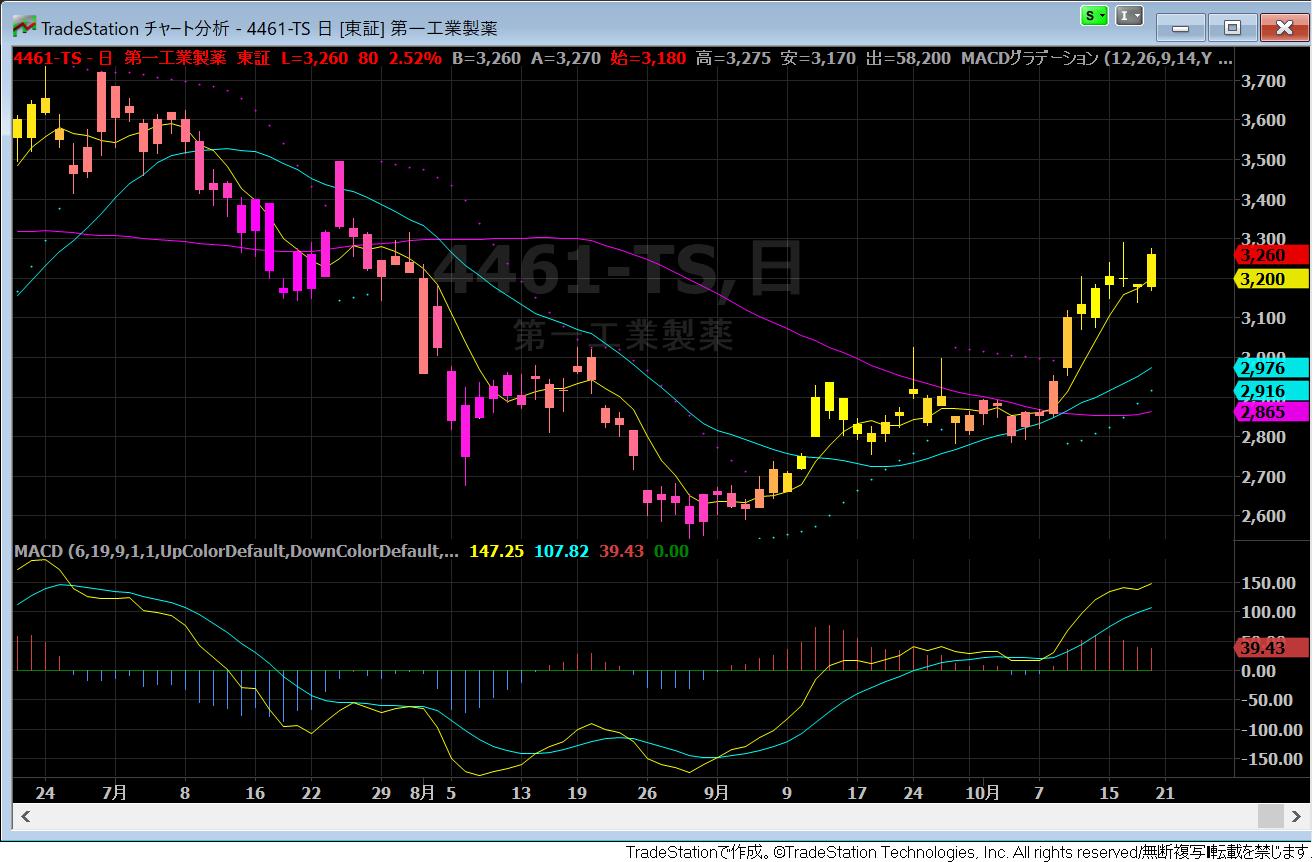
If it breaks upward, it will be strong, but the price range around July 16 to 29 is a pivot, and to break through here smoothly would require power
The upward move may be a bit heavy...
In such times I extend the period of the daily chart to view it
This is the daily chart of Daiichi Kogyo Seiyaku from February 8 to October 18
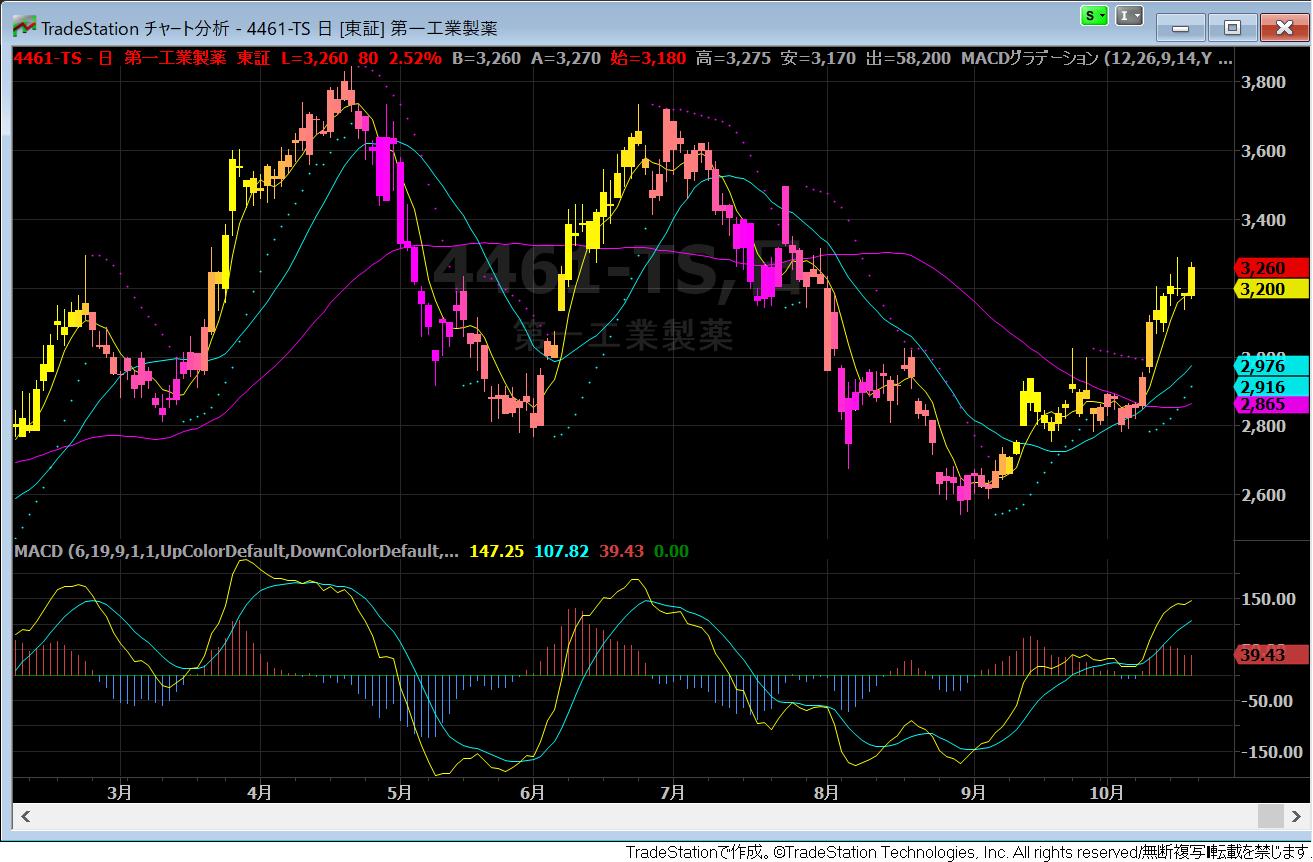
Can you see something?
At first glance, it’s a visually simple view
Yellow indicates an uptrend, and after that, as it declines, the color changes to orange; but if you look closely, immediately after yellow doesn’t turn to decline; there is orange before the decline, so the pattern is yellow → orange → decline.
This means that this chart is still yellow, so until the color changes afterward, we can judge that it’s still rising for the time being.
This is what you can understand just by looking at it—the Glitter Chart!!
If we only analyze, we’ll get tired, so let’s also pick stocks by appearance!
I publish the stocks under observation and daily trading on Ameblo in “Shiro Akiko’s Beautiful Stock Weather.”
If you’re interested, please take a look.