Rake in money with Envelope and RSI! "Enbero V2"
The average annual number of trades is 1,500
Both simple and compound interestLow risk
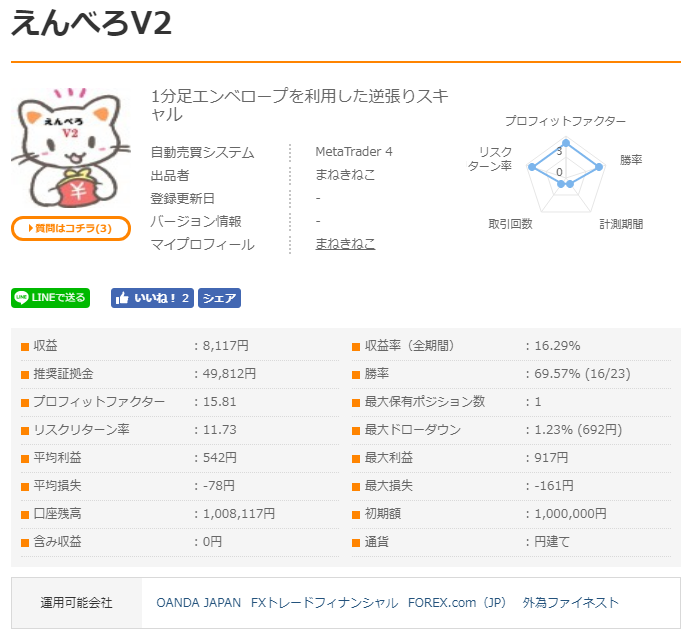
Euro-dollar exclusive scalping EA "Enbero V2"
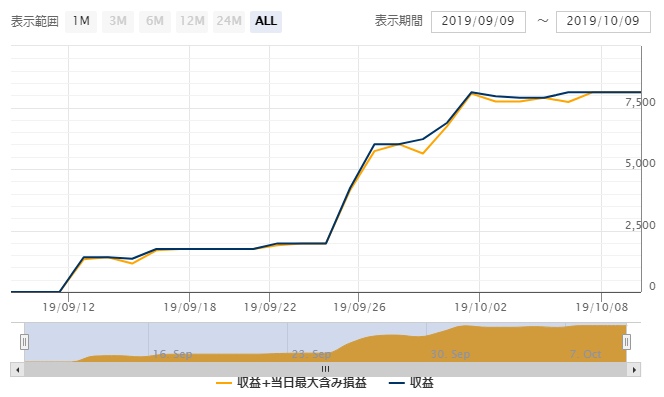
Forward performance is for one month, but the graph shows an upward trend and a promising start for the future.
【Enbero V2 Overview
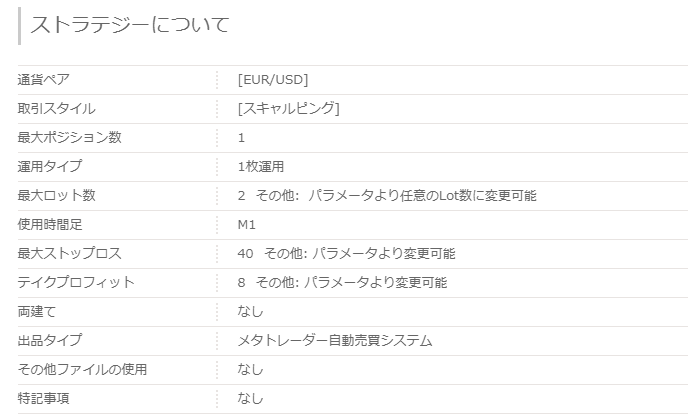
The style operates on the euro-dollar, the most liquid, with a single position.
The timeframe used is the 1-minute chart, and the trading style is scalping with rapid gains in a short period.
One feature is that it won't enter again unless more than 30 minutes have passed since a stop-loss.
Additionally, from the entry, if it crosses the moving average within less than 15 minutes and reaches the take-profit in Pips, or if 15 minutes or more have elapsed since entry and the price reaches the moving average, it will close the position even if the take-profit in Pips has not been reached.
■Monthly Analysis
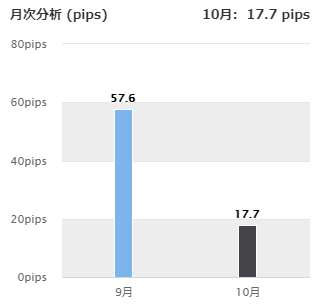
In September, 57.6 pips, and in another month 17.7 pips, for a total of 75.3 pips.
【Backtest Analysis】
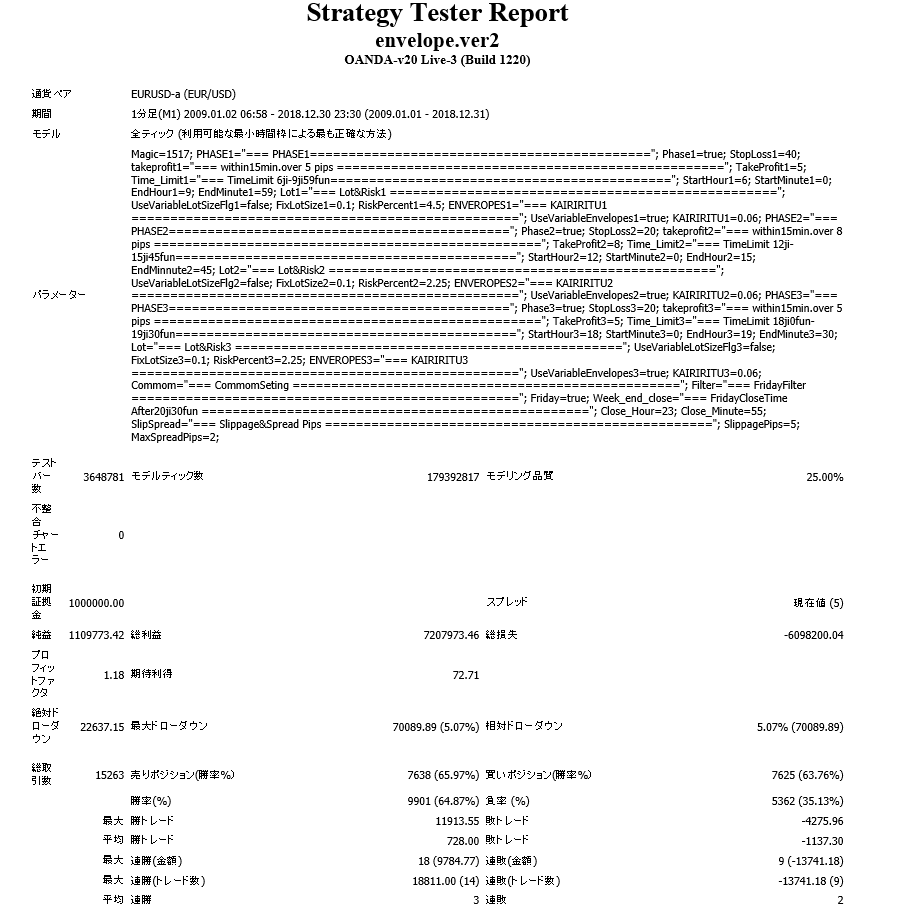
2009.01.01‑2018.12.31
Spread 5
Fixed at 1 lot
Net profit +1.109 million JPY (annual average 111,000 JPY)(年間平均 11.1万円)
Maximum drawdown −70,000 JPY
Total trades 15,163 (annual average 1,516.3)
Win rate 64.87%
PF 1.18
Recommended margin for 1 lot fixed
(48)+(7*2)=62(万円)
This yields an expected annual return of 17%.
Both maximum drawdown and relative drawdown are in the 5% range, indicating relatively low risk for operation.
The entry times are divided into「PHASE1」「PHASE2」「PHASE3」 and, like a stop loss, can be freely configured via parameters.
■Yearly・Monthly Profit and Loss
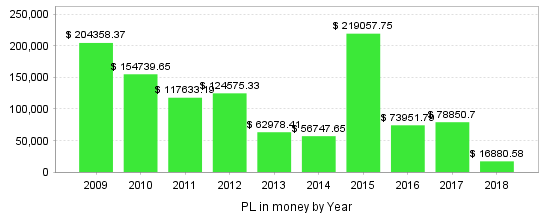
Looking at the results over the past 10 years, every year has been positive.
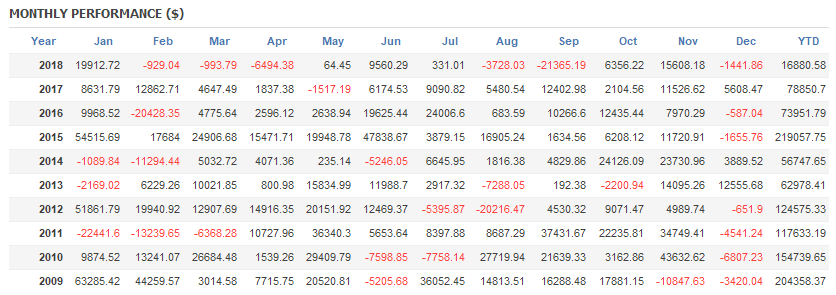
Even on a monthly basis it’s stable, but December shows losses in 7 of the 10 years.
■Holding Time
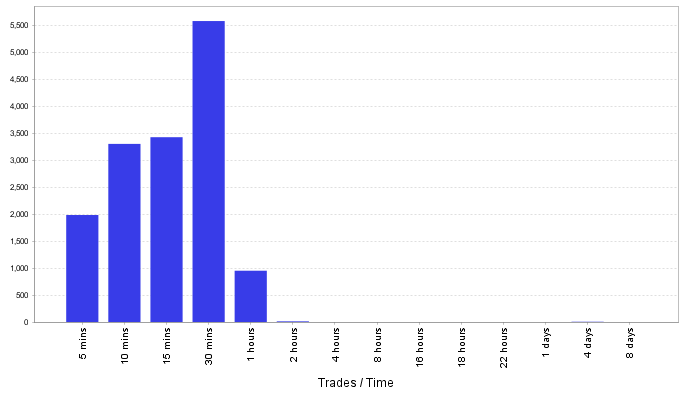
Holding time is mostly around 30 minutes and leans toward a light day-trading style; this is likely influenced by the rule of not entering again unless 30 minutes have passed after a stop loss.
■One-day Trading Hours
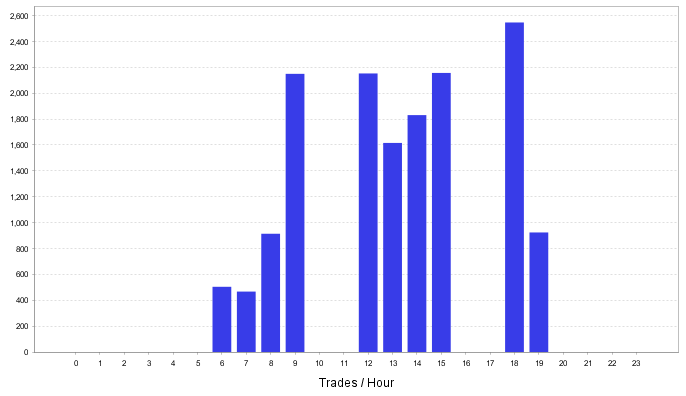
Trading hours are 6:00–9:00, 12:00–15:00, and 18:00–19:00.
■Weekly
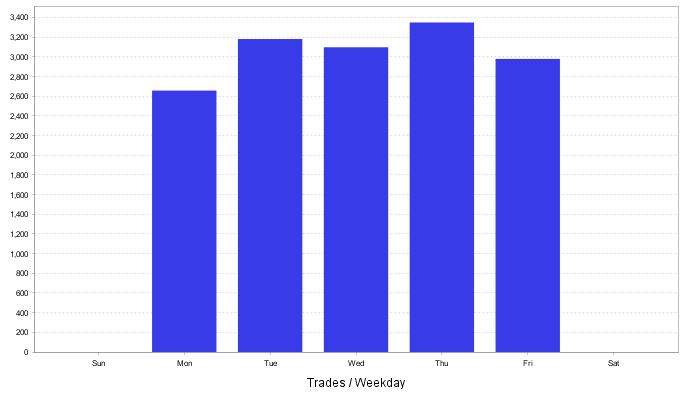
Trades are spread fairly evenly across the week.
■Trading Image
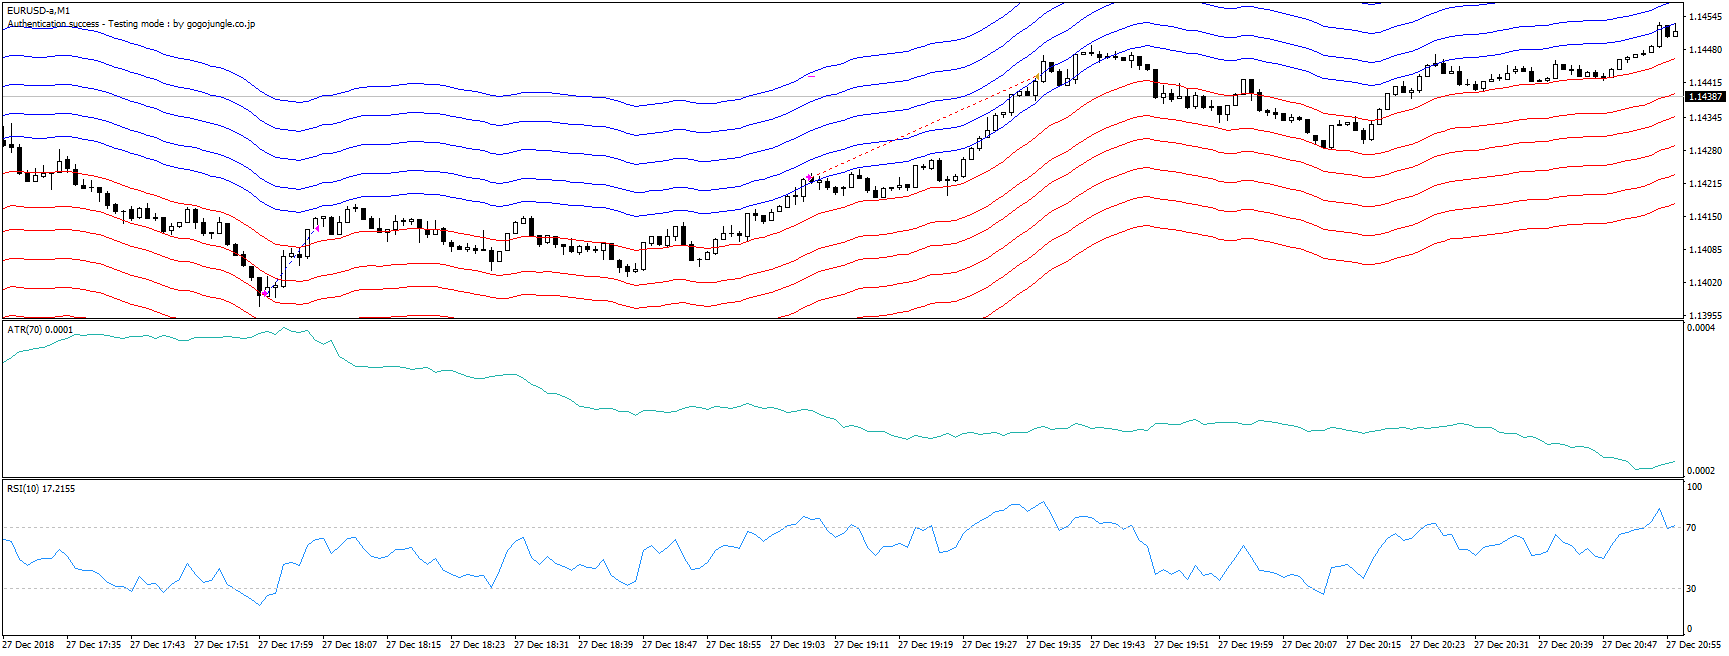
▲Trading image. The blue line at the pink entry point indicates a buy, and the red line at the pink entry point indicates a sell. It appears to use a logic with Envelopes, ATR, and RSI to determine entry points.
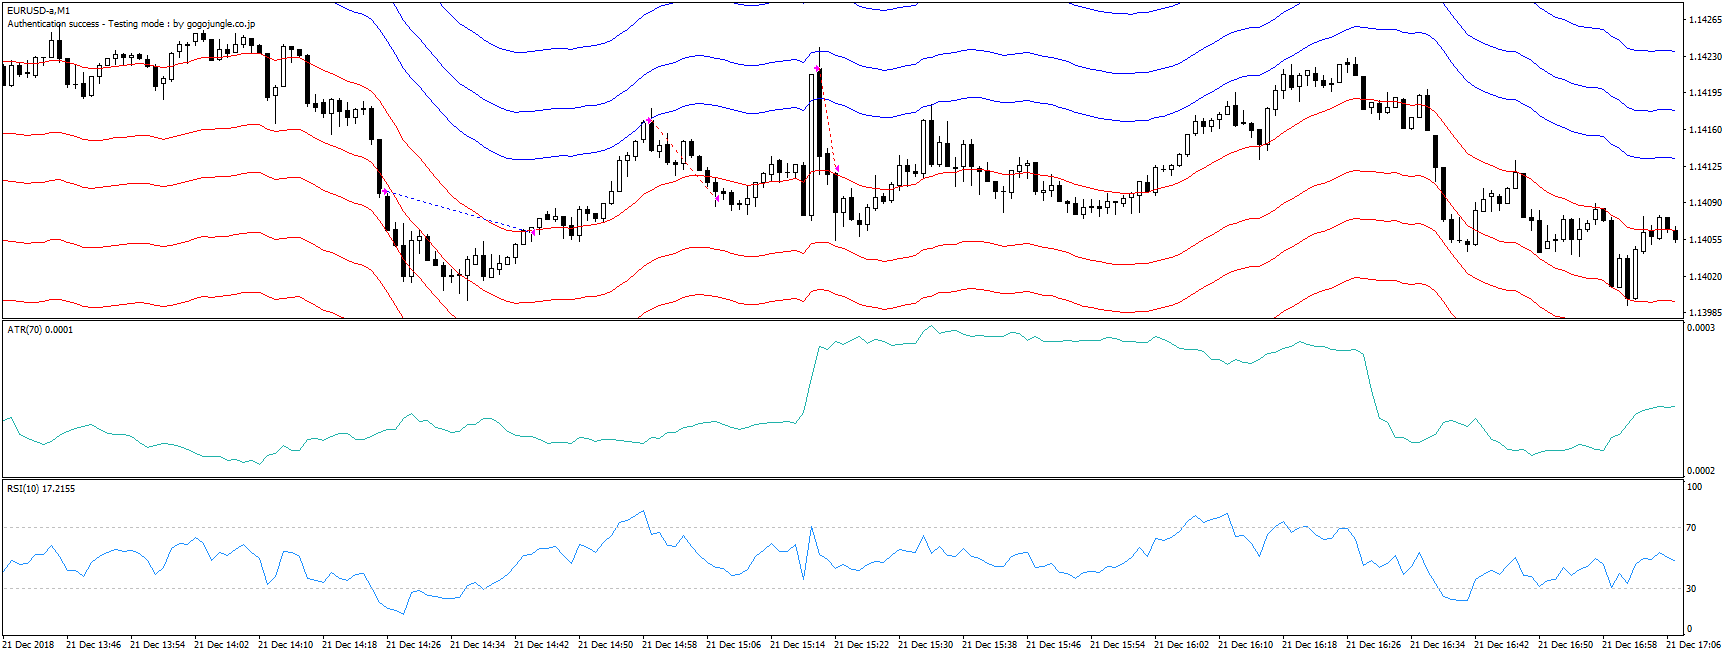
▲As described, this is an example of a contrarian entry, selling on a drop and buying on a rise.
・Compounding
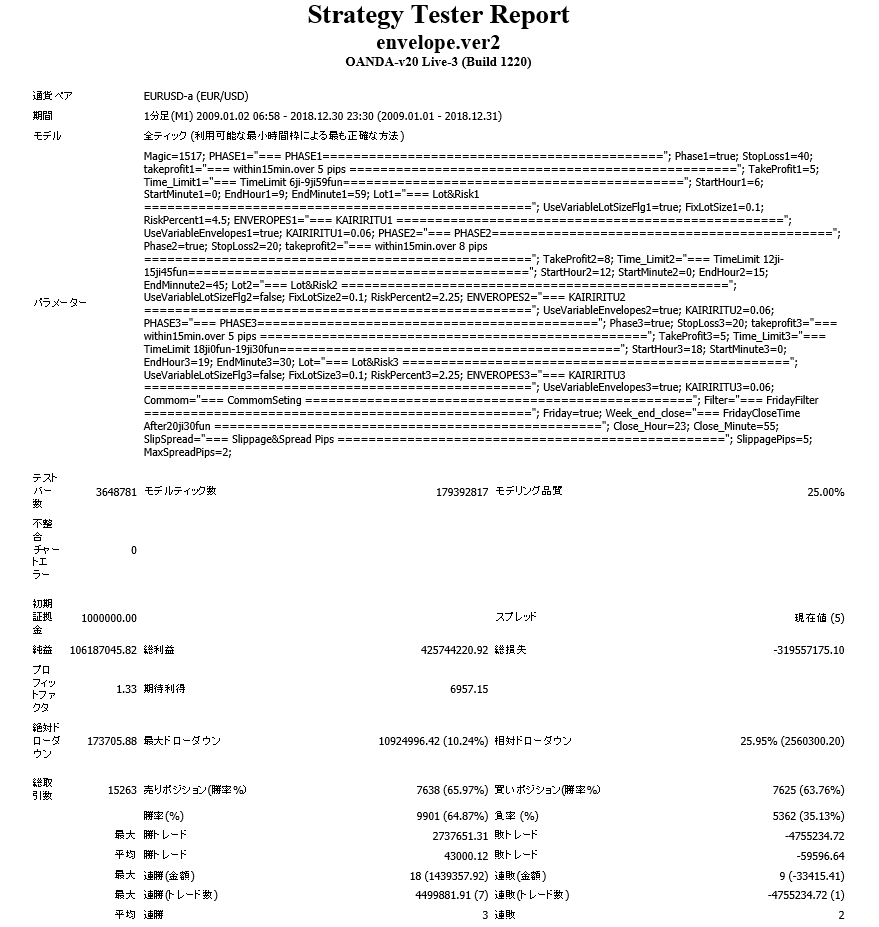
Maximum drawdown is 10%, and relative drawdown is 25%, which is comparatively lower risk than other compounding EAs.
Net profit has reached 100 million yen.
■Settings
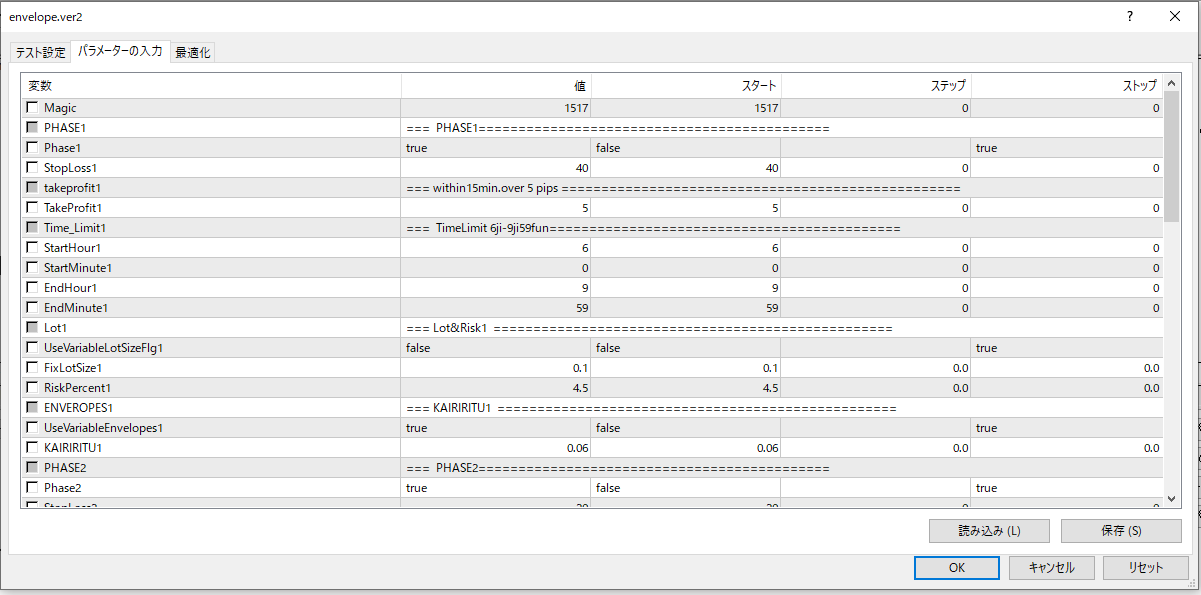
Settings can be customized to your preferences. Why not try different values within your acceptable range?
■Summary
We have examined both forward and backtests; forward drawdown is 1% and backtest drawdown is 5%, indicating low risk and a user-friendly EA.
The number of trades is about 1,500 per year, quite frequent; however, over ten years of backtesting there have been no losses.
On the other hand, the expected profit is somewhat low, so it may perform well when combined with other trend-following EAs in a portfolio. Since the currency pair is EURUSD, it should have high versatility.