

[Scenario][FX] Prep: Week 2 October Scenario Commentary, Monday Window Closure, Deception Points [GBPJPY]
Hello, good evening, this is Chiiko.
It’s become notably autumn-like these days, how are you doing?
I don’t write greetings like these very often, so I’ll keep it short and move on to the second week of October’s study plan.
Monday Window Closure Trade Pointsanda brief note on deception as well.
If you’re interested, please read on.
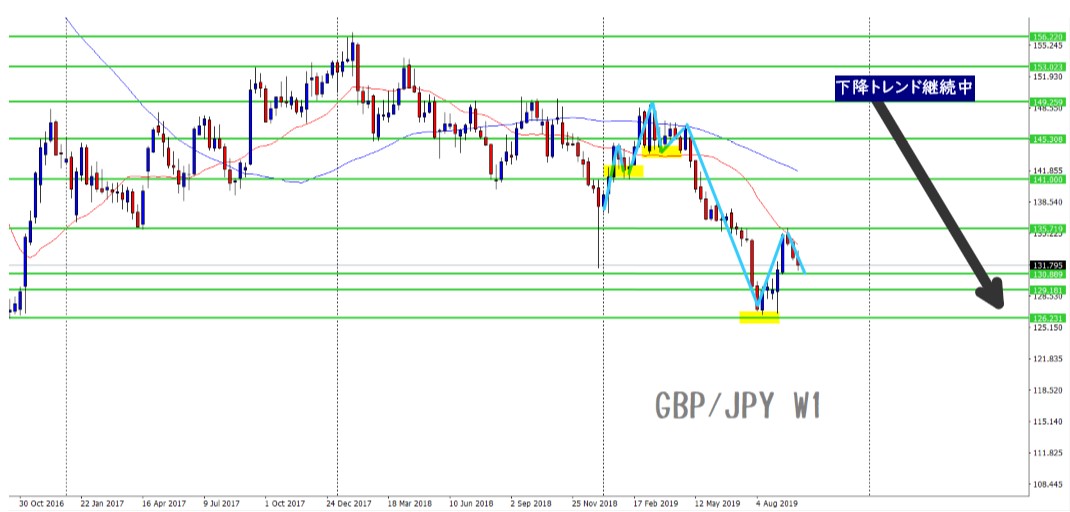
W1: Weekly Chart
The downtrend is continuing.
There’s no notable movement; highs and lows are not changing much.
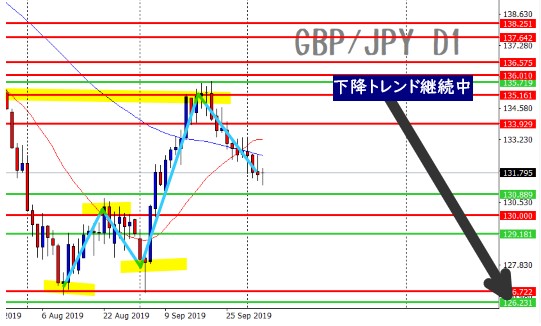
D1: Daily Chart
This is also in a downtrend continuation.
There is a weekly line around 130.889.
If it doesn’t break and resistance appears to move upward,short-term buy biasmay emerge.
There is a possibility that higher timeframes show buying tendencies as well.
Even if a selling pattern appears at the lower timeframes’ lines, it may still be carried upward.
Waiting for a alignment of the market direction before trading reduces stop-outs.
★ If the overall direction is bearish,
at moments of a short-term spike or retracement (on the daily lower, 4-hour upper, or 1-hour lower charts),
you may sell but the price might not drop smoothly, and even when the entry point aligns, you could still get stopped out.
This is the pattern that might appear on the short-term charts as adeception pattern.
Candlesticks don’t intend to mislead participants by their movements.
The main cause is lack of confirmation from higher timeframes.Lower timeframes’ misalignment is a major factor.
When directions align, there’s a higher likelihood of progression; when they’re scattered, stability is unlikely.
To avoid deception,alignment with higher timeframesisan essential check.
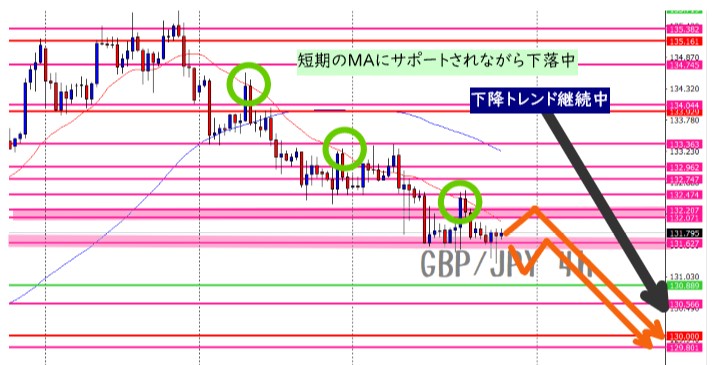
4h: Four-Hour Chart
The downtrend continues.
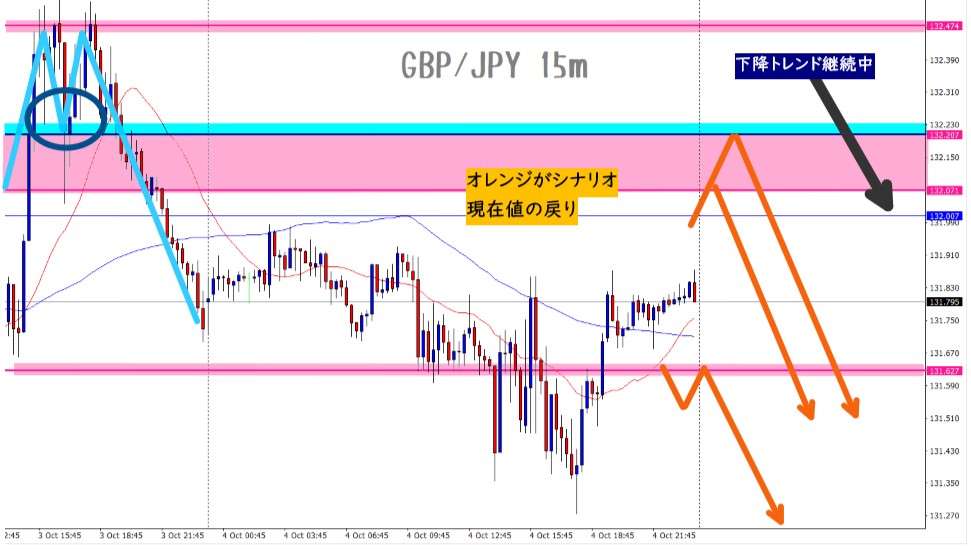
Sell when it rises to the line from 132.071 to 132.207 and then reverses.
Sell when it comes down past the line at 131.627 and breaks below.
There are cases where momentum breaks through in one move, so I’ll target 15-minute timing.
When the four-hour chart forms a rebound, a short-term buy bias emerges.
If the lines on each timeframe aren’t in agreement,
I recommend waiting without entering.
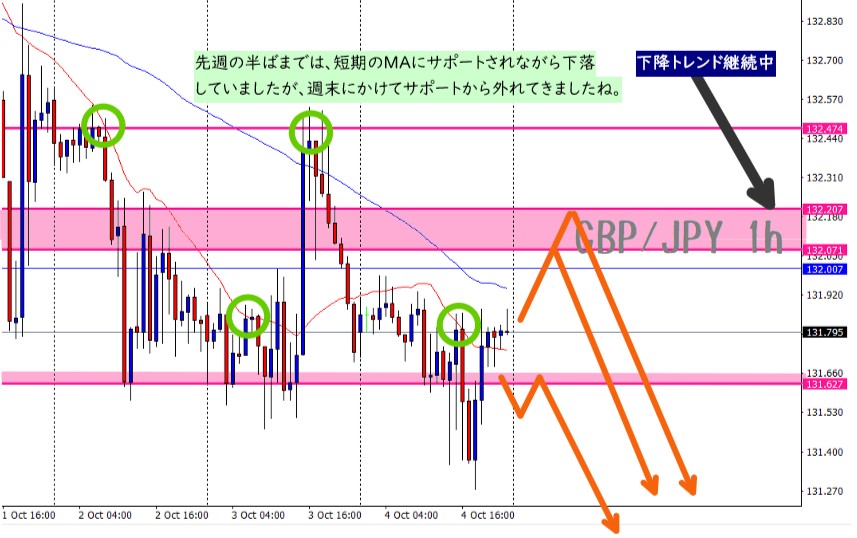
1h: One-Hour Chart
The view is almost the same as the 4-hour chart.
15m: Fifteen-Minute Chart
Since the higher-timeframe trend is down,I’ll mainly trade with selling in mind.
The price range in this area is about 60 pips.
Price fluctuations tend to move up and down within roughly 30 pips, forming a range.
As usual, it would be good to wait for the line to be reached and trade accordingly.
Even though a downtrend is in place, prices will rise and fall as they form.
Some may want to take short-term counter-trend trades during pullbacks, but
when the downward momentum is strong, going against the flow is counterproductive.
The trend is your friend, so I’ll stay away from that.
Summary
Direction
Weekly: ▼ Downtrend
Daily: ▼ Downtrend
4-hour: ▼ Downtrend
1-hour: ▼ Downtrend
Key Points
★ Essentially the same scenario as last week.
There were sharp rises and falls, but price ranges are in the same area as last week; if the price range moves, the scenario needs to be revised.
★ There is a possibility that the 132.627 line could break in one move.
If that happens, I will sell when a pattern forms on the 15-minute chart.
If not, I won’t enter and I will wait for a pullback.
★ If price moves into a new range, pay attention to the daily chart (explained in daily analysis).
~as usual~
★ If the 4-hour and 1-hour charts enter a sideways range, wait until there is momentum to avoid unnecessary stop-outs.
★ Wait at the line; don’t enter at an intermediate point on higher timeframes.
【Monday-Only Window Closure】
Regarding Monday window-close trades, if a lower gap opens, it becomes a contrarian move, so
if a lower gap appears, I don’t plan to trade.
There is a possibility it will close over the long term, but in the short term the long-term downtrend suggests it won’t close and may continue dropping.
In either case, closing is possible, but aligning with the long-term timeframe reduces the chance of stop-outs.
The scenario may differ from what you expect.
Forecast: I think it will happen this way, so I will act accordingly
Scenario: If this happens, I will do this
The scenario is a trading plan.
If price moves outside the scenario, it is outside the plan, so I will choose not to trade.
This is a measure to prevent being swayed by analyses and to plan trades in advance.
Thank you for reading until the end.
The latest information can be checked on Twitter.
Please follow me.