

【Scenario】【FX】Preparation: Highlights of Employment Statistics Right Before Release★ Scenario Commentary: Week 1 of October【GBPJPY】
Tuesday's decline has pushed us into a new price range, so we will review the scenario once again.
I am making it a habit to confirm each time.
The reason is thatwhen there is something I don't understand, I hesitate,and it leads to making an interpretation that suits the moment.
Preparation is important. Preparation is a very important task to avoid injuries.
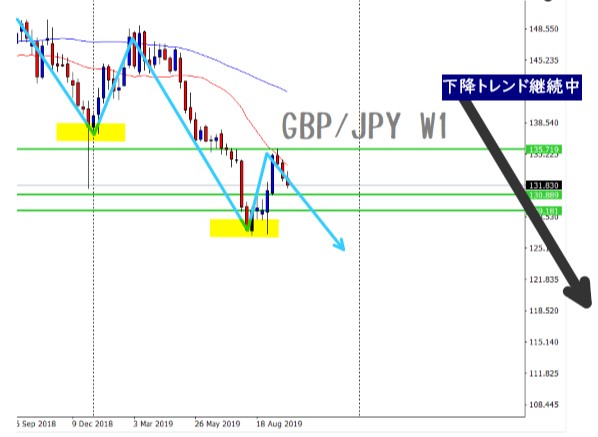
W1: Weekly
There are even longer time frames such as yearly charts, but for now, confirming from here on is fine.
We are in a decline from the rebound.
Until a new low is madethe trend remains downward, that seems acceptable.
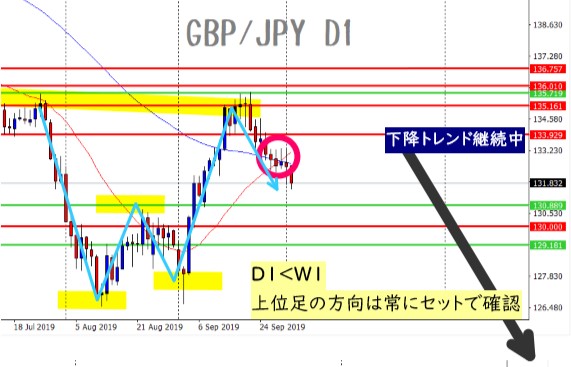
D1: Daily
We were wondering what would happen after the golden cross.
① The weekly is in a downtrend, but will there be a temporary pullback?
② As a preparation for a reversal, will there be a push down?
③ Or will it simply drop further?
① and ② can be short-term contrarian points against the longer-term view.
③ is just that. No one knows whether it will fall to the neckline or further below.
※The above is only considering possibilities.
Was the downward pull of the long-term chart too strong to overcome?
That part is unknown, but the pattern is currently moving as the long-term MA has fallen below.
Downward trend continues, yes.
By the way ~
The main role of the weekly and daily charts is to confirm direction.
The 4-hour and 1-hour charts are mainly for constructing the scenario.
The 15-minute and 5-minute charts are for timing entries.
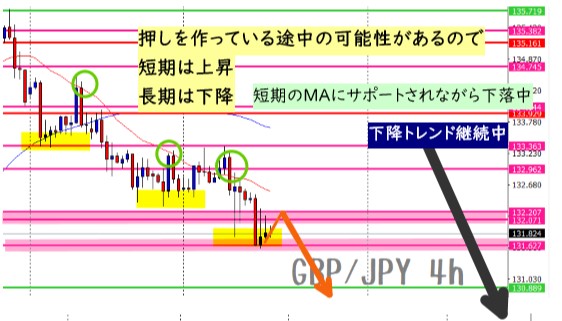
4h: 4-hour
From Tuesday morning to noon, I was wondering if the most recent high would be broken, but
the downward gravity was strong, lol.
Overallthe downward trend continues, indeed.
However, since a bounce is forming, in the short term it is rising, so if you want to sell, I recommend selling after confirming a touch of the 132 line.
(※ to be precise, from a bearish perspective, it would be written like that,
but if it breaks upward, then it would be a sign of preparing for a reversal, haha.
If it does not touch the 132 line and continues downward, you just follow it lower.
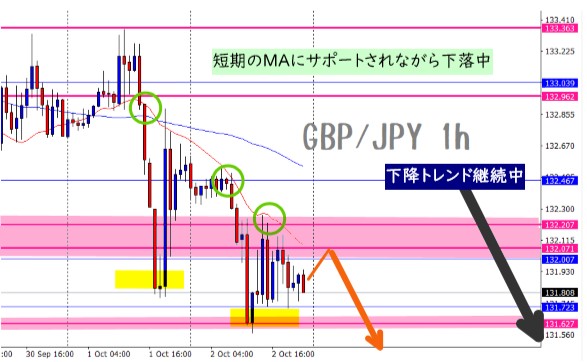
1h: Daily
The view is almost the same as the 4-hour.
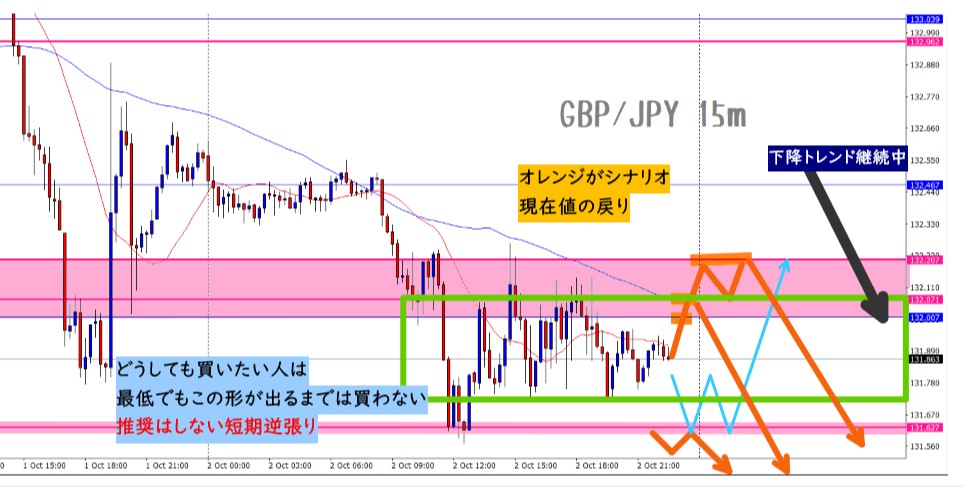
15m: 15-minute
Here, the higher-timeframe trend has been downward up to this point.
Therefore,selling is the main trading approach.
Movement has stabilized for now and entered a range.
The price range width in this level is about 60 pips.
Price fluctuations roam around about 30 pips up and down.
That choppy action might be influenced by a short-term rise on the 4-hour chart.
For beginners, it seems better to enter after the 4-hour candlestick closes bearish.
As I was writing that, it did close with a bearish candle.
In other words, if you look at which part of the long-term chart is forming, it reduces unnecessary stop-outs.
Blue buying is not advisable.
Only when the 4-hour chart is turning upward and the chart pattern appears should one consider buying, at that level.
For beginners, not fully grasping or overlooking confirmation points, selling is the safer option.
Summary
【Direction】
Weekly: ▼ Downward
Daily: ▼ Downward
4-hour: ▼ Overall downward, but with a short-term rise possible.
1-hour: ▼ Downward
【Points】
In the 4-hour and 1-hour, there is a possibility of breaking through the 132.627 level in one move.
If that happens, sell when a pattern forms on the 15-minute.
If it doesn’t form, there is no entry, so wait for a rebound.
Tomorrow Friday is a monthly festival.
I will proceed with a plan not to dance.
Have a good weekend (*´з`)

Thank you always for viewing.
The latest information can be checked on Twitter.
Please follow us.