Decode the signals of institutional investors! Learn how muscle-trader Yu Chel uses Fibonacci retracements.
Fibonacci retracement, widely used by many traders, can be interpreted in different ways. In this video, we asked YouTube channel host Yuchels to share how she uses Fibonacci retracement and the key points to look for when viewing it.
What you can learn from this video
In this video, you will learn the following.
・What exactly is Fibonacci retracement?
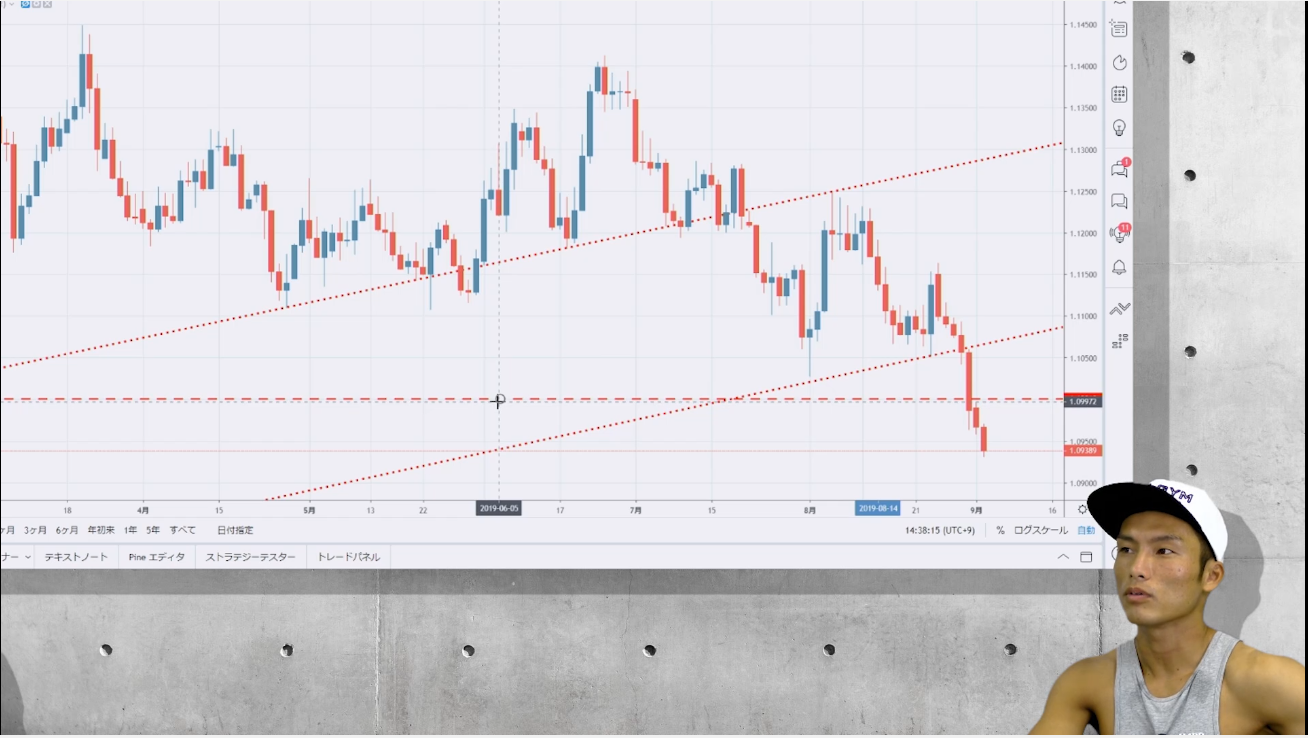
・How to draw and interpret Fibonacci retracement
> Check how far the pullback goes
> If the 61.8% retracement coincides with an important line, that’s hot
> If it exceeds 78.6%, is the trend ending?
・Which time frame is good to use?
・Blind spots can be at monthly and weekly key levels!
・Demonstration of Fibonacci retracement on the euro-dollar monthly chart
・Fibonacci lines are a “signal to everyone”!
・People who trade with front-running look at Fibonacci, right!?
● Video length: 13 minutes 35 seconds
<A quick preview video>
How to watch FX videos
The FX video is embedded in the section at the bottom of this article, which is available to those who have purchased the article. Click the play button to start the video.