

Future market outlook, strategies and opportunity currencies (from 9/12)
Hello, this is One Piece Trade (@onepipst)
From 9/12, I would like to outline the market outlook, set strategies, and look for entry points
Horizontal lines and trendlines are drawn based on the daily chart
I also post about profits and other useful things so please follow Twitter.
- USD/JPY
- EUR/USD
- EUR/JPY
- GBP/USD
- GBP/JPY
- Afterword
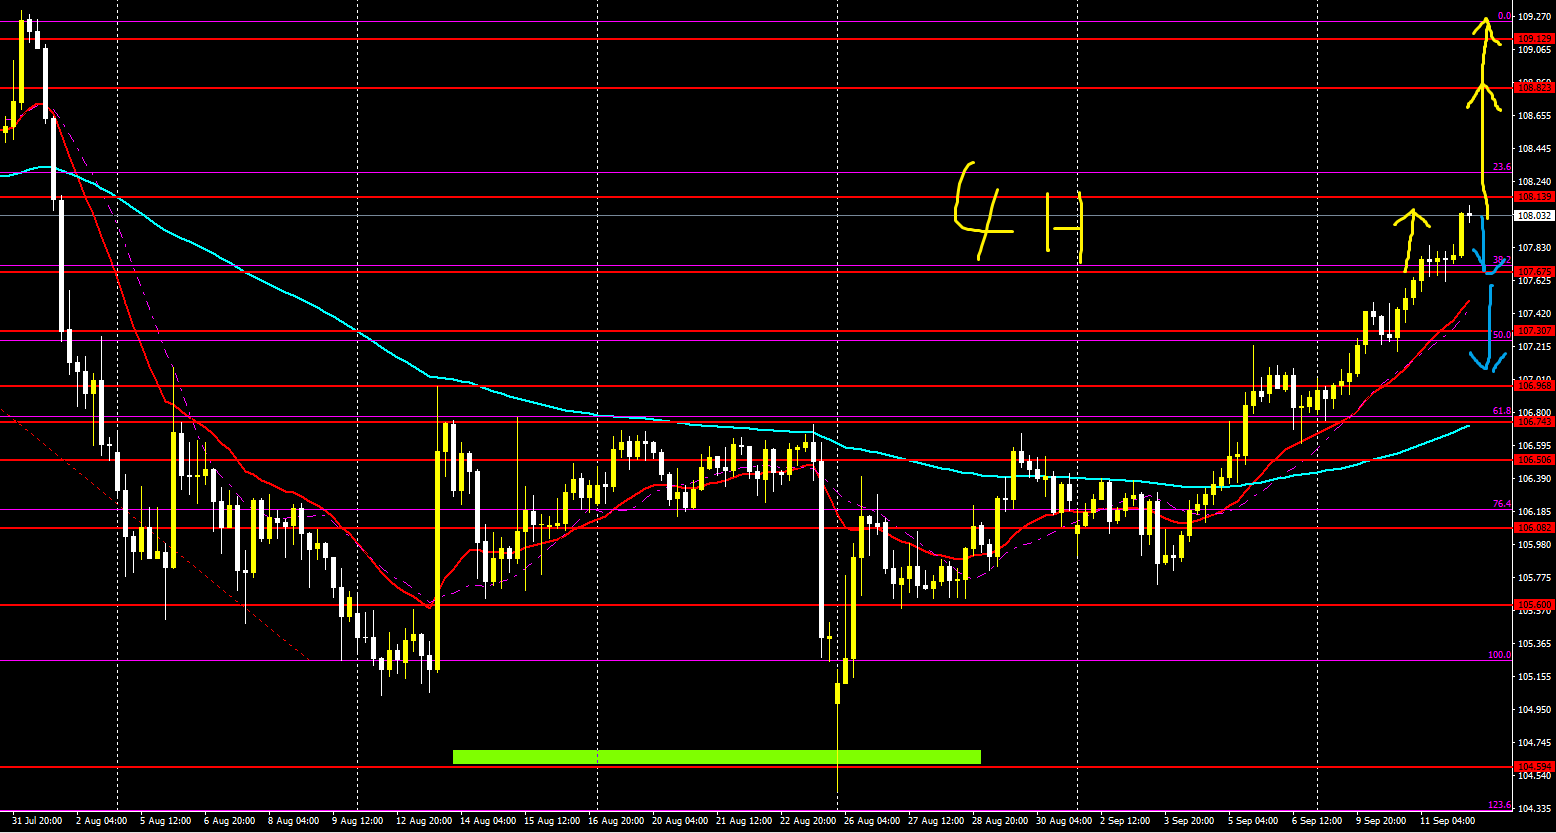
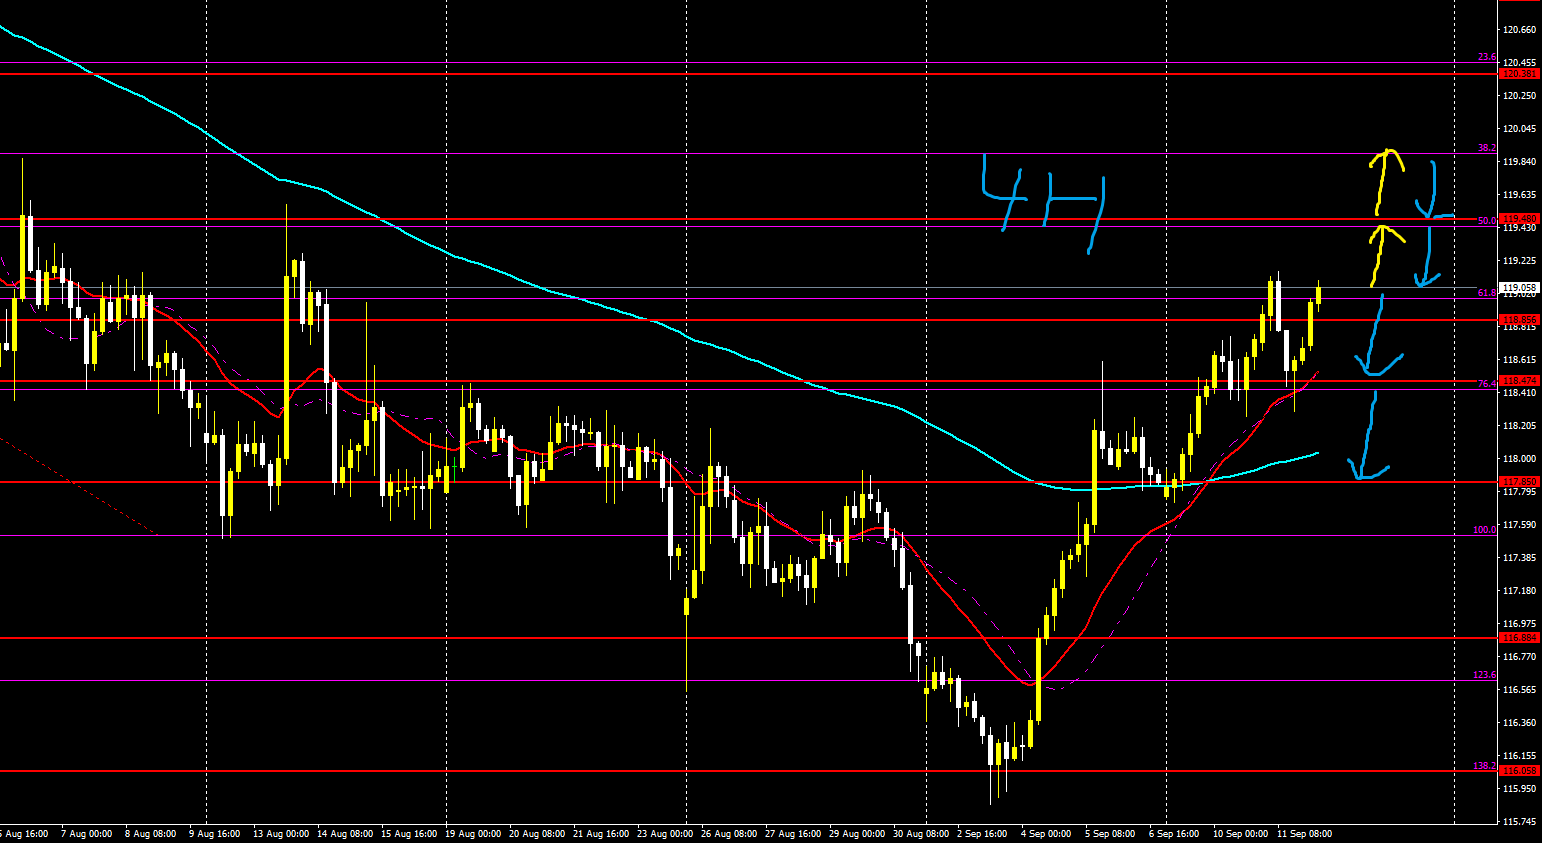
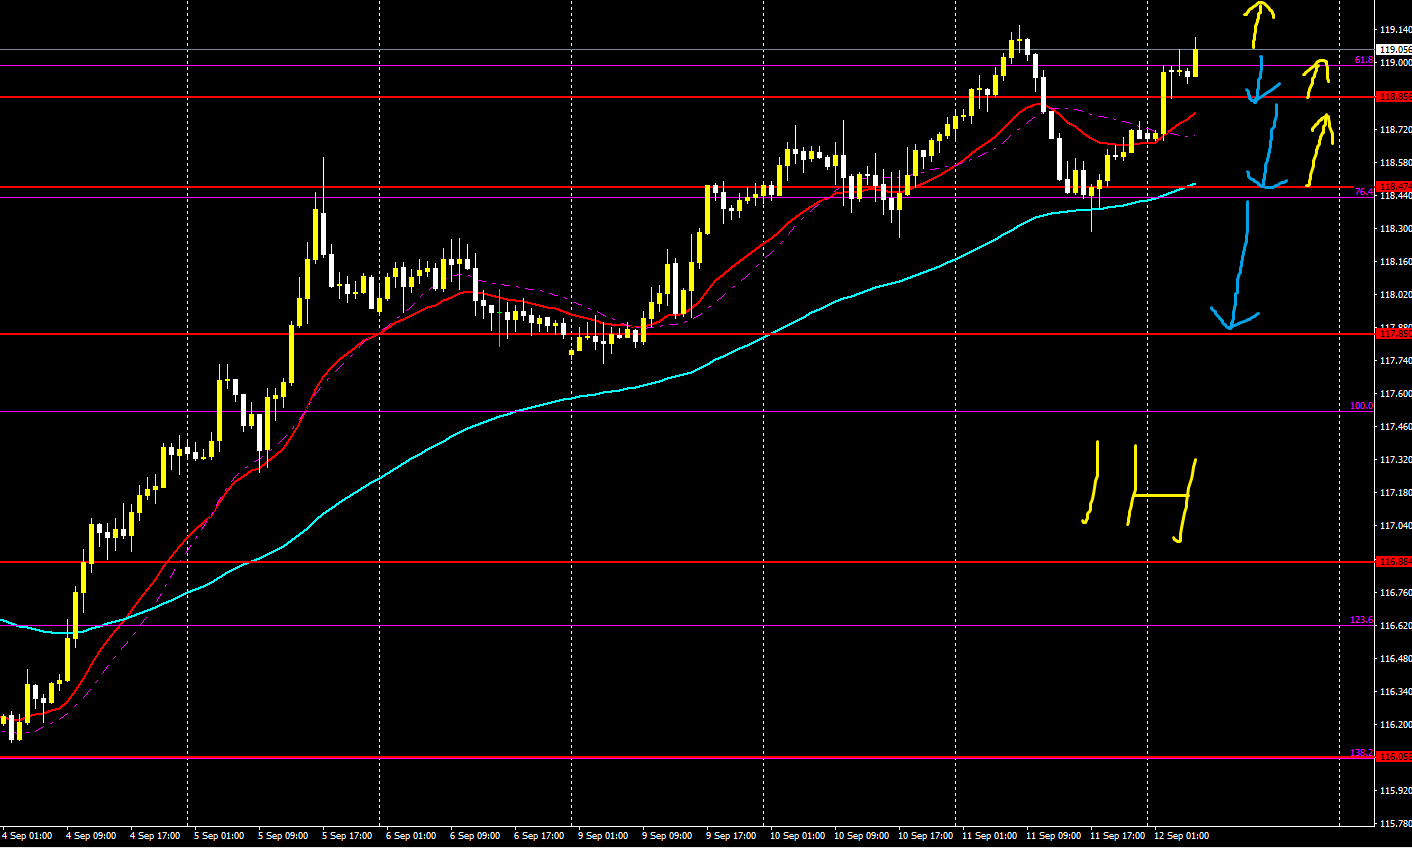
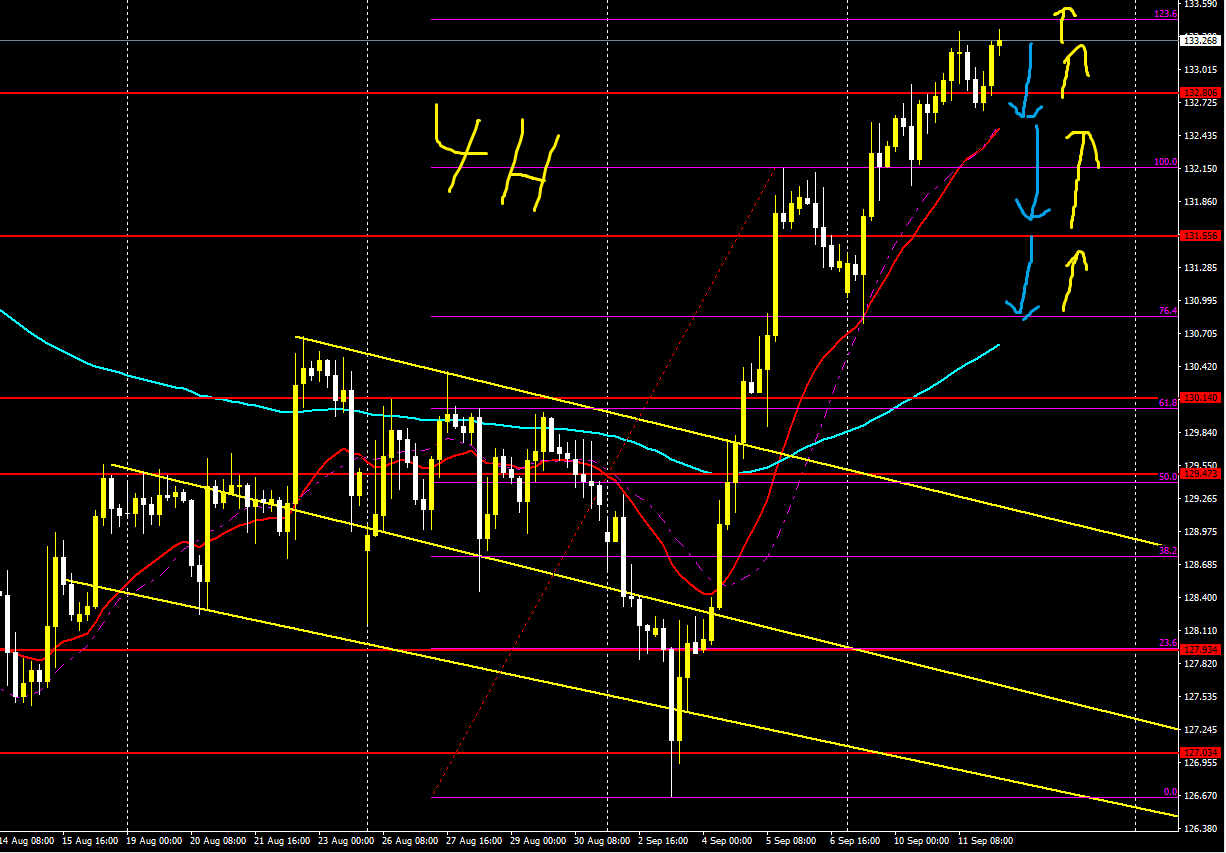
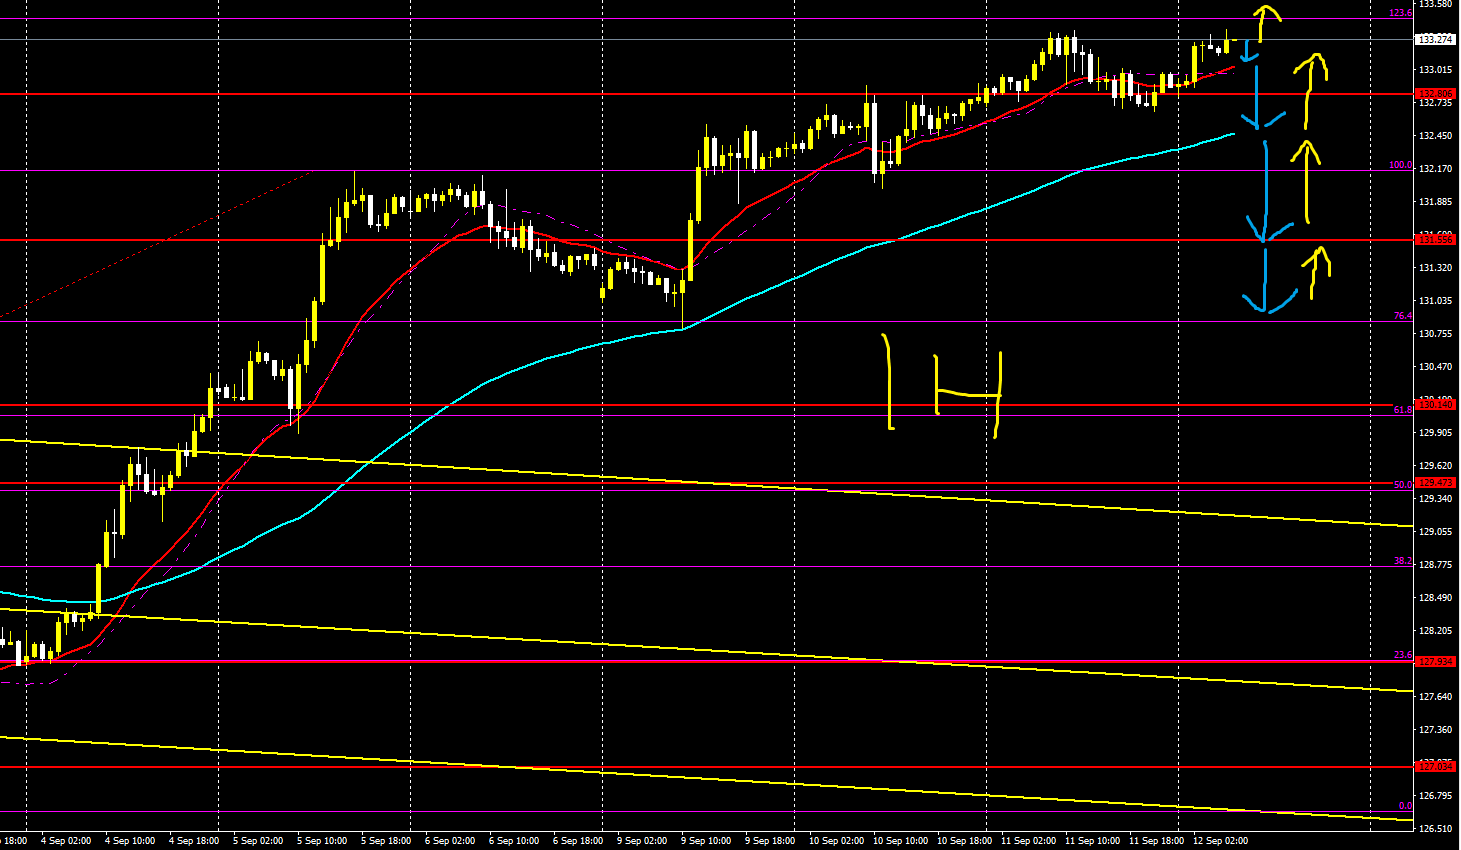
【USDJPY】
Trading difficulty A-
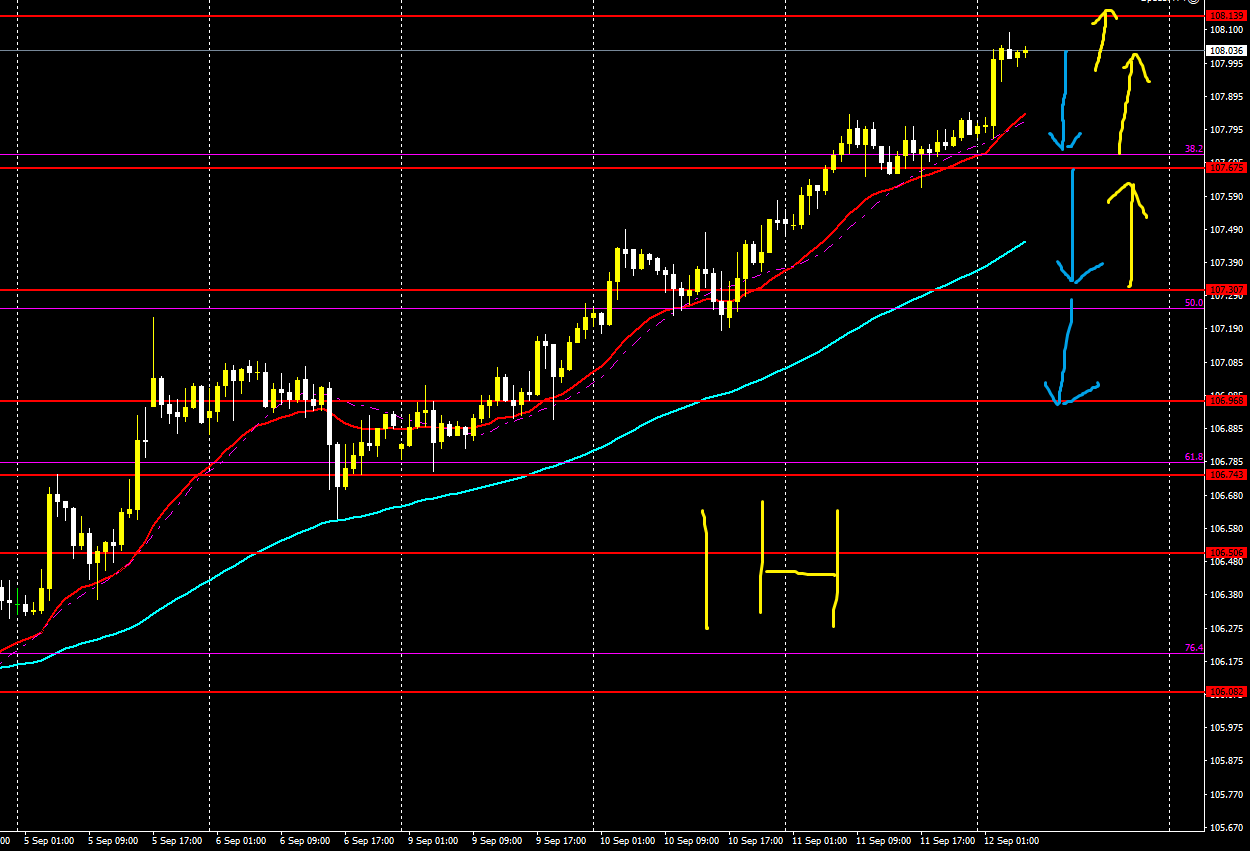
Long-term is down, short-term is up
Buying momentum is strong
So buy while watching for pullback sales
Should I pick up pullbacks in the short term
Or enter with a counter-trend sell on pullbacks
4 hours
1 hour
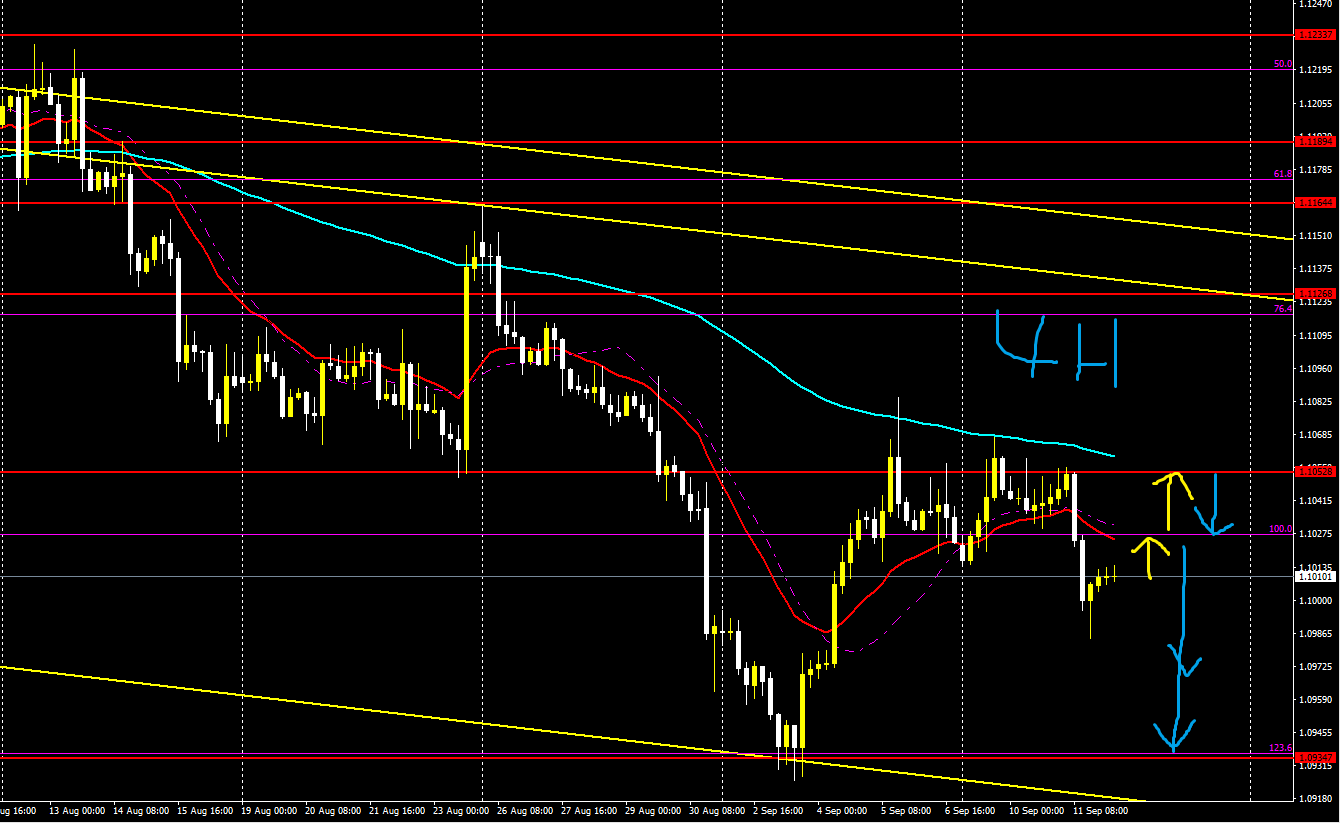
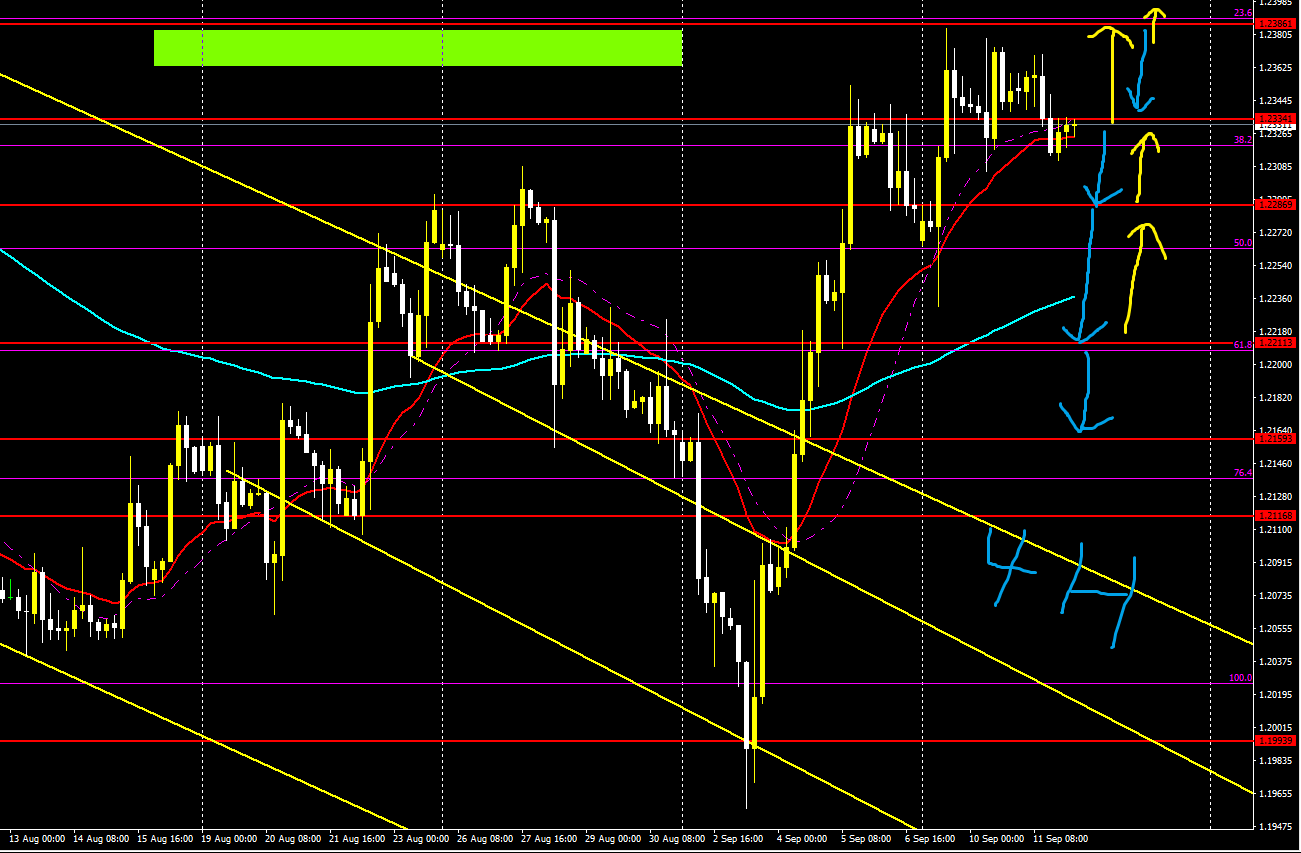
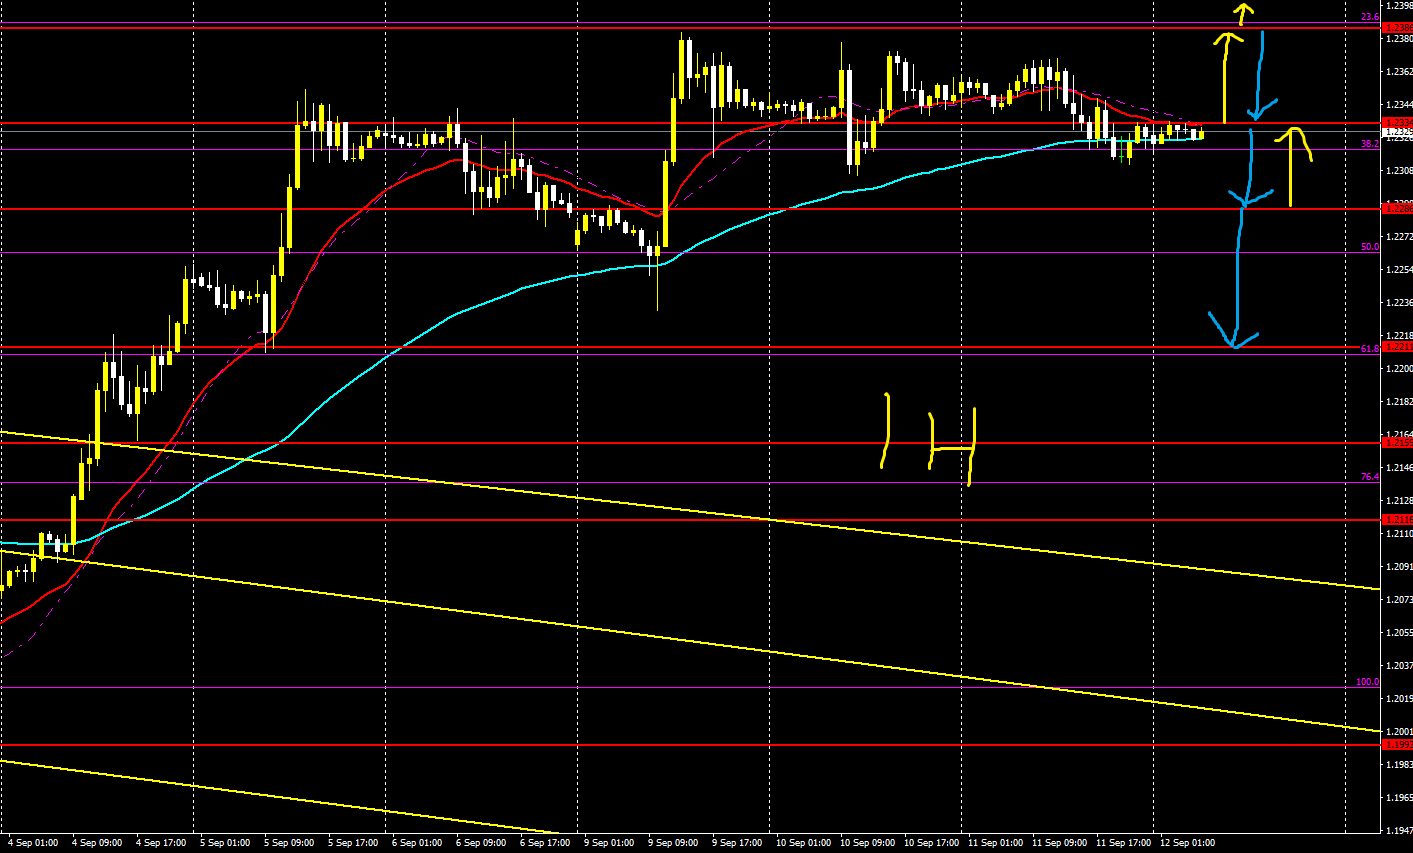
【EURUSD】
Trading difficulty A-
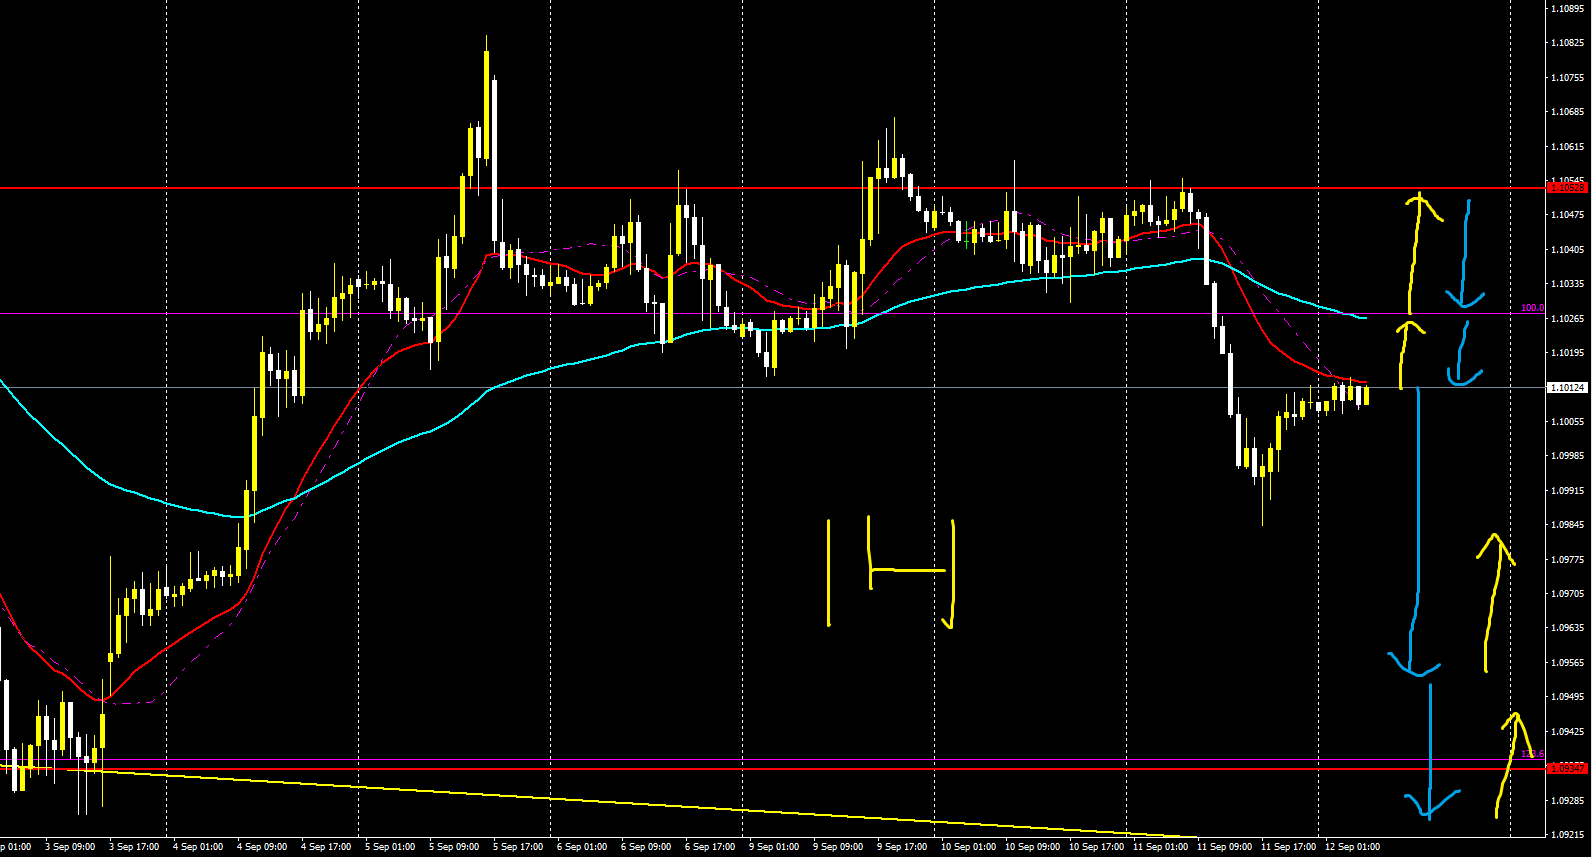
Long-term is down, short-term slightly down
It has broken out of the range
So there may be retracements and selling coming in
Aim for selling on retracements
Conversely, there might be buying up to the range top again, so buying is also acceptable
4 hours
1 hour
EURJPY】
Trading difficulty A-
Long-term is down, short-term up
Buying pressure is strong
If it breaks the high, aim for the Fibonacci 50 level
Short-term pullback buying opportunities
Alternatively, selling on pullbacks is also possible
4 hours
1 hour
【GBPUSD】
Trading difficulty A-
Long-term is up, short-term also up
On the daily chart there is a slight uptrend, but there is a nearby support, so selling again is likely
Fibonacci 23 is a support line
Buying momentum is weakening a bit
Whether a big sell-off comes or it is just a pullback remains to be seen
If it rises in the short term, buy
4 hours
1 hour
【GBPJPY】
Trading difficulty A-
Long-term up, short-term up
Buying momentum is strong
However, if GBP/USD declines, the outcome is unclear
There is a possibility of a large sell-off
Nevertheless, it may still be okay to pick up pullbacks
So in the short term, I’d like to accumulate on pullbacks
But stay wary of retracements
4 hours
1 hour
【Afterword】
The arrows drawn in the image indicate the preferred directions
Yellow indicates upward
Light blue indicates downward
Trading difficulty
The closer to A, the easier
But it only indicates an advantage in that direction; it does not guarantee reaction or rebound at that rate
However, the arrows are drawn near important levels, so please use them as a reference for trading
Arrows may become take-profit or stop-loss points
And similarly, lines and Fibonacci levels can be used as references for take-profit, stop-loss, and entry points
I post market forecasts and strategies on YouTube every week, and they are usually quite accurate
The key is how you apply them to trading or entries
When market strategy is correct or incorrect, your trading approach and thinking will differ
And please consider entries as a separate matter