During the holidays, how about researching indicators?
It seems interesting and educational for beginners to intermediate traders!
You can combine various oscillators and indicators to generate your own buy/sell signals!
"Filter Arrangement Signal"
Enter when MACD and ADX align,
Enter when RSI and Stochastic align,
I think many traders are trading like this.
It's a combination as a filter feature to improve entry accuracy.
What if you could freely combine these filter functions?
What if you could filter and refine the signals?
If you could do this, you could gain an edge in trading. ( ^ ^ )/
(From the sales page)
Indicators and oscillators are used somewhat casually by many people, but
what do they actually mean and how can you apply them to trading?
I think there are many who don't know them in detail.
For my part, I knew RSI, Stochastic, MACD, etc., but I wasn't familiar with CCI or RVI in detail!
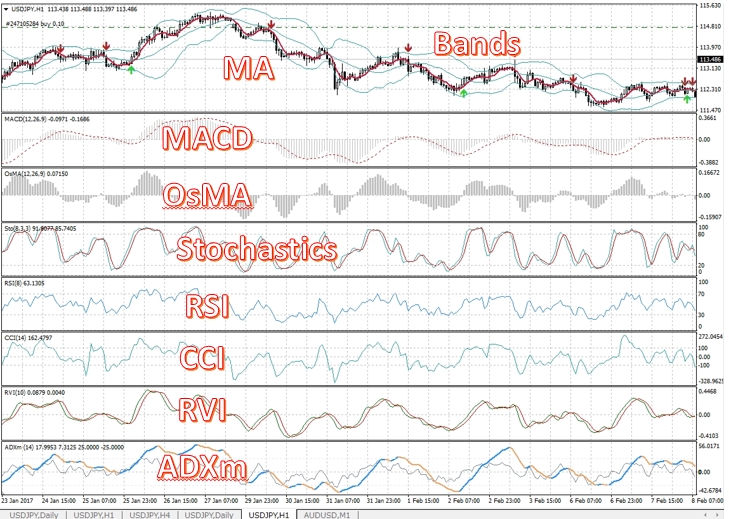
There are nine technical indicators that can be used as filters
• MA
• MACD
• OsMA
• Stochastic
• RSI
• CCI
• RVI
• ADX
That's right
I've briefly looked into each indicator, so if you're not familiar, please use this as a reference.
(MA、Bands are omitted)
【MACD】
“MACD (Moving Average Convergence Divergence Trading Method)” translates in Japanese as “Moving Average Convergence-Divergence Method.” It was developed in 1979 by Gerald Appel, and in simple terms, it is a technical indicator that shows the divergence between two moving average lines.
As a buy/sell signal, there are methods to time trades using the MACD and the “Signal” line's “Golden Cross” and “Dead Cross,” and methods that time based on crossing above or below the zero line.
(http://mituwasou.com/indicator/oscillator/macd.html quoted)
【RSI】
RSI (Relative Strength Index) translates to “relative strength index” in Japanese, but RSI is one of the representative contrarian technical indicators introduced in 1978 in “New Concepts in Technical Trading Systems” by J. W. Wilder.
RSI values range from 0 to 100%. Values below 30% indicate oversold, above 70% indicate overbought. Some investors treat oversold as 20% and overbought as 80%.
RSI main setting period
Developers J. W. Wilder and Katler both recommended 14 days as the optimal period, and generally the default is already 14 days.
Besides the recommended 14 days, a 9-day setting is common, but shortening the period makes RSI move sharper, increasing the chance of false signals.
【OsMA】
OsMA is an indicator based on MACD and represents the difference between MACD and MACD Signal. In addition to making MACD signals easier to confirm, it has the benefit of catching market changes sooner than the MACD signal.
The point where OsMA crosses the 0 line coincides with the MACD crossing the signal. Since you only need to confirm the 0 line crossing, it’s a bit easier to confirm than with MACD.
Also, the difference between MACD and the signal changes as 0, widening, narrowing, 0… and so on. Usually, you trade after confirming this 0 point (cross), but that often causes you to miss moves.
Therefore, using the point where the two lines move from expanding to contracting as the signal allows you to react faster than MACD and trade.
【CCI】
CCI is called the “Commodity Channel Index” in Japanese, originally developed for commodity markets. However, nowadays it’s used in FX and various chart analyses as well.
CCI is expressed as percentages such as 50% or −100%. Many oscillator-type values cap at 100%, but CCI has no fixed range. Theoretically can be any value.
A key reference value for CCI is ±100%. When it exceeds this, it’s considered overbought or oversold. However, simply crossing it is not a guarantee of reversal; after all, CCI has no ceiling or floor, so you never know how far it will go. Generally, after overshooting and then reversing, crossing back through ±100% again is considered an entry point.
【RVI】
RVI (Relative Volatility Index) is an oscillator-type technical indicator that applies RSI.
It can determine whether market volatility is expanding or contracting.
Volatility refers to the rate of price movement; high volatility means larger price changes.
Essentially, entry points are crosses with the signal line and crossing above or below the 0 line.
However, when trading on crosses, you should combine with other indicators such as moving averages, otherwise there are many false signals.
【Stochastic】
Stochastic is based on 20% and 80%; below 20% is oversold, above 80% is overbought.
Stochastic is strong in ranging markets. However, like other oscillator-type indicators, it is weak in trends; strong trends cause it to stay near the highs and lows.
Originally, stochastic judged oversold when approaching the high of the look-back period and overbought when approaching the low. If a trend continues to set new highs or lows, it becomes meaningless.
Even if a signal appears in such conditions, it would lead to a series of false signals. To avoid this, it’s necessary to understand the overall direction.
【ADXm】(There is no ADX description, so it’s labeled ADXm)
ADXm is an indicator built on ADX.
Two color lines are an improved ADX, the gray line is DI.
DI is calculated as +DI minus -DI; the 0 line is the boundary. Values above 0 indicate bullish conditions; values below 0 indicate bearish conditions. When moving around the 0 line, the market is in consolidation.
ADX normally removes directionality and shows only volatility, but this ADXm uses adjusted DI to reintroduce directionality. The movement is similar to CCI.
Now, what would happen if you actually display each indicator and oscillator on the chart?
Perhaps some of you are seeing this for the first time.
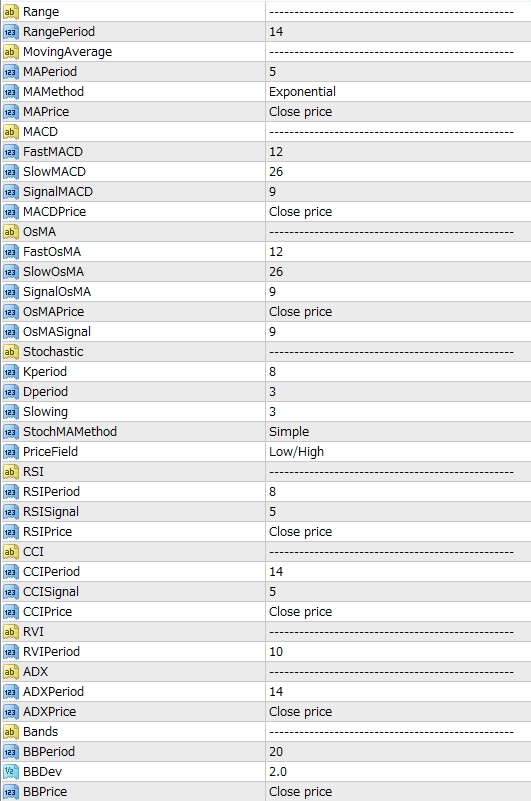
The period of each technical indicator can be changed in the indicator’s parameters.
【What combinations work best is up to you!】
For example…
1. Use Moving Average (MA) as the first filter for buying/selling.
To avoid false signals, set the MA period longer, for example 72.
If the price is above the MA, buy; if below, sell.
2. Then time the entry with RVI using a period of 72.
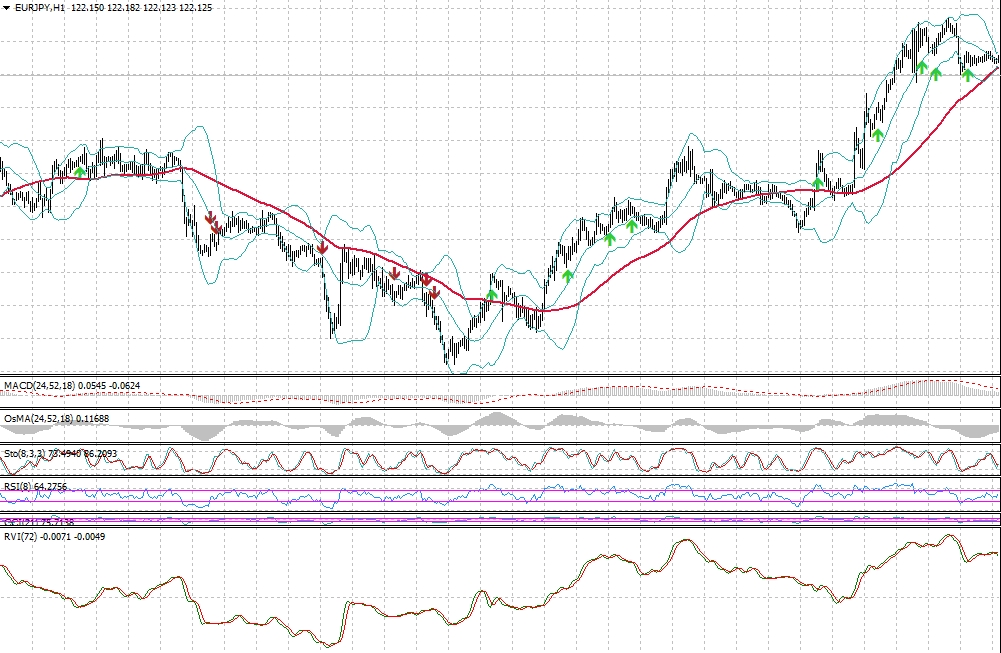
By applying a long-term MA filter, signals appear only in the direction of the trend.
In range markets, you likely want to do reverse trading, so let's try RSI and Stochastic.
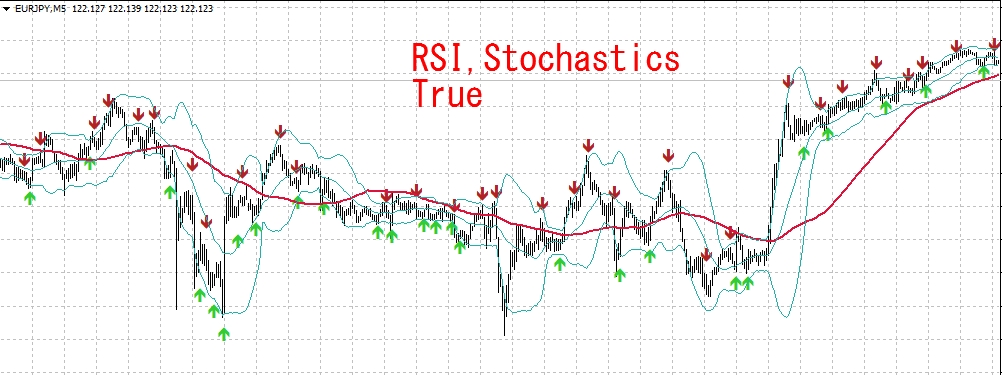
Hmm, this yields too many signals.
I added OsMA as a filter.
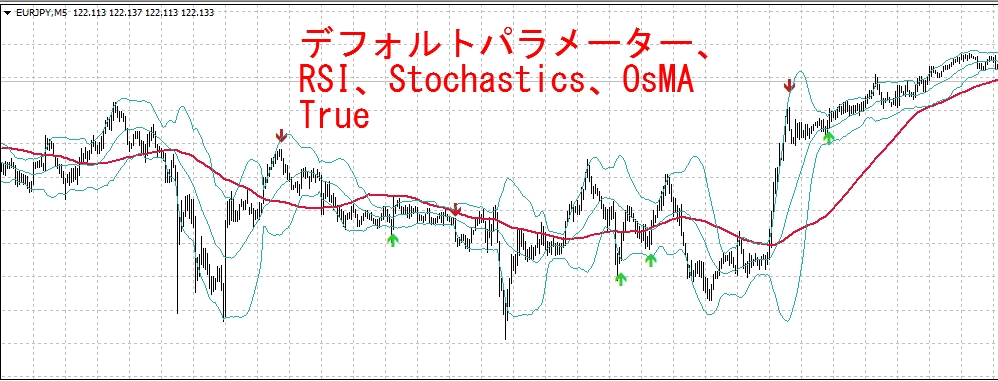
The number and timing of signals are reasonably adjusted!
Creating signals that work for both trend and range is hard, so in a trend, use this and this; in a range, use these… you might make your own settings.
This could be a good opportunity to revisit technical indicators you may have neglected before, you know.
The price is also affordable,
Filter Arrangement Signal