

Future market outlook, strategies and opportunity currencies (from 9/6)
Hello, this is Onepi Trade (@onepipst)
I plan to forecast the market from 9/6, set strategies, and look for entry points
I draw horizontal lines and trend lines based on the daily chart
I also tweet about profits and other useful things, so pleasefollow Twitter.
Table of contents
- USD/JPY
- EUR/USD
- EUR/JPY
- GBP/USD
- GBP/JPY
- Afterword
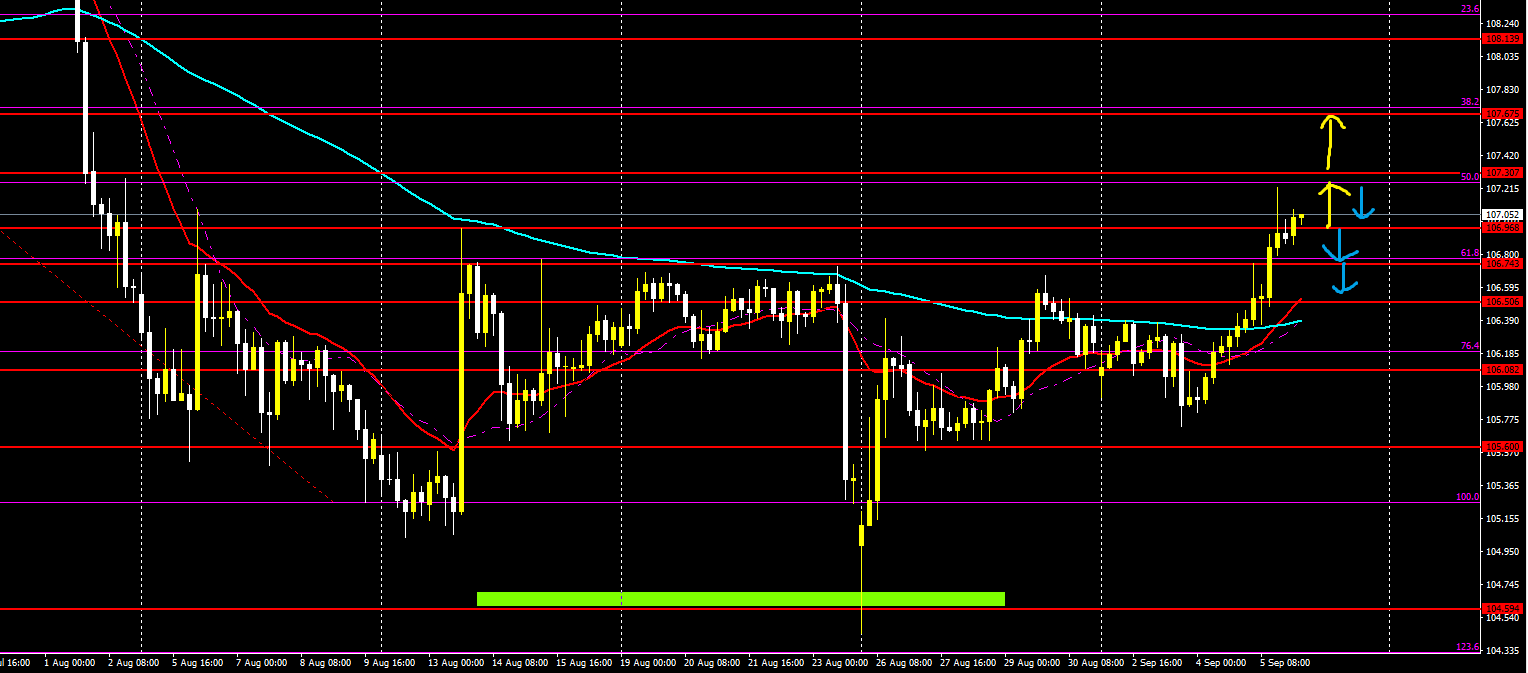
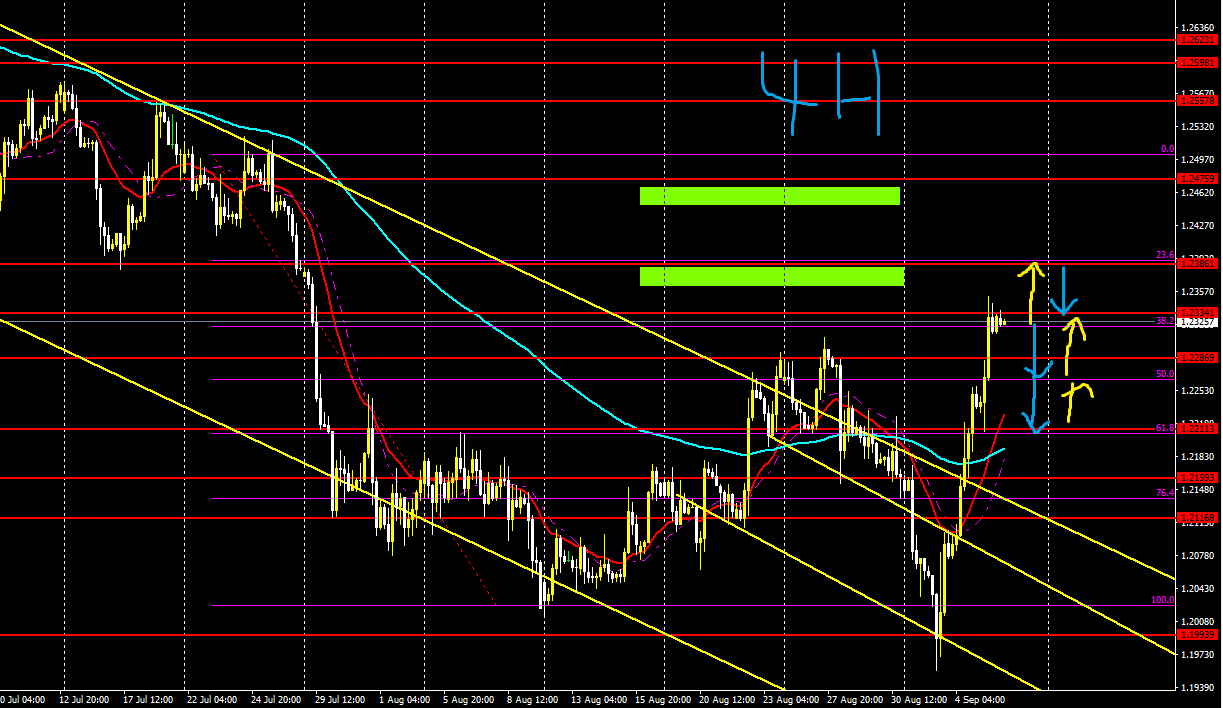
【USD/JPY】
Trading difficulty A-
Long-term outlook is down, short-term is up
Buying momentum is strong
Likely to rise again while pulling back toward higher peaks
So a dip-buying strategy might be fine
Conversely, if the short-term trend breaks, we should sell
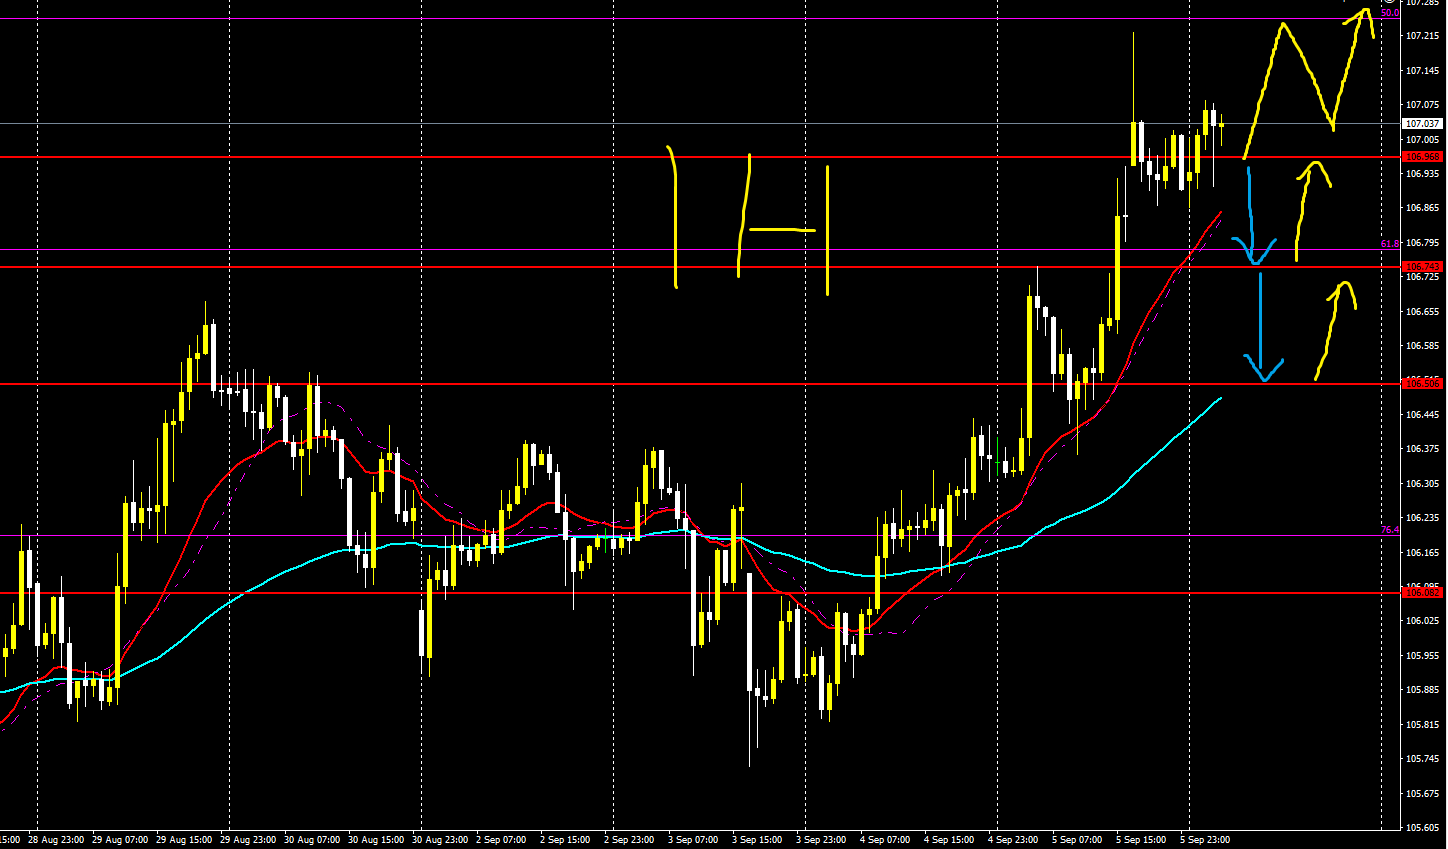
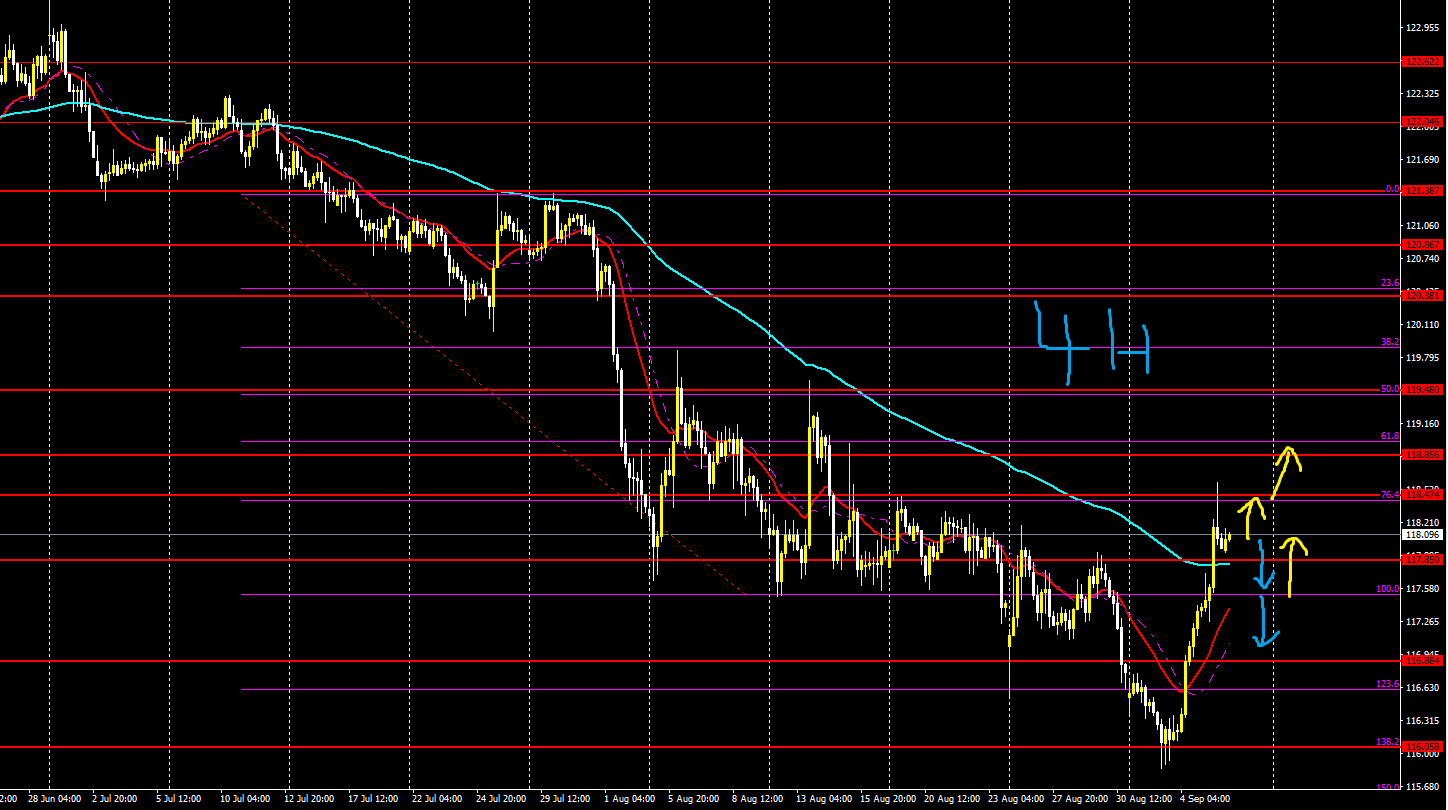
4 hours
1 hour
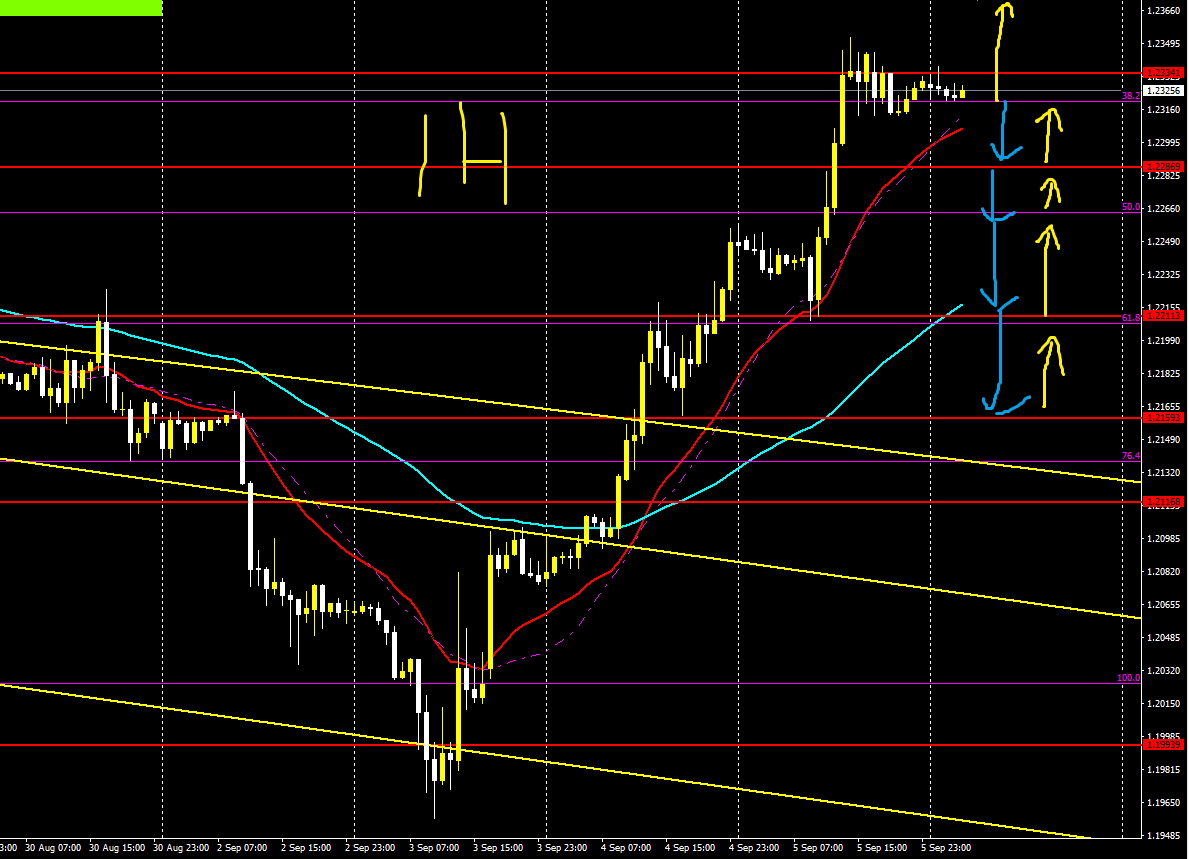
【EUR/USD】
Trading difficulty B-
Long-term outlook is down, short-term is up
Buying may come up to the channel upper limit
So buy strategy
Alternatively, a return move to the channel lower limit could occur, so if the short-term trend breaks, sell
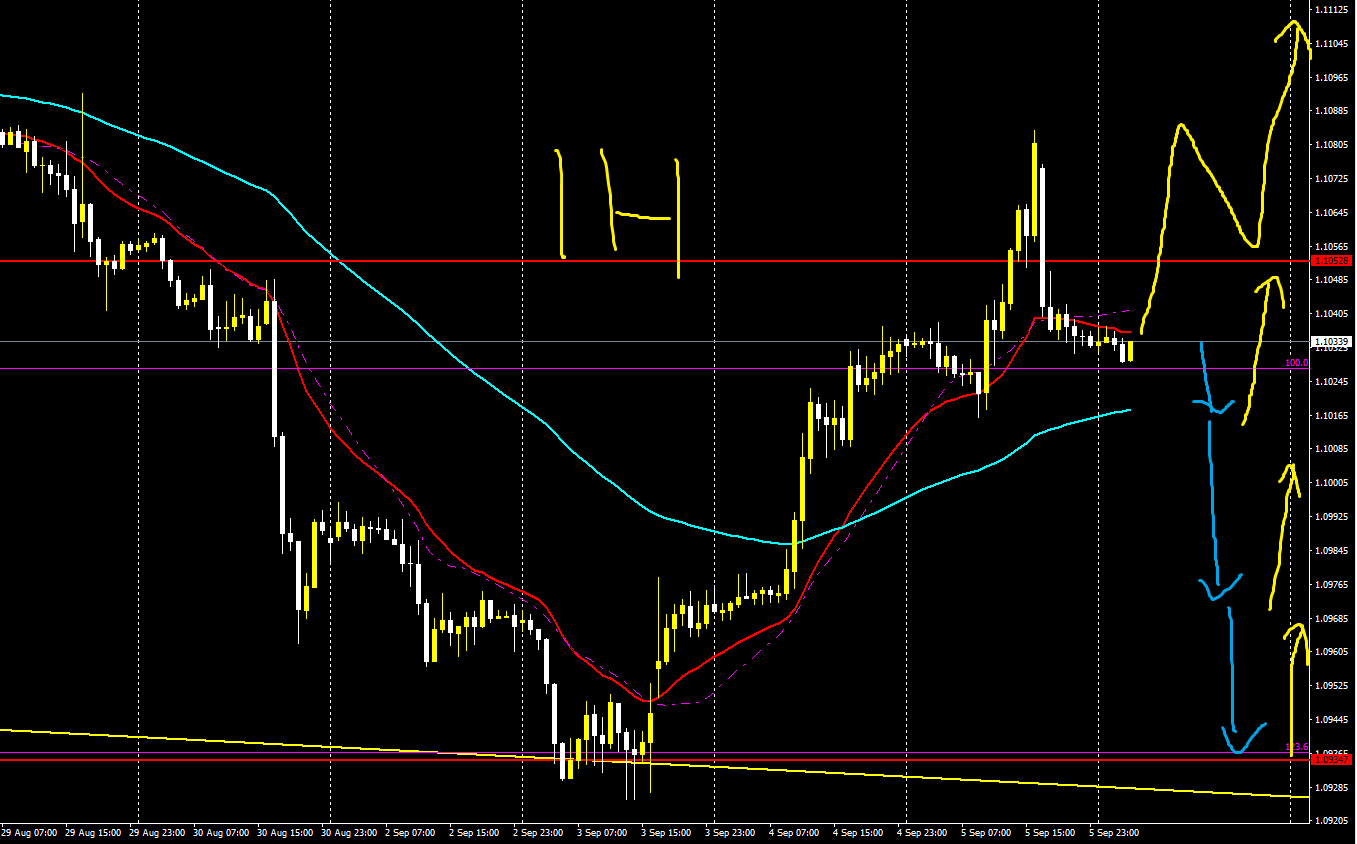
4 hours

1 hour
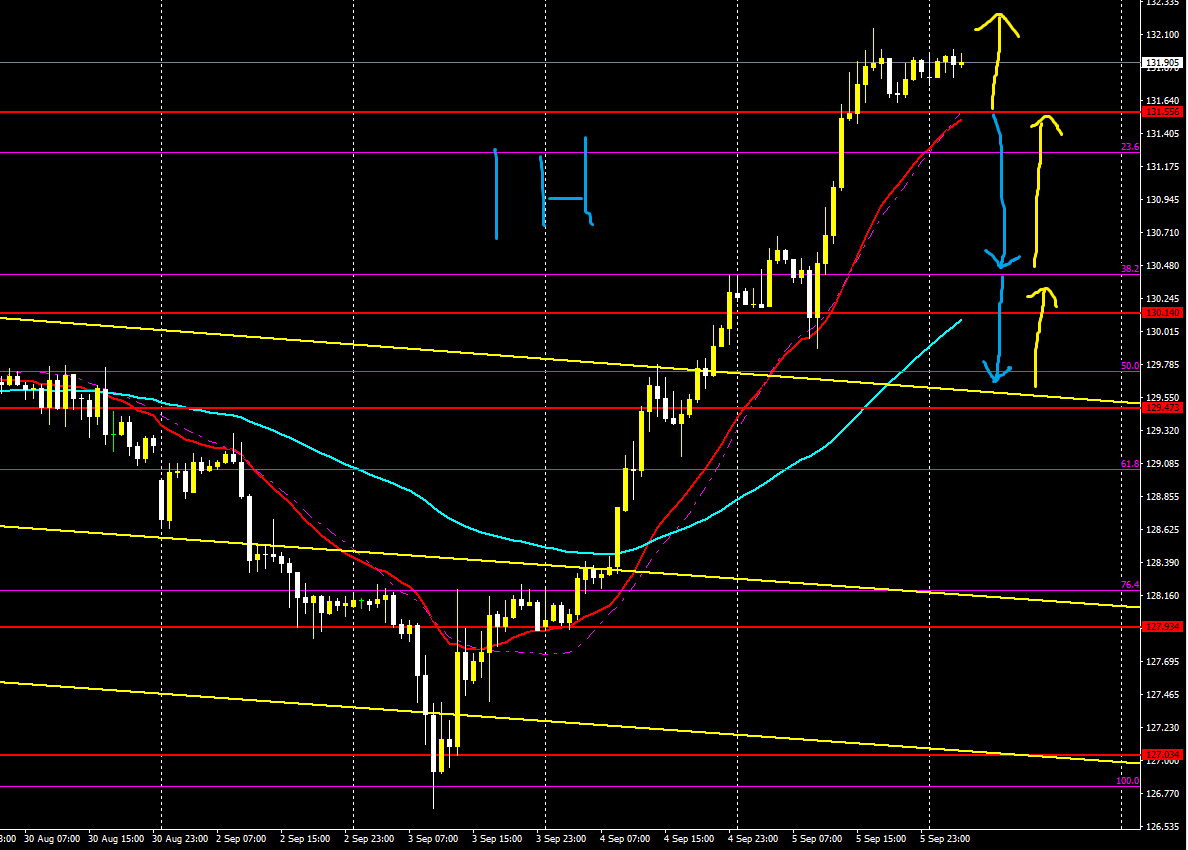
EUR/JPY】
Trading difficulty B-
Long-term outlook is down, short-term is up
Like EUR/USD, a retracement selling or a rise to a high is in play
Trade based on the short-term candles
4 hours
1 hour

【GBP/USD】
Trading difficulty A-
Long-term up, short-term up
On the daily chart a slight uptrend is formed, but there is support just above, so further selling pressure is likely
Whether it breaks the Fibonacci 23 level, and there may be a selling retreat to pullback
Short-term counter-trend selling might be good
However, if it continues rising, buy
4 hours
1 hour
【GBP/JPY】
Trading difficulty A-
Long-term up, short-term up
GBP/Japanese yen also shows an uptrend on the daily chart
If buying continues, buying toward Fibonacci 0 or around 134 yen
Conversely, if pullbacks occur, selling to Fibonacci 38
4 hours

1 hour
【Afterword】
The arrows in the image indicate the favorable directions
Yellow is upward
Light blue is downward
Trading difficulty
The easier it is to A, the easier
It only means there is an advantage in that direction; it does not guarantee a reaction or rebound at that rate
However, since arrows are drawn near key levels, please use them as a reference for trading
The arrows may become profit targets or stop-loss points
And lines and Fibonacci can also serve as references for profit-taking, stop-loss, and entry points
Market forecasts and strategies are updated on YouTube weekly and are generally accurate
What matters is how you apply them to trading and entries
When the market strategy was correct or incorrect, your trading method and thinking will differ
And please treat entries as a separate matter