[For Absolute Beginners] The Power of the Lagging Span... With Impactful Image Attached
Hello!! This is Katsumasa Kawase.
In the first column of this column, last time, we touched a little on “how to judge which direction the market is heading now” using the “lagging span.”
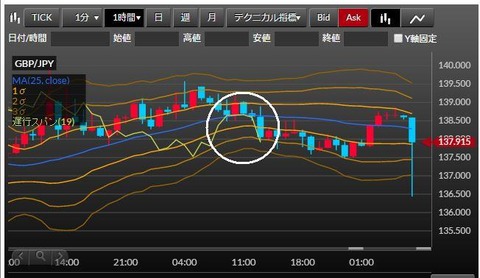
The chart above is a relationship between the shocking candlestick and lagging span that I have seen in the past.
The Lagging Span (the zigzag yellow line on the chart above) is simply the price action slid to the past (to the left).
Looking at the far-right of the chart, the market shifts sharply toward yen weakness (strength of yen appreciation), but if you look at the white circle, you can see that for some reason the lagging span is neatly blocked by the candlesticks.
In other words, the current price movement is greatly influenced by past price movement.
Then why does this happen?
Honestly, I don’t really understand it either, haha.
Nevertheless, this is a fact, and it is not a coincidence or random phenomenon that occurs frequently.
As long as it is true that current price movement is influenced by past price movement, there is no reason not to use this when judging whether the market is going up (yen depreciation) or down (yen appreciation), right?
If you can believe this, I explain it in more detail on my blog, so please take a look.
Next time, I plan to cover “The Power of the Lagging Span (Part 2).”
Well, that’s all for today.
Kawase
(I write in detail about investment results and how to set up the lagging span in my blog…http://50sai.xyz/ Employee of a Retrenchment Generation! FX from age 50)