

This time, the ultimate selling point for USD/JPY! And the take-profit point is here!
June 5, 2016, 8:00 PM
Since roughly the end of last year, the dollar-yen market has inverted but still cannot confirm a bottom and is moving within the recent low area this year. The Abenomics era that had continued until last year could be interpreted not so much as a failure, but rather as a shift in external conditions triggered by concerns about China and other factors. It may be more accurate to view the current dollar/yen move as a basic tendency to revert from an artificial, forced dollar-selling phase back to the original regime; the downside spread up to around 100 yen can be seen as a corrective area. Beyond that, it will depend on the U.S. dollar and China concerns resurfacing, and U.S. stocks trading near historical highs could be the key moving forward.
This time too, the dollar/yen attempted a rebound but collapsed around the 123 yen area, falling first to the 110 range, and after a 38.2% retracement it hit the 105 yen level once again. With the Bank of Japan implementing negative interest rates at the high 121 yen area, the 38.2% retracement from that high, or the slow rebound just before 115 yen with a 61.8% retracement, was also met with resistance. Fibonacci retracements have long been a benchmark used by many; when you connect the high and low with key points, a clear market structure emerges. The Ichimoku cloud on the daily chart shows the price repeatedly approaching the cloud after a decline, but as long as the trend remains down, the price stays below the cloud. In such a market, what if the price nears the cloud, bounces back, and a sell signal lights up? That can be a setup opportunity, though some traders may hesitate, wondering if it will reverse and break above the cloud. But that is market behavior, and to trade you must monitor how to minimize stop losses and enter positions; repeating such positioning could multiply profits.
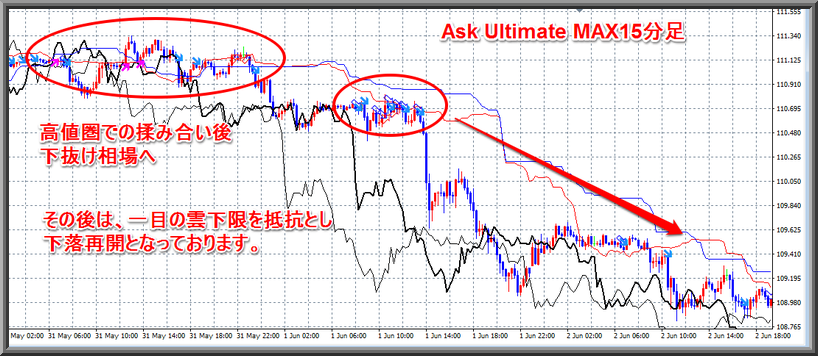
Ask Ultimate MAX—The dollar-yen daily chart shows a strong sell signal at the point of the rebound. For a long-term position, even simply entering on the daily chart can yield profits, but this product includes sell/buy signals on all timeframes in real time, indicating overbought and oversold conditions. At the current 111 yen range, if it had sustained for a few more days, the daily chart would have issued a buy signal, but the decline resumed just before the signal. The pre-decline signal, as seen on the 15-minute and 1-hour charts, originates from points entwined with each timeframe’s cloud. This turned into an ultimate selling opportunity. Naturally, even short-term trading can be managed by monitoring the 15-minute or 1-hour charts, as you can see.
The entry point has become clearly identifiable, so I’ll briefly demonstrate this software for the timing of profit-taking. This is a multi-time-frame setup, allowing you to verify market strength across different timeframes. In several articles, it’s noted that in the dollar-yen market, after oversold signals (danger) appeared, there is a brief rebound. For swing trading, the oversold signals on the daily and weekly charts are the best profit-taking points. Of course, such points can also form the basis of a seasonal strategy to anticipate reversals. However, the current dollar-yen market remains in a long-term downtrend, so until a weekly chart shows a change, the main strategy is to sell on rallies.

To narrow down the points, it’s essential to focus on the 5-minute to 1-hour charts.
This time, the rebound is nearly at its peak, and even if you were caught in the opposite direction, losses would have been small.
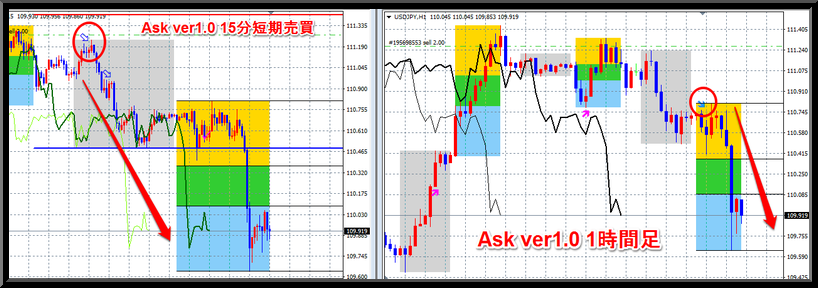
Ask Ultimate MAX originated as Ask ver 1.0, and here we have programmed a special candlestick pattern plus Fibonacci lines. In the 15-minute timeframe, there are short-term trading rules, and now for traders primarily trading USD/JPY, you can purchase Ask Ultimate MAX USD/JPY Limited Edition as a set and almost get it for free!
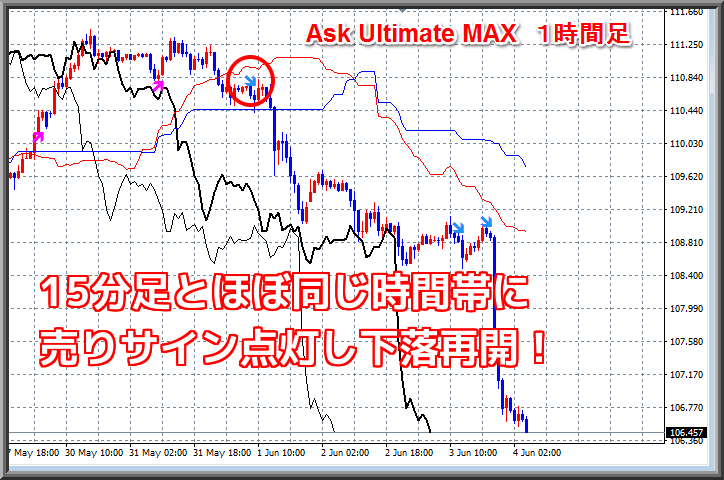
Signals on the 1-hour chart are the same, but the special candlesticks help time day trading!
The indicators are affordable, but will the signals continue to appear at such ultimate points forever?
To address this, FX-On has partnered to offer Ask Ultimate MAX (trial version) as a bonus for purchasers, so please start by experiencing this for the currency pairs supported, and get a feel for the 2016 year-end market.
Read the FX strategy blog by Kawase Rugi
Since roughly the end of last year, the dollar-yen market has inverted but still cannot confirm a bottom and is moving within the recent low area this year. The Abenomics era that had continued until last year could be interpreted not so much as a failure, but rather as a shift in external conditions triggered by concerns about China and other factors. It may be more accurate to view the current dollar/yen move as a basic tendency to revert from an artificial, forced dollar-selling phase back to the original regime; the downside spread up to around 100 yen can be seen as a corrective area. Beyond that, it will depend on the U.S. dollar and China concerns resurfacing, and U.S. stocks trading near historical highs could be the key moving forward.
This time too, the dollar/yen attempted a rebound but collapsed around the 123 yen area, falling first to the 110 range, and after a 38.2% retracement it hit the 105 yen level once again. With the Bank of Japan implementing negative interest rates at the high 121 yen area, the 38.2% retracement from that high, or the slow rebound just before 115 yen with a 61.8% retracement, was also met with resistance. Fibonacci retracements have long been a benchmark used by many; when you connect the high and low with key points, a clear market structure emerges. The Ichimoku cloud on the daily chart shows the price repeatedly approaching the cloud after a decline, but as long as the trend remains down, the price stays below the cloud. In such a market, what if the price nears the cloud, bounces back, and a sell signal lights up? That can be a setup opportunity, though some traders may hesitate, wondering if it will reverse and break above the cloud. But that is market behavior, and to trade you must monitor how to minimize stop losses and enter positions; repeating such positioning could multiply profits.
Ask Ultimate MAX—The dollar-yen daily chart shows a strong sell signal at the point of the rebound. For a long-term position, even simply entering on the daily chart can yield profits, but this product includes sell/buy signals on all timeframes in real time, indicating overbought and oversold conditions. At the current 111 yen range, if it had sustained for a few more days, the daily chart would have issued a buy signal, but the decline resumed just before the signal. The pre-decline signal, as seen on the 15-minute and 1-hour charts, originates from points entwined with each timeframe’s cloud. This turned into an ultimate selling opportunity. Naturally, even short-term trading can be managed by monitoring the 15-minute or 1-hour charts, as you can see.
The entry point has become clearly identifiable, so I’ll briefly demonstrate this software for the timing of profit-taking. This is a multi-time-frame setup, allowing you to verify market strength across different timeframes. In several articles, it’s noted that in the dollar-yen market, after oversold signals (danger) appeared, there is a brief rebound. For swing trading, the oversold signals on the daily and weekly charts are the best profit-taking points. Of course, such points can also form the basis of a seasonal strategy to anticipate reversals. However, the current dollar-yen market remains in a long-term downtrend, so until a weekly chart shows a change, the main strategy is to sell on rallies.
To narrow down the points, it’s essential to focus on the 5-minute to 1-hour charts.
This time, the rebound is nearly at its peak, and even if you were caught in the opposite direction, losses would have been small.
Ask Ultimate MAX originated as Ask ver 1.0, and here we have programmed a special candlestick pattern plus Fibonacci lines. In the 15-minute timeframe, there are short-term trading rules, and now for traders primarily trading USD/JPY, you can purchase Ask Ultimate MAX USD/JPY Limited Edition as a set and almost get it for free!
Signals on the 1-hour chart are the same, but the special candlesticks help time day trading!
The indicators are affordable, but will the signals continue to appear at such ultimate points forever?
To address this, FX-On has partnered to offer Ask Ultimate MAX (trial version) as a bonus for purchasers, so please start by experiencing this for the currency pairs supported, and get a feel for the 2016 year-end market.
written by Kawase Rugi
Read the FX strategy blog by Kawase Rugi
× ![]()


