

U.S. money velocity, momentum to halt the long-term decline Japan Economic Pulse Co., Ltd.
Release date: 2017/03/03 18:51
In the United States, the money velocity (nominal GDP/money supply), which indicates the turnover of money and the degree of credit creation, has begun to show signs of stabilizing after the long decline since 2008. It has not yet fully bottomed, but the declines are slowing year-on-year and quarter-on-quarter, and together with the maintenance of accommodative monetary policy by the Fed and the policy expectations of the Trump administration, an awakening of animal spirits is helping revive the credit-creation loop, anchor price bottoms, and drive a sustainable positive feedback loop toward a mild inflation society. The Fed’s gradual normalization of rates should also be more easily supported.
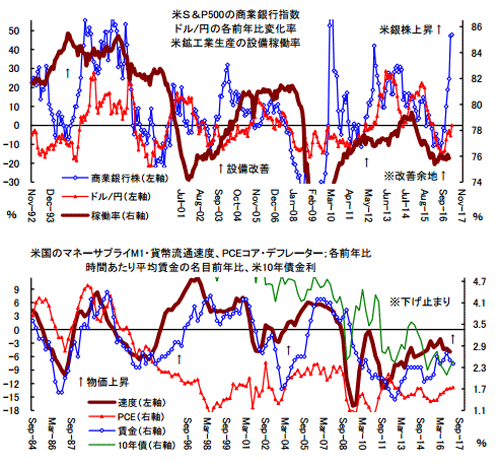
U.S. bank stocks are up about 50% year-over-year, and historically gains have fed through into capital expenditure.
"(As of 2010) The U.S. economy is closest in history to Japan-style deflation with long-term stagnation. In the United States, money velocity (Money Velocity) is also continuing to decline, and no matter how much the money supply increases, as long as this velocity shrinks (i.e., demand shrinks), prices will not rise"—.
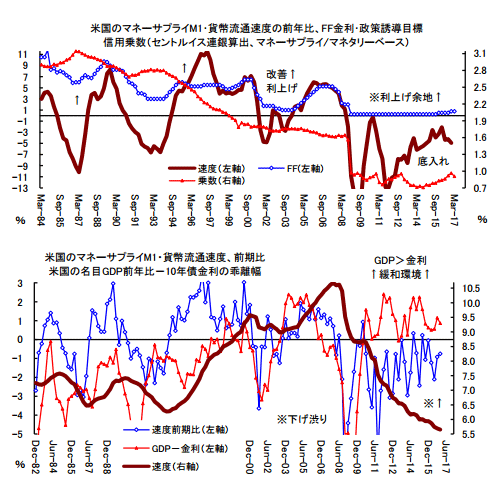
In July 2010, the president of the Federal Reserve Bank of St. Louis, James Bullard, warned in a paper with this nuance. He further suggested that if a shock hits the U.S. economy, expanding quantitative easing through purchases of U.S. Treasuries would be more appropriate, and if the money stock increases further, inflation expectations would change. Subsequently, following this warning, the Fed in November of that year moved to strengthen the bold Second Round of QE (QE2). Six years have passed since QE2, yet the money velocity in the United States, calculated as nominal GDP divided by money supply, has not completely bottomed.
The background factors include: 1) sluggish growth pace of nominal GDP, 2) the Fed maintaining a high balance sheet (reinvesting maturing Treasuries), and 3) the expansion of credit cards and fintech, etc. However, considering the latest 10–12 quarter GDP, the money velocity based on M1 in the U.S. fell by 0.8% quarter-on-quarter (7–9 was -0.9%), marking a clear bottoming trend from the trough of -6.3% in 2011 July–September (Bloomberg statistics reference). Year-over-year it was -4.9%, slightly worse than the previous -4.2%, but the bottoming path has been solidified by troughs of -17.0% in 2009 April–June and -13.0% in 2011 December, etc.
Put simply, money velocity is the average turnover rate of money (currency) that is used through transactions. When money goes toward consumption and investment, and when the economy expands so that GDP grows faster than the money supply (money stock), the velocity of money increases. Conversely, if the GDP growth rate is smaller than the money supply growth rate, the velocity of money declines. In this sense, the current slowdown in money velocity in the United States suggests a normalization of the financial economy and a easing of deflationary pressures.
The sustained low-rate environment and the easing money supply by the Fed flow back into the real economy as “living money,” reinforcing a sustainable positive feedback loop through the restoration of the credit-creation cycle, price bottoms, and a return to a mild inflation society. Moreover, it supports the Fed’s aim of gradual rate hikes toward not tightening but achieving financial normalization (neutralization). In addition, as credit creation is recovering, executives’ animal spirits have begun to awaken due to policy expectations under the Trump administration. Expectations for easing financial regulation and the Fed’s rate-hike warnings are also triggering demand for funding before rate increases. The S&P 500 financial and commercial bank stock index has risen to intraday levels around 445, facing the high at 2007. YoY, gains are nearly 50%, but historically bank stock upswings have been leading indicators for lending trends, capital expenditure, and credit creation.
Money velocity improvement, the sign of the Fed rate-hike cycle
In particular, since mid-2014 in the U.S., after the crude oil plunge, capital expenditure in the resource-energy sector, including shale, has sharply declined. The utilization rate of U.S. industrial production peaked at 78.89% in November 2014, and fell sharply to 74.89% in March last year, the lowest since 2010. The most recent January also stayed at 75.35% and stagnation persists. There remains room for improvement toward the recent high of 78% and toward the pre-Lehman level of 80%.
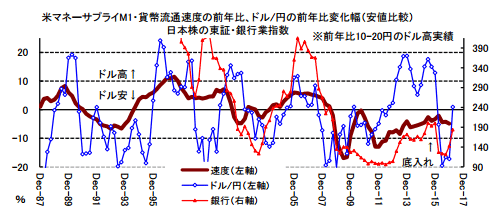
Currently, despite the risk of renewed overproduction and inventory in resource-related sectors, expectations of domestic resource development under the Trump administration and corporate tax cuts are fueling talk that a “capex boom is spreading in the United States” (a senior executive at a major U.S. financial institution). Going forward, after the utilization of existing facilities rebounds, attention will focus on the rise in utilization rates and the growth potential of new capital expenditures. Capex utilization in the United States is closely linked to the output gap, historically correlating with U.S. long-term interest rates and bank stocks, and, indeed, with USD/JPY. Incidentally, the last time money velocity on an M1 base shifted from negative to positive year-over-year was 2004 Q1–Q3. In the same period, the annual wage growth was +1.8% (previous quarter +1.7%), and momentum toward +4.2% by 2006 was ignited. Japan Economic Pulse Co., Ltd. info@j-pulse.co.jp 2017/3/3
The PCE core deflator year-over-year also solidified its bottoming in the latter half of 2003 and rose into the first half of 2007. As a result, the Fed began raising rates in June 2004 and continued the rate-hike cycle through June 2006. Since the 1980s, in years when money velocity expanded on a positive year-over-year basis, such as 1996, 1994, and 1988, the Fed carried out multiple rate hikes in tandem. The current Fed, while uncertainty around wage trends in the March 10 employment report lingers, is strengthening its rate-hike groundwork ahead of the March 15 FOMC meeting.
One reason is that the revised 10–12 GDP, released on February 28, confirmed a stable growth trajectory and reinforced confidence in the return to normality of the financial, economic, and price environment, including money velocity. Moreover, U.S. GDP in 10–12 last year maintained +3.5% nominal year-over-year growth. After bottoming at +2.5% in Q2 last year, it is returning to a modest stable growth. Although U.S. 10-year Treasury yields rose sharply last year, the intrayear high was around 2.64%. As a result, the nominal GDP growth rate ran about +0.9 percentage points above the 10-year yield, and a still ultra-accommodative financial environment remains in place.
The information displayed in this report is for your own use only, and you may not provide it to third parties, redistribute it, independently modify it, or transfer or allow third parties to use copies or modified copies. While we strive for accuracy, we do not guarantee the content. We and the information provider are not responsible for any damages arising from the use of this information. The contents of this report are intended to provide general information about investments and are not a solicitation. Please make your own final investment decisions.


