Trade only when you can win without being bound by the market! The dream of a leisurely, self-sufficient life is realized with "Non-Discretionary FX"
Curate optimal entries with multi-timeframe analysis!
FX攻略.comEditorial Department (hereafter, the Editorial Department) This time,tsukazan will explain the indicator and method called the “Discretion-FreeFXComplete Edition.”<Discretion-FreeFXComplete Edition>https://www.gogojungle.co.jp/tools/indicators/18855
Viewing this discretion-freeFXon a chart, many indicators are displayed, but first, please introduce each indicator.
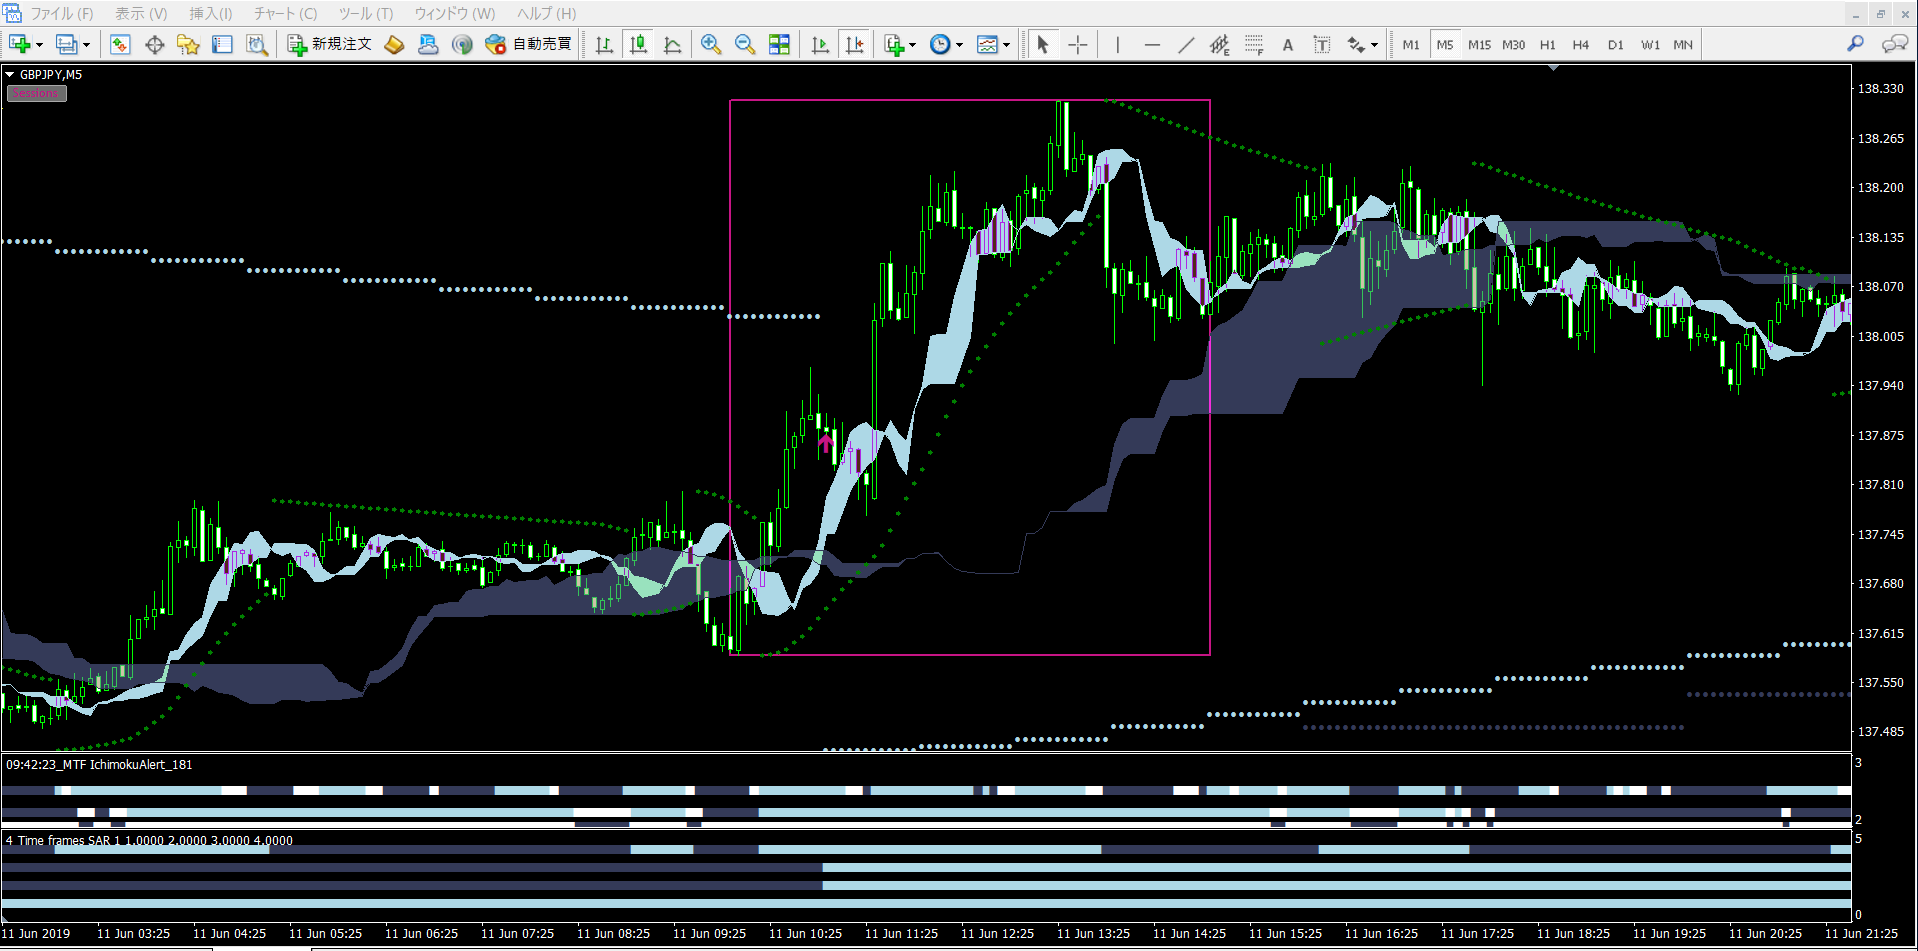
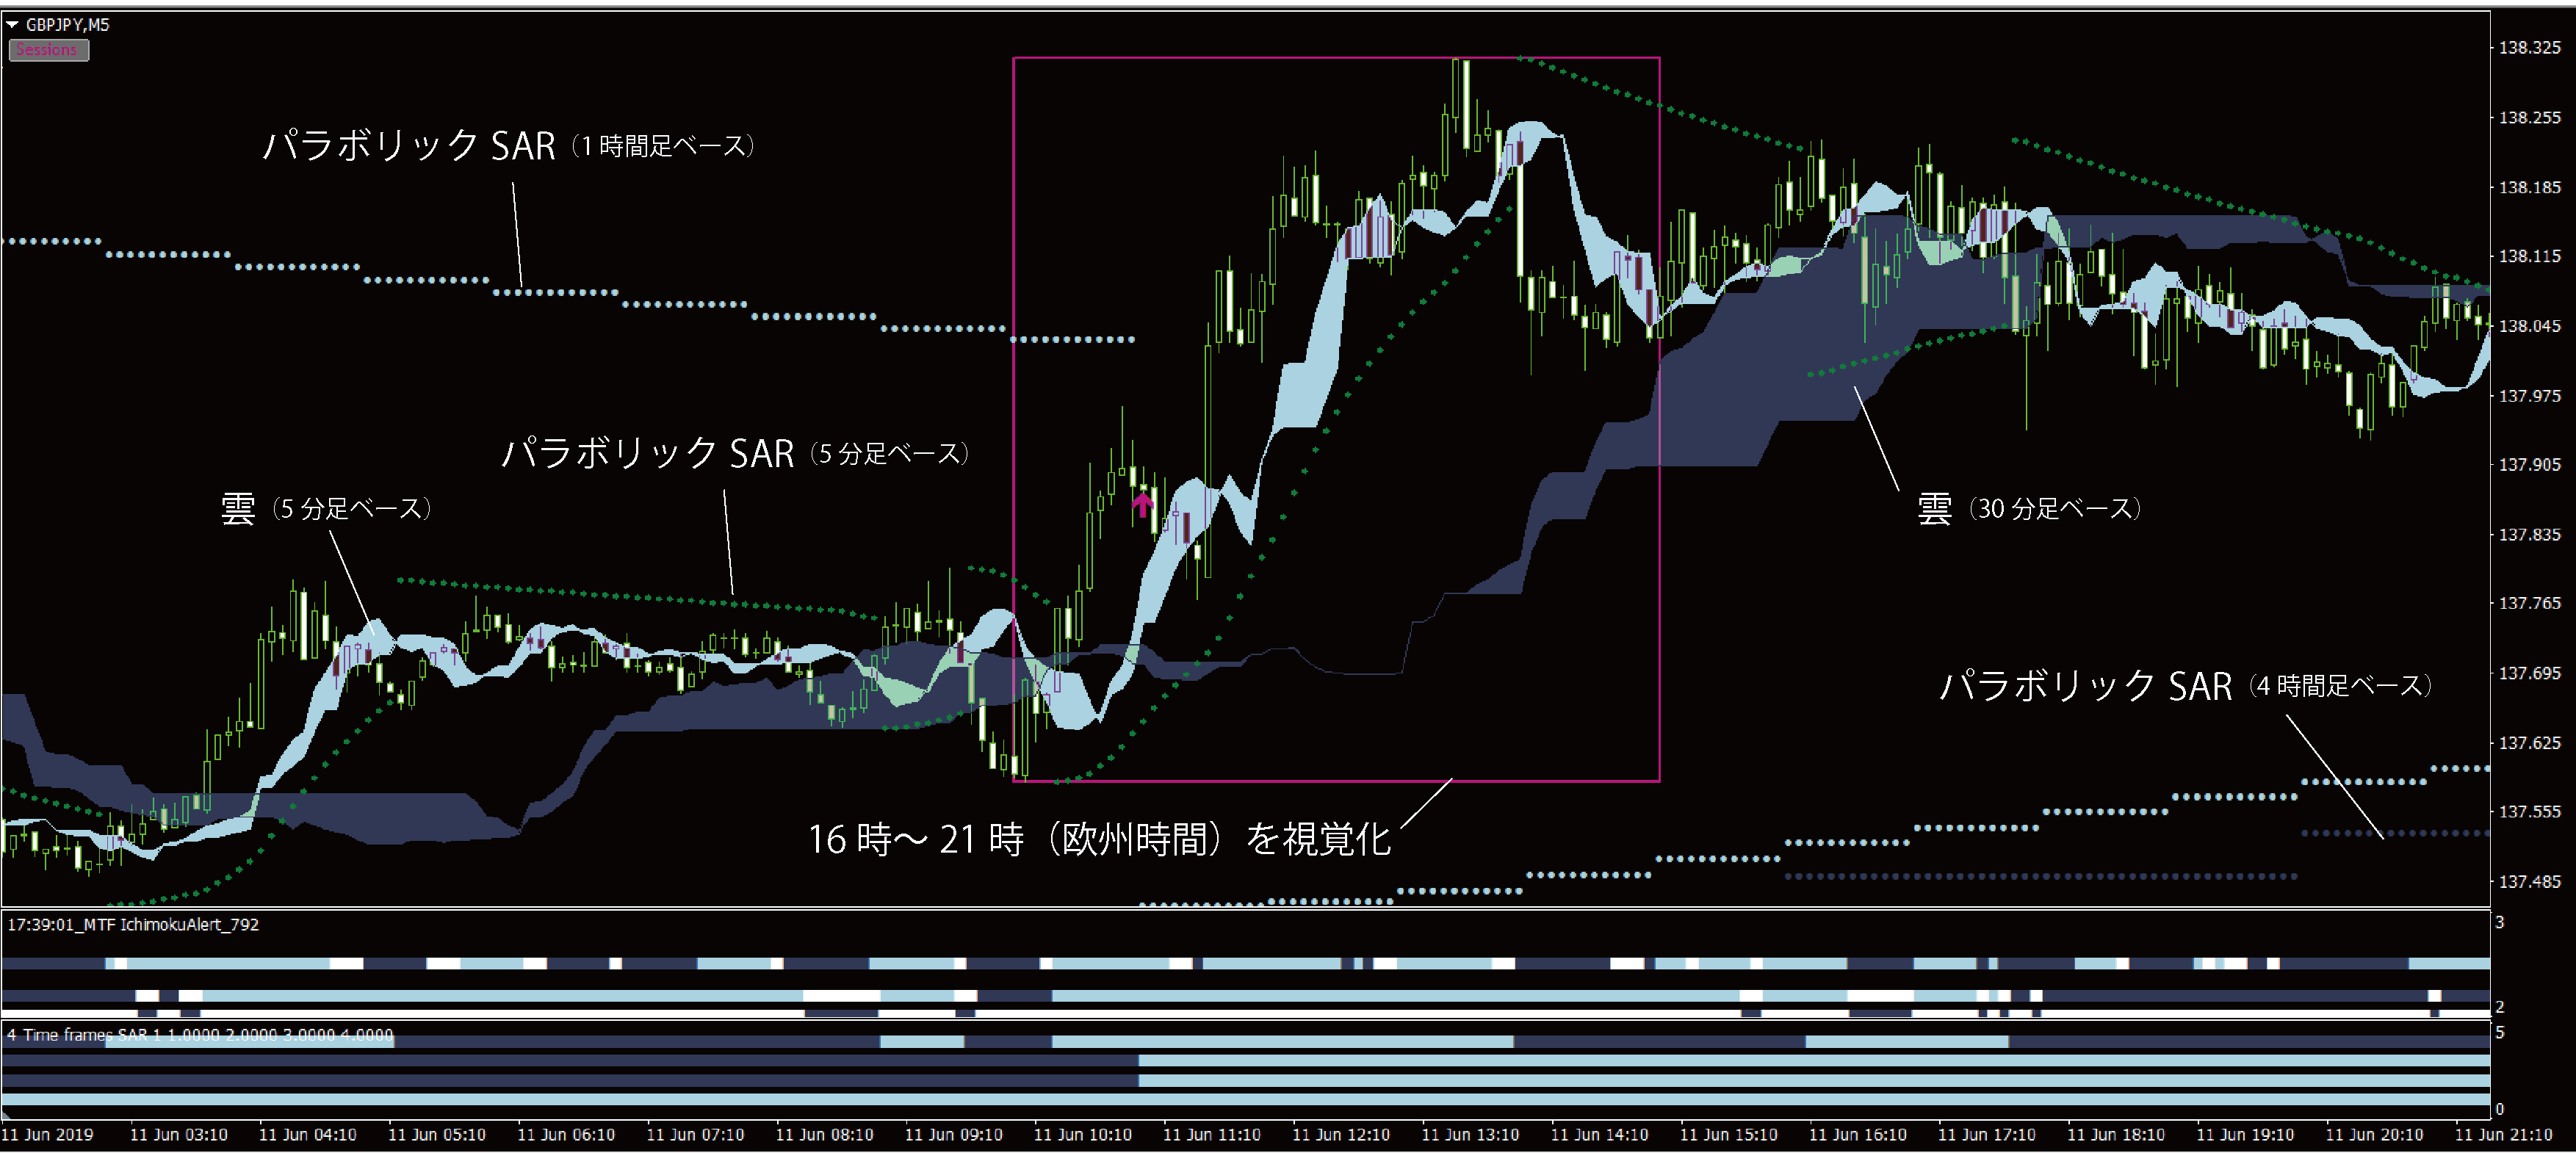
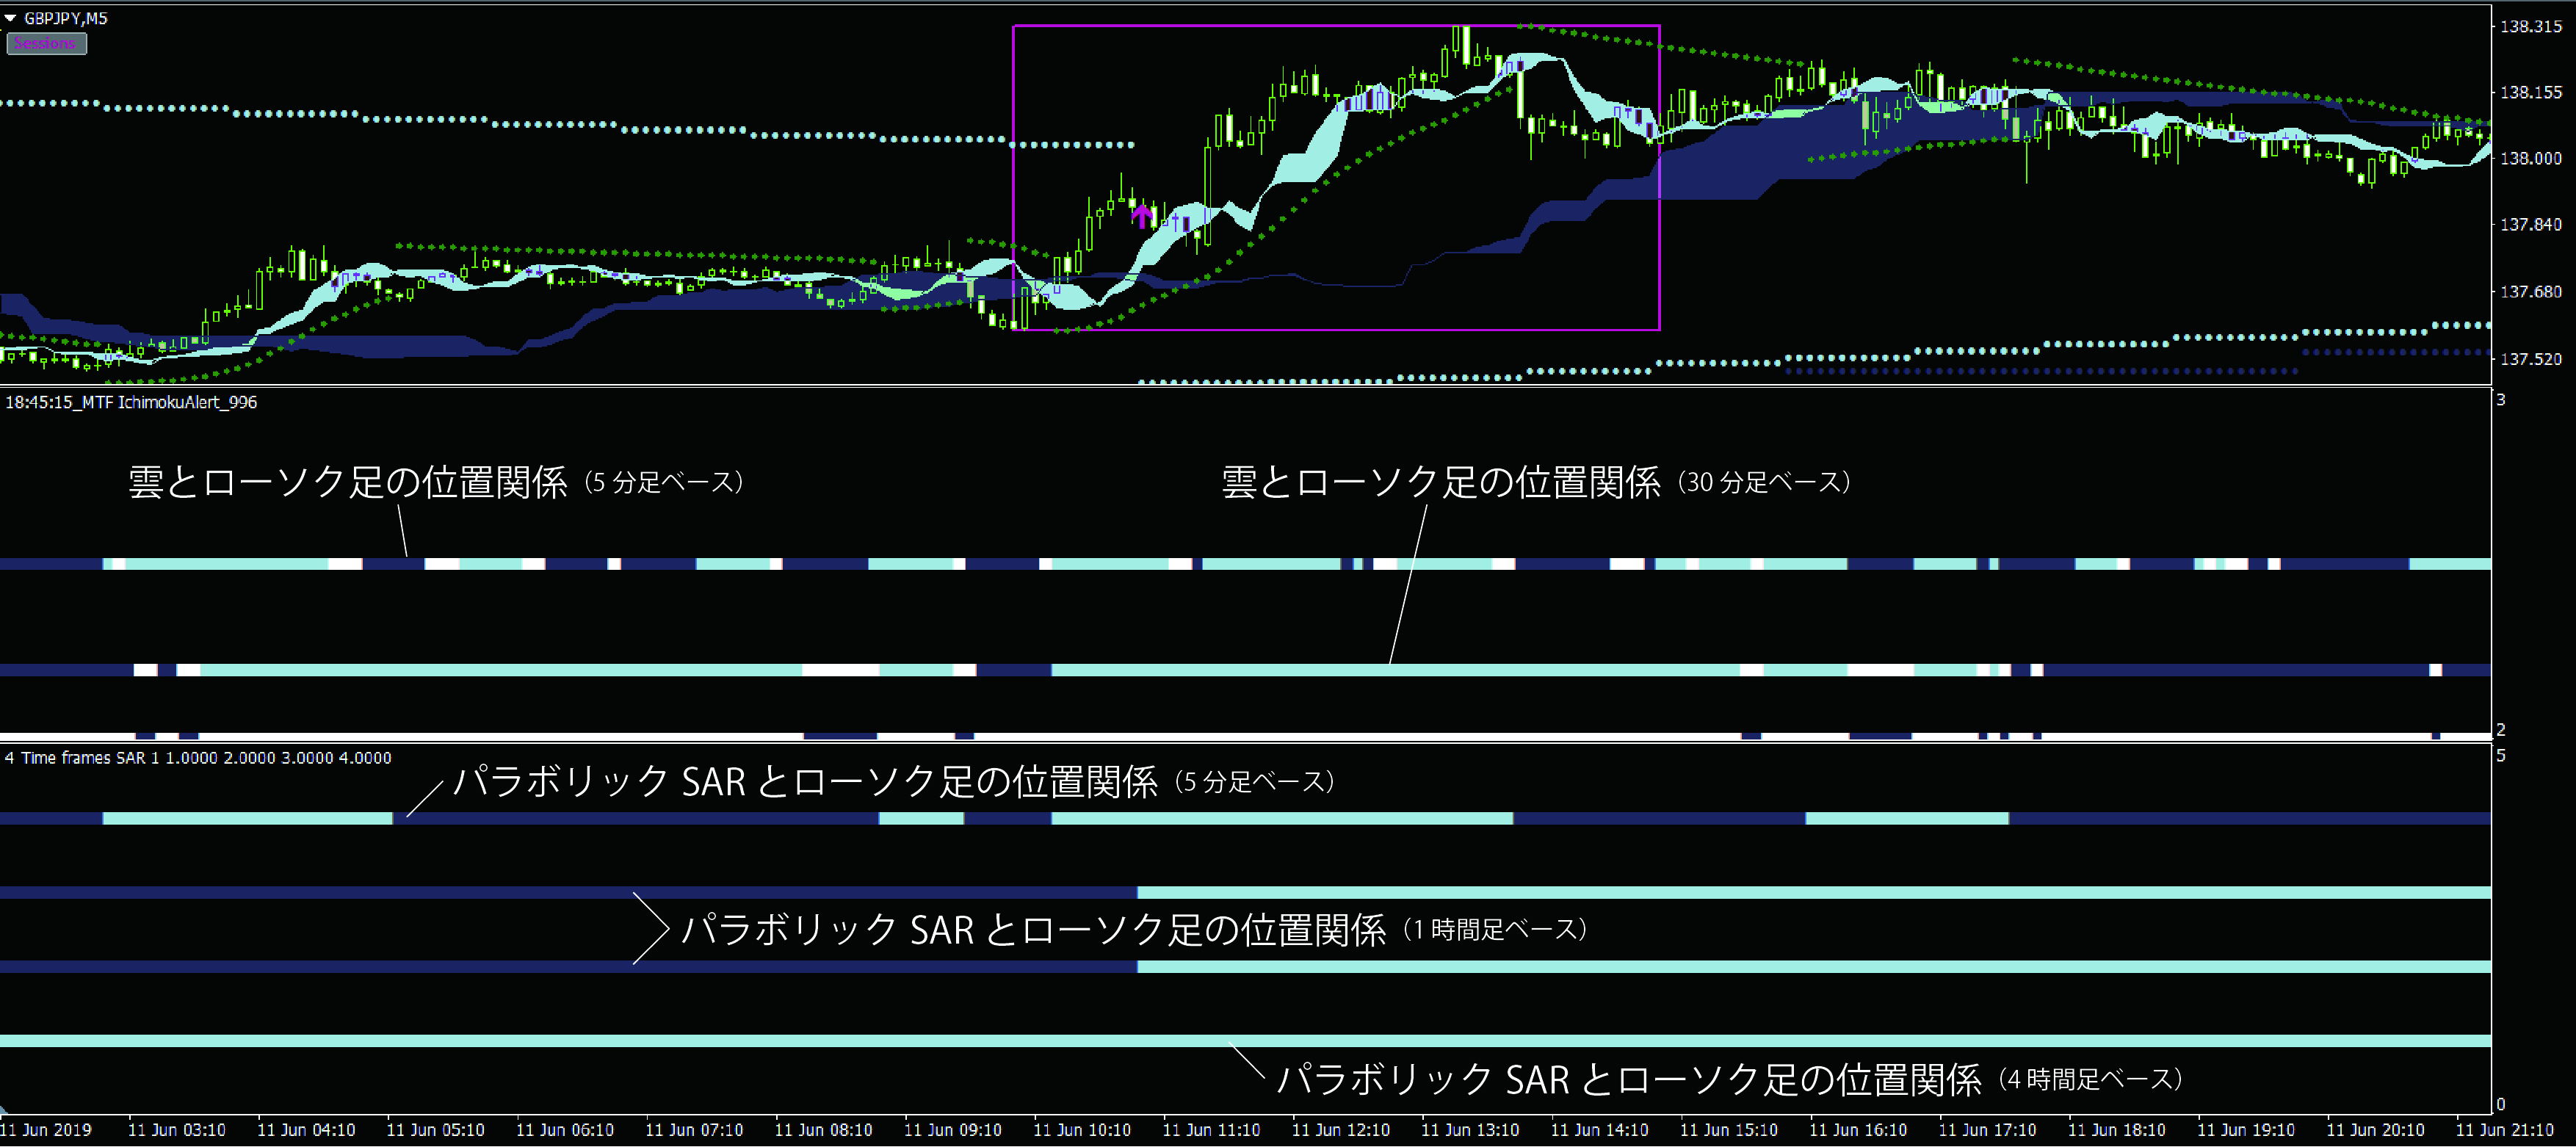
tsukazanThe chart displays a 5-minute timeframe. First, you can see a light blue band, which is the Ichimoku Kinko Hyo cloud shown alone. The parameters have been slightly adjusted from the standard Ichimoku. Additionally, you may notice a dark gray cloud, which is the 30-minute cloud displayed on the 5-minute chart in a multi-timeframe analysis manner.
編集部5分足の雲と、さらに30分足の雲、二つを描画するというのは、珍しいですね。
tsukazanNext, the green dotted line is ParabolicSAR, which also uses its own parameters. It also displays upper-timeframe data in multi-timeframe fashion, where the light blue dots are the1hour Parabolic, the dark gray dots are the4hour Parabolic, and it shows three types of time-axis Parabolic indicators.
編集部2types of clouds and,3types of Parabolic indicators are used for multi-timeframe analysis.
tsukazanExactly. Next, moving to the description of the sub-window. The top “MTF IchimokuAlert” color-codes the relationship between the cloud in the main window and the candles, making it easy to understand at a glance. The upper shows the5-minute timeframe, the lower shows the30-minute timeframe. If the candle is above the cloud, it is light blue; if the candle is inside the cloud, it is white; if the candle is below the cloud, it is dark gray. Lining them up vertically helps visually identify scenes where both the5minute and30minute timeframes have candles above the cloud.
編集部 I see—the colors alone make it obvious.
tsukazanThis is the same in the sub-window below with the “4 Time frame SAR.” In other words, if candles are above the Parabolic, it is light blue; if candles are below the Parabolic, it is dark gray. The top-most is a 5-minute chart, the second and third are 1-hour charts, and the fourth is a 4-hour chart. By the way, the 1-hour chart appears in the second and third positions, but there is no special meaning to having two; this is just a remnant from modifying a certain indicator. Returning to the point: when the colors in both sub-windows match for the two clouds and three Parabolic indicators, arrows appear in the chart area. This is where entries are made.
編集部 The entry signal is when the colors in the sub-windows match, then.
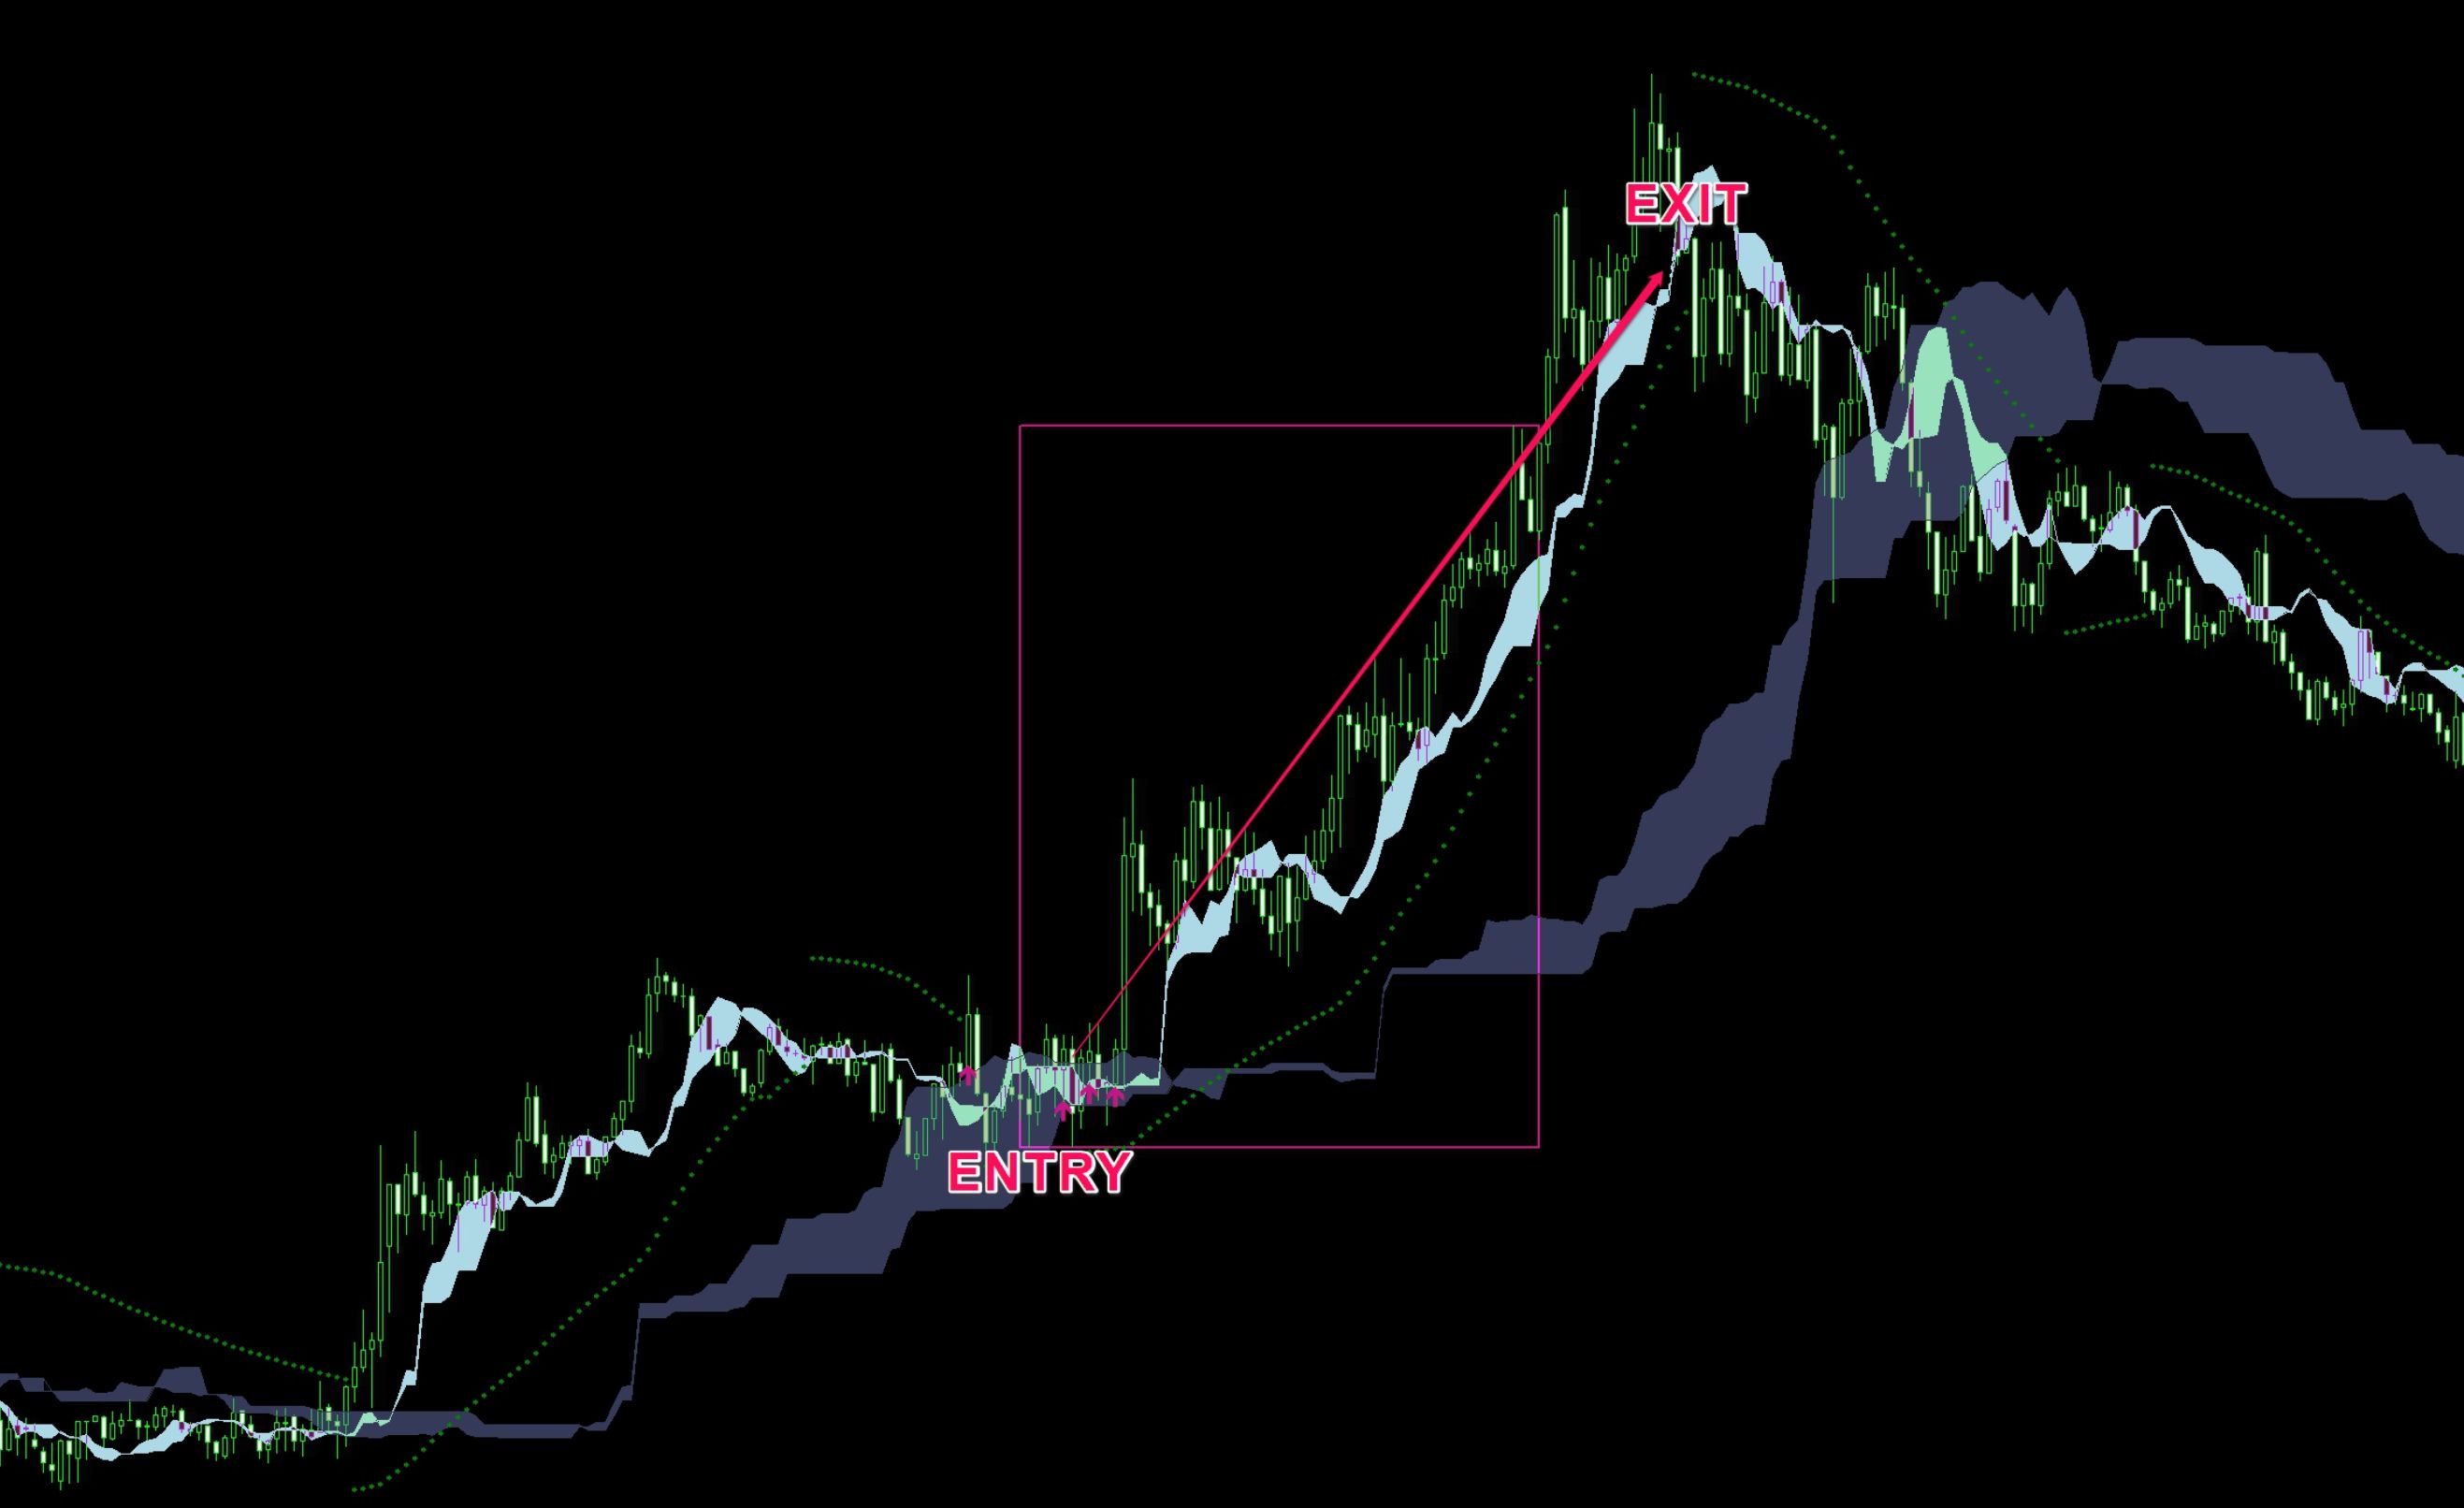
tsukazanThat's right. However, the arrows only appear at the first instance when the clouds are breached and the colors align. If not, it may repaint during minor retracements. Essentially, this is a trend-following entry method at the initial move of a trend.
Targeting only when European session for GBP/JPY!
Editorial Department: It is a trend-following method, yet aims to capture the initial move.
tsukazan One more point: the main window’s top-left “Sessions” button reveals a pink frame, indicating the time window from16:00 to21:00. I trade only within this pink range, i.e., during European hours.
編集部 So you intentionally narrow the entry times, correct?
tsukazanYes.FX
編集部 What currency pair do you target?
tsukazanGBP/JPY.
編集部 GBP/JPY only?
tsukazanYes.
編集部 If targeting GBP/JPY during European hours, how many trading opportunities are there per week?
tsukazan Per week: 0 to 2 times; per month: about 6 times.
編集部 So limited chances, but carefully chosen moments to trade. Then you mentioned entries are based on arrows; how about stop loss and take profit?
tsukazanStop loss is the cloud lower bound when long, or the cloud upper bound when short. Also, I set a maximum acceptable loss of 30 pips; if it would exceed this, I skip the entry. Additionally, depending on timing, there are cases where the rate sits between the 5-minute cloud and the 30-minute cloud, and an arrow appears to enter. In such cases, the 5-minute Parabolic becomes the stop-loss line.
編集部 What about take profit?
tsukazanI aim for a profit-to-loss ratio of 1 to 1. However, this is subjective and can be adjusted to taste. In my testing, GBP/JPY’s optimal is 1 to 5, but that yields long losing streaks 5 to 7 times per year. Because the profit is large but opportunities are few and losses can be frequent, I prefer 1 to 1 and steadily increase wins.
編集部 Indeed, even with high expected value, long losing streaks can hurt. And with few trade opportunities, it’s tough.
tsukazanThus, I leave risk-reward decisions to the trader. If you want to increase the count even when you’re losing, go for 1 to 1; if you want to grow steadily, also 1 to 1 is recommended.
Unlike typical signal tools, it requires no discretion
編集部 Earlier you mentioned trading only GBP/JPY. Are there other currency pairs you would recommend?
tsukazan Major pairs with high trading volume, including dollar majors, and cross-yen pairs.
編集部tsukazan concentrates on GBP/JPY, but some readers may wish to check many pairs and trade when opportunities arise.
tsukazanThat approach works for some, but I don’t recommend it. It’s important to learn the habits of one currency pair. Moreover, I suggest fixing the trading window as well. Limiting helps you memorize the habits of that pair and time window.
編集部 By the way, what is the European-hour habit for GBP/JPY?
tsukazanA tendency for trends to form more easily by European speculative traders.
編集部 So you follow the flow created by professionals. Who would you recommend this method for?
tsukazan People who have tried many methods but couldn't win, or those who end up losing when they break out of ranges. This discretionary-freeFX
編集部tsukazan maintains a focus on the 16:00–21:00 window, but for example, could a salaried person limit trades to 20:00–2:00 New York time?
tsukazan Yes, that’s possible. I’d advise aligning with the person’s lifestyle, preferred pairs, and times.
編集部 Then, what part of discretion-freeFXis more advantageous than other indicators?
tsukazan It is harder for signals to appear in ranges. Essentially, signals occur at the initial trend move. Many standard signal tools generate many signals requiring discretionary selection. But discretion-freeFXis not like that—no discretionary element, which yields high reproducibility. Anyone can achieve similar trading results because it is designed to be the same for anyone.
Note: arrows can repaint. Repainting is generally undesirable, but in discretion-freeFXthe Parabolic hour (1-hour) and 4-hour switches can cause repainting for that time, though the edge of the signals is not compromised, so please use with that understanding.
Live life without being bound by the market, while steadily earning!
編集部 Discretion-free, simple, yet not many trading opportunities, how do you live with this, tsukazan?
tsukazanIn the morning at around 4:00–5:00, I wake up, spend about an hour looking at business news and replying to work emails. Then I exercise for about 30 minutes, eat breakfast with my wife, and start the day.
編集部 So you avoid the market in the morning?
tsukazanYes. I do not watch charts, news, or economic indicators in the morning.
編集部 That’s quite unusual.
tsukazan In the afternoon, I start my business tasks, and around 16:00, I launch MT4 and enter when a signal rings. If no signal, I continue with work. I record my trades for a trading journal. I continue like that and sleep after 21:00.
編集部 You truly live unconstrained by the market. It’s a lifestyle made possible by discretion-freeFX. Finally, to those who are interested in discretion-freeFX, a message for them.
tsukazanAmong the many methods and indicators in the world, thank you for taking an interest in this discretion-freeFX. I am confident it can become a lifelong method, so please try it. Also, it comes with a 100-day money-back guarantee, so if it doesn’t work for you, just tell me. I will personally ensure a refund. I hope it helps your trading.