

How does the backtest result of EA differ depending on conditions? Four numbers you should compare
When checking EA backtest results, the first things people worry about are net profit and win rate, right?
I used to focus on these kinds of figures as well.
However, through repeated verifications of EAs, I began to feel that a single backtest result can be hard to judge by itself.
For example, suppose changing the settings results in higher profit.
Looking at only that, it may seem like an improvement, but simultaneously the proportion of losses may have increased, or the maximum drawdown (DD) may have become larger.
This time, when confirming differences in performance due to EA condition changes, I will整理 (organize) four numbers I want to compare and how to read them.
1. Four numbers to check when comparing
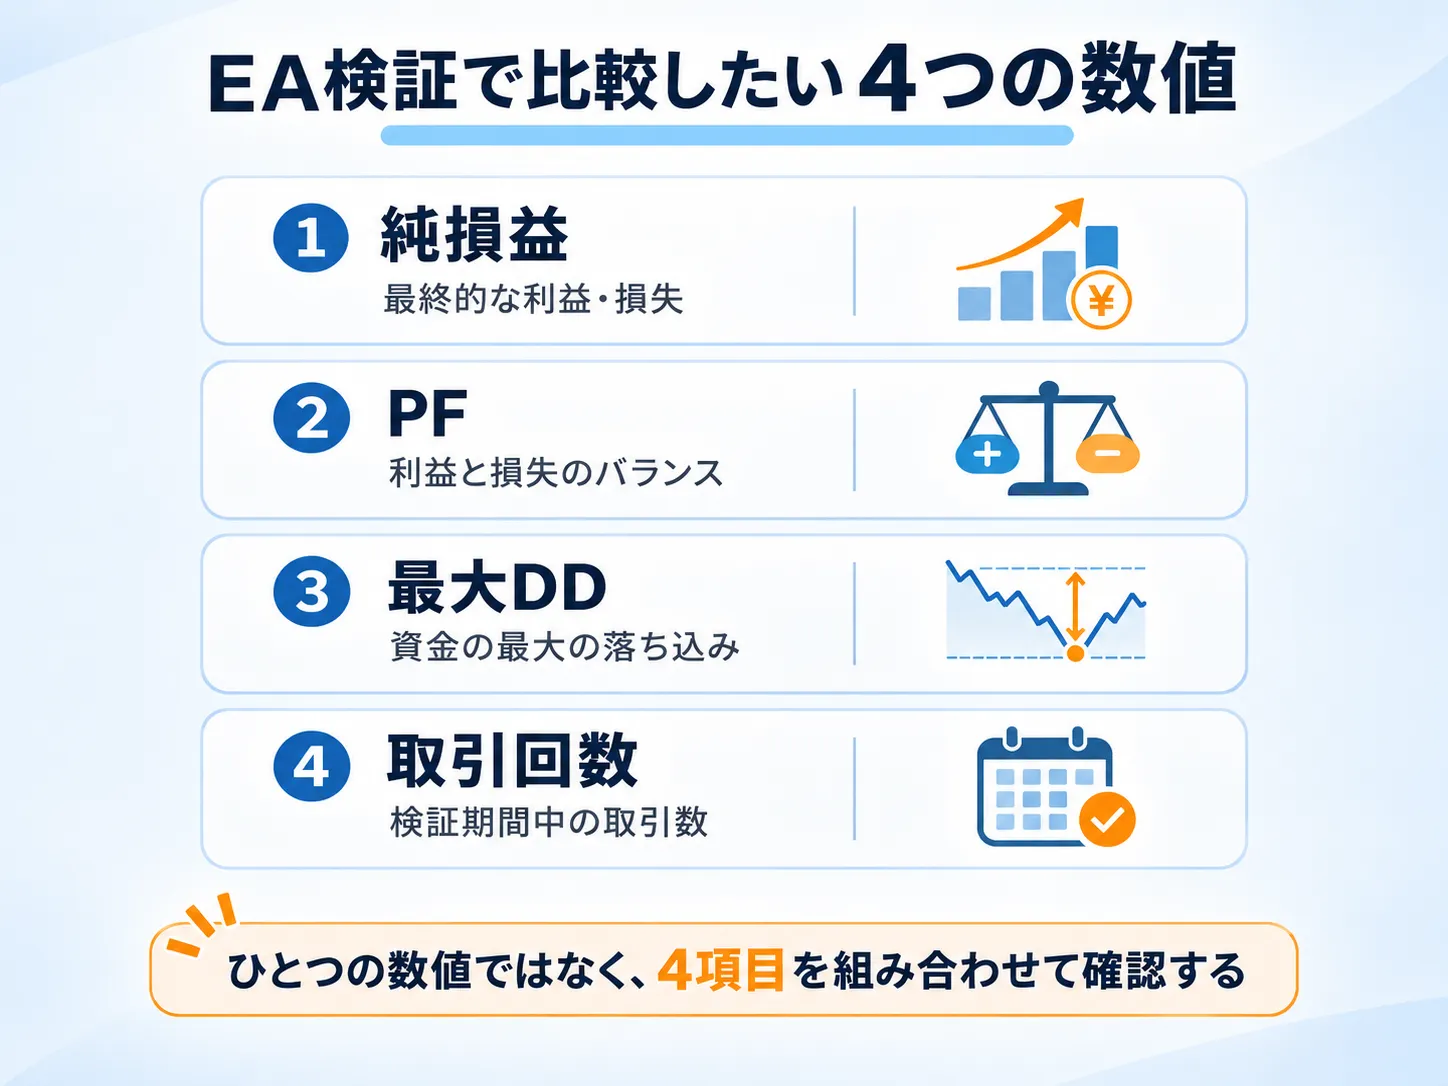
The four items to be discussed are below.
・Net profit (net income)
How much profit or loss ended up at the end
・PF (Profit Factor)
Balance between total profit and total loss
・最大DD (Maximum Drawdown)
How much the funds fell from the peak
・Number of trades
How many trades were made during the validation period
All of these are basic metrics that can be checked in a backtest.
However, when making comparisons before and after changing conditions, it is important not to view each figure individually but to check them in combination.
![]()
All of these are basic metrics that can be checked in a backtest.
However, when making comparisons before and after changing conditions, it is important not to view each figure individually but to check them in combination.
2. Net profit | also check the reasons why profit increased
Net profit represents the final profit or loss from the backtest.
If net profit increases due to a condition change, that in itself is a favorable change.
However, if the number of trades has increased drastically, the profit increase may be simply because more trading opportunities occurred.
Also, profit may have increased while the maximum DD has also grown.
After confirming the net profit’s increase or decrease, it is important to consider what caused that change.
3. PF | Profit increases do not always mean the balance has improved
PF (Profit Factor) is the value of total profit divided by the absolute value of total loss.
For example, even if net profit increases due to a setting change, PF may decrease.
This means the ratio of total losses to total profits has become larger than before the change.
In other words, just because final profit has increased does not mean the balance of profits and losses has improved.
Checking net profit and PF together allows evaluating profit increases from another angle.
4. 最大DD | How much risk was taken relative to the profit
最大DD (Maximum Drawdown) is a metric that shows how much funds fell from the peak.
Even if profits increased due to a setting change, if the maximum DD increased by a larger proportion, the balance of profit and risk may have worsened.
For example, if profits increased by 30% but maximum DD increased by 70%, it becomes hard to say it merely improved.
When comparing, you should align not only the amount of the maximum DD but also the definitions of the figures, such as whether it is on a balance or available equity basis.
In addition to how much profit increased, also check how much capital dropped along the way.
5. Number of trades | Check the background for performance changes
The number of trades provides clues for interpreting changes in net profit and PF.
For example, even if net profit increases due to a setting change, if trade count increases dramatically, it does not necessarily mean profitability per trade has improved.
Also, when the number of trades is small, the impact of a few trades on overall performance becomes large.
More trades do not automatically mean better; fewer trades do not automatically mean worse.
Use it as a factor to understand the background of changes in other indicators.
6. What you can understand by combining the four numbers
From here, let’s think through with a concrete comparison example.
Take the same EA, test the same period, asset, and initial capital, and only change the EA settings.
The results are as follows.
Comparison between normal conditions and after setting change
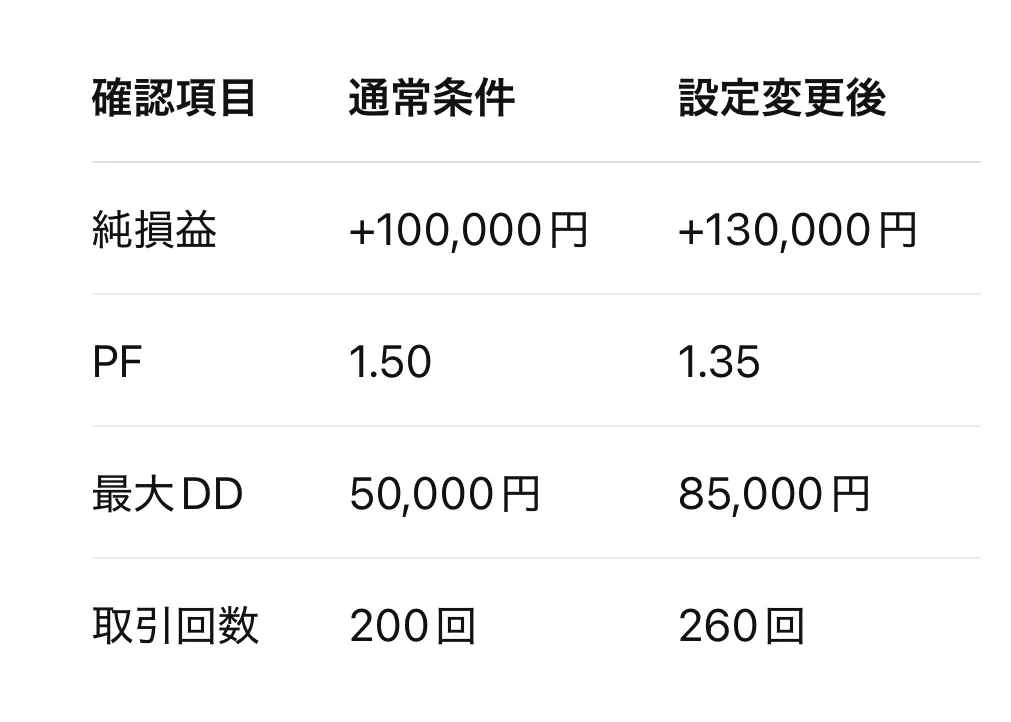
Note: The numbers are fictional for explanation. They are not actual EA verification results.
If you look only at net profit, the post-change setup may look better.
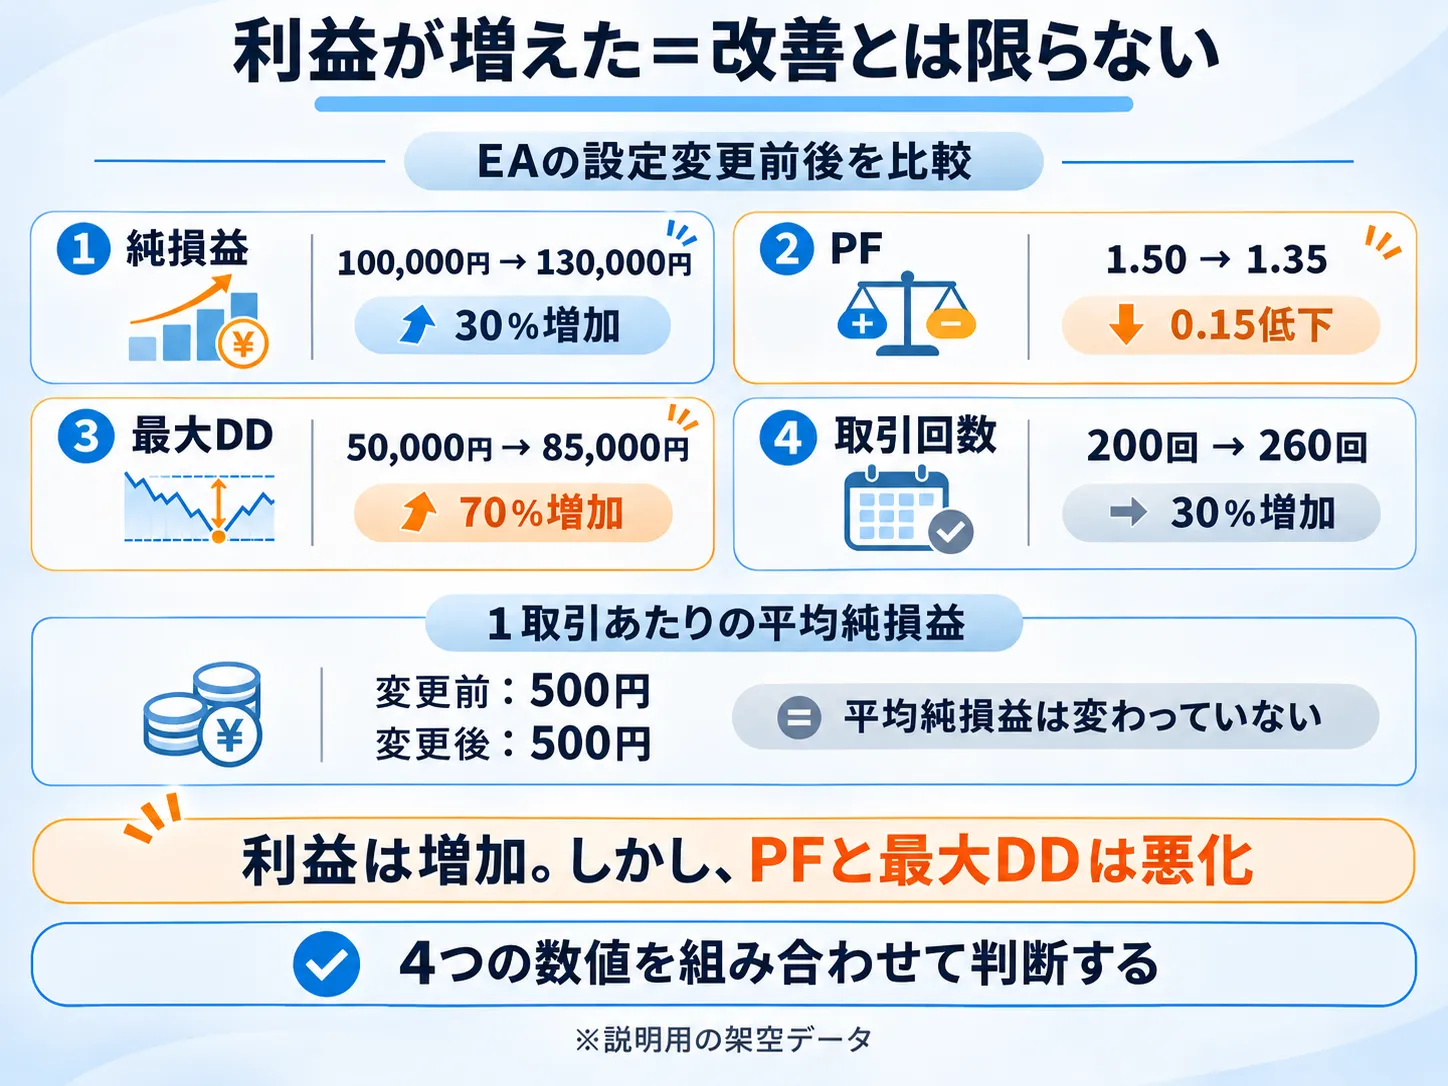
In reality, profit increased from 100,000 to 130,000 yen, a 30% increase.
However, when checking other figures, the assessment changes.
PF: 1.50 → 1.35
Profit increased, but the balance between profit and loss deteriorated.
Maximum DD: 50,000 yen → 85,000 yen
Maximum DD increased by 70%.
It far outpaced the 30% increase in profit, indicating greater capital drop to achieve higher profit.
Number of trades: 200 → 260
Trade count increased by 30%.
The increase in net profit is also 30%, so if you simply calculate net profit per trade, both are 500 yen.
- Normal condition: 100,000 yen ÷ 200 trades = 500 yen
- After change: 130,000 yen ÷ 260 trades = 500 yen
So in this example,the number of trades has increased, but the average net profit per trade has not improved.
Of course, this figure alone does not reveal all aspects of the trades.
Nevertheless, by combining the four items, you can see differences that were not visible from net profit alone.
Based on these results, I would not immediately adopt the post-change settings; considering the deterioration of PF and maximum DD, I would like to verify further.
7. What kinds of condition changes can be compared
So far I used EA setting changes as examples, but the items to compare are not limited to that.
EA setting changes
For example, changing TP (take profit) or SL (stop loss) widths.
Even if net profit increases, by checking how PF and maximum DD are affected, you can organize the characteristics before and after the change.
Differences in trading costs
If conditions such as spreads or fees differ, there is still a reason to compare.
In particular, even if backtest results look good, it is important to check how much profits decrease when trading costs increase.
To examine cost tolerance, align other conditions as much as possible and compare results with the cost conditions changed.
However, cost conditions that can be changed in MT4/MT5 differ depending on the testing environment and data used.
Validation period and time frame differences
Even with the same EA, performance can vary depending on the validation period and the time frame.
In such comparisons, the goal is not to simply determine which is better, but to organize what results appeared under which conditions.
When comparing results with different conditions, it is important to clearly state what was changed.
8. It is also important to keep a record of the comparison results
In EA verification, you may repeat setting changes and re-tests.
At that time, if you only keep the numerical results, you may not understand why a certain setting was adopted later on.
What I want to keep is three points:
- What was changed
- How the four numbers changed
- How I judged the results
For example, if net profit increases but maximum DD increases greatly, note as “needs re-evaluation.”
Having such records helps when reflecting on past verifications.
9. I created an EA Verification Comparison Workbook
What I introduced above, a tool to organize comparisons before and after condition changes in Excel, is the “EA Verification Comparison Workbook.”
This workbook is designed to input backtest numbers and compare results under normal conditions and after changes.
What the workbook can do
- Record the verification conditions for normal and changed states
- Compare net profit, PF, maximum DD, number of trades, etc.
- Check changes in net profit and PF with two graphs
- Record adoption candidates, needs re-evaluation, or pass decisions based on the comparison results
For example, as in the comparison table here, net profit may have increased while PF and maximum DD worsened.
Also, you can compare not only EA setting changes but also results obtained from separate backtests with different cost conditions.
Note that this workbook itself does not execute backtests or alter trading conditions such as spreads.
It is an Excel tool to input verification results and compare and record differences.
Files included in the product
① EA Verification Comparison Workbook (Excel format .xlsx)
A file to record verification conditions, input numbers, automatically compare, graph results, and make final judgments.
② EA Verification Comparison Workbook Guide (PDF, 5 pages)
A manual summarizing how to use each sheet and how to input data.
Your environment
This product is an Excel workbook.
It is intended to be used with Microsoft Excel on desktop or Excel for the web in a browser.
Excel for the web is free to use but requires a Microsoft account.
For readability and ease of use, using a PC is recommended.
When comparing backtest results, it is not only whether profits increased, but also what changes occurred in other figures.
This workbook is aimed at those who want to organize those differences and use them for the next verification and setting decisions.