

[November 17, 2026 Issue] This Week's Featured Articles Summary
This Week’s Curated Articles
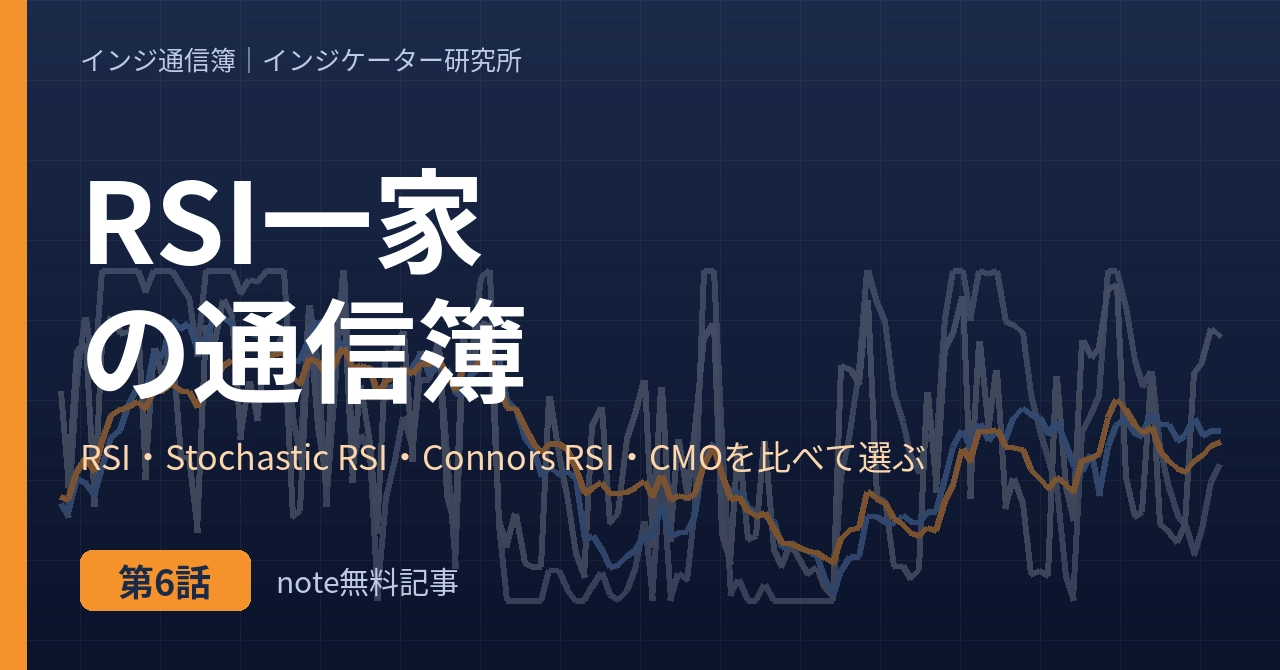
[Indicator Report Card, Ep. 6] The RSI Family Report Card — Choosing Among RSI, Stochastic RSI, Connors RSI, and CMO
Four look-alike, easily confused RSI-type indicators are graded like a report card across four items: responsiveness, low false signals, readability, and suitability for beginners. With the sensitivity–whipsaw trade-off in mind, it also summarizes purpose-based choices like “the first one to start with” and “spotting short-term overshoots.”
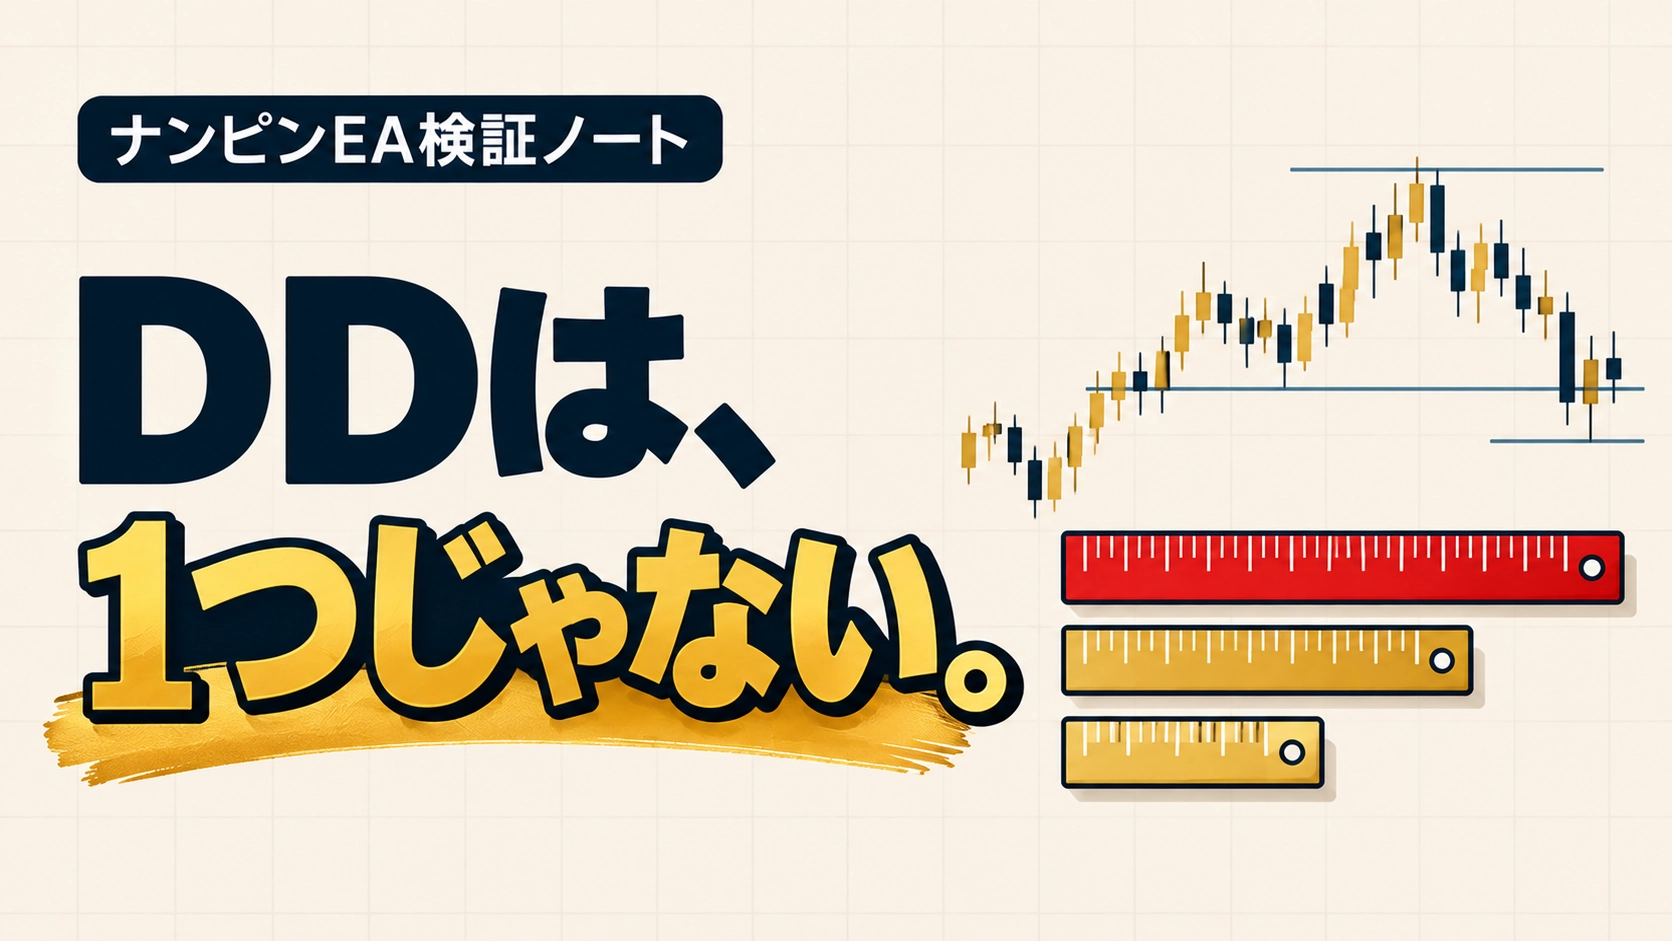
Can you trust “Max DD 10%”? — Why the same backtest can produce many different DD values
Even with the same backtest: 10% on a balance basis, but 47% on a margin (including unrealized loss) basis. Using actual reports, we show why they diverge greatly for grid/martingale EAs, and include a checklist to verify on sales pages.

[Beginner’s Guide] Definition and detection of repainting — The phenomenon where closed-bar displays get rewritten
Why do arrows that once appeared later disappear or move, and why does repainting make backtests look better than live trading? This intro organizes perspectives for choosing indicators, including detection methods you can try without reading code.

[Gold] I thought grid depths increase on volatile days — turns out they didn’t. A 25-day line-up
From five EAs running on gold 1-minute charts, we extracted five volatile days each (25 total) and lined up the depth of averaging down. We track how the intuition “the bigger the range, the deeper it gets” failed.
Issue 31 | Shiroyagi’s EA Operation Diary | No closes across all 5 products; Kuroyagi opened 1 new trade; FX3EA unrealized total −56,921 yen (Mon 11/16)
A daily operation log openly sharing the forward status of a self-made, swap-focused EA set, including unrealized P/L and annualized returns. Real account self-measured values are listed side by side, recording both good and bad days.

[Nov 15, 2026] Heaven-and-Earth Indicator MT5 Edition — Full renewal announcement
The all-in-one indicator “Heaven and Earth,” with over 3,400 total copies, has been fully revamped for MT5 with features equivalent to the latest MT4 edition. We introduce a design that supports direction, entry, and exit decisions with multiple converging reasons.
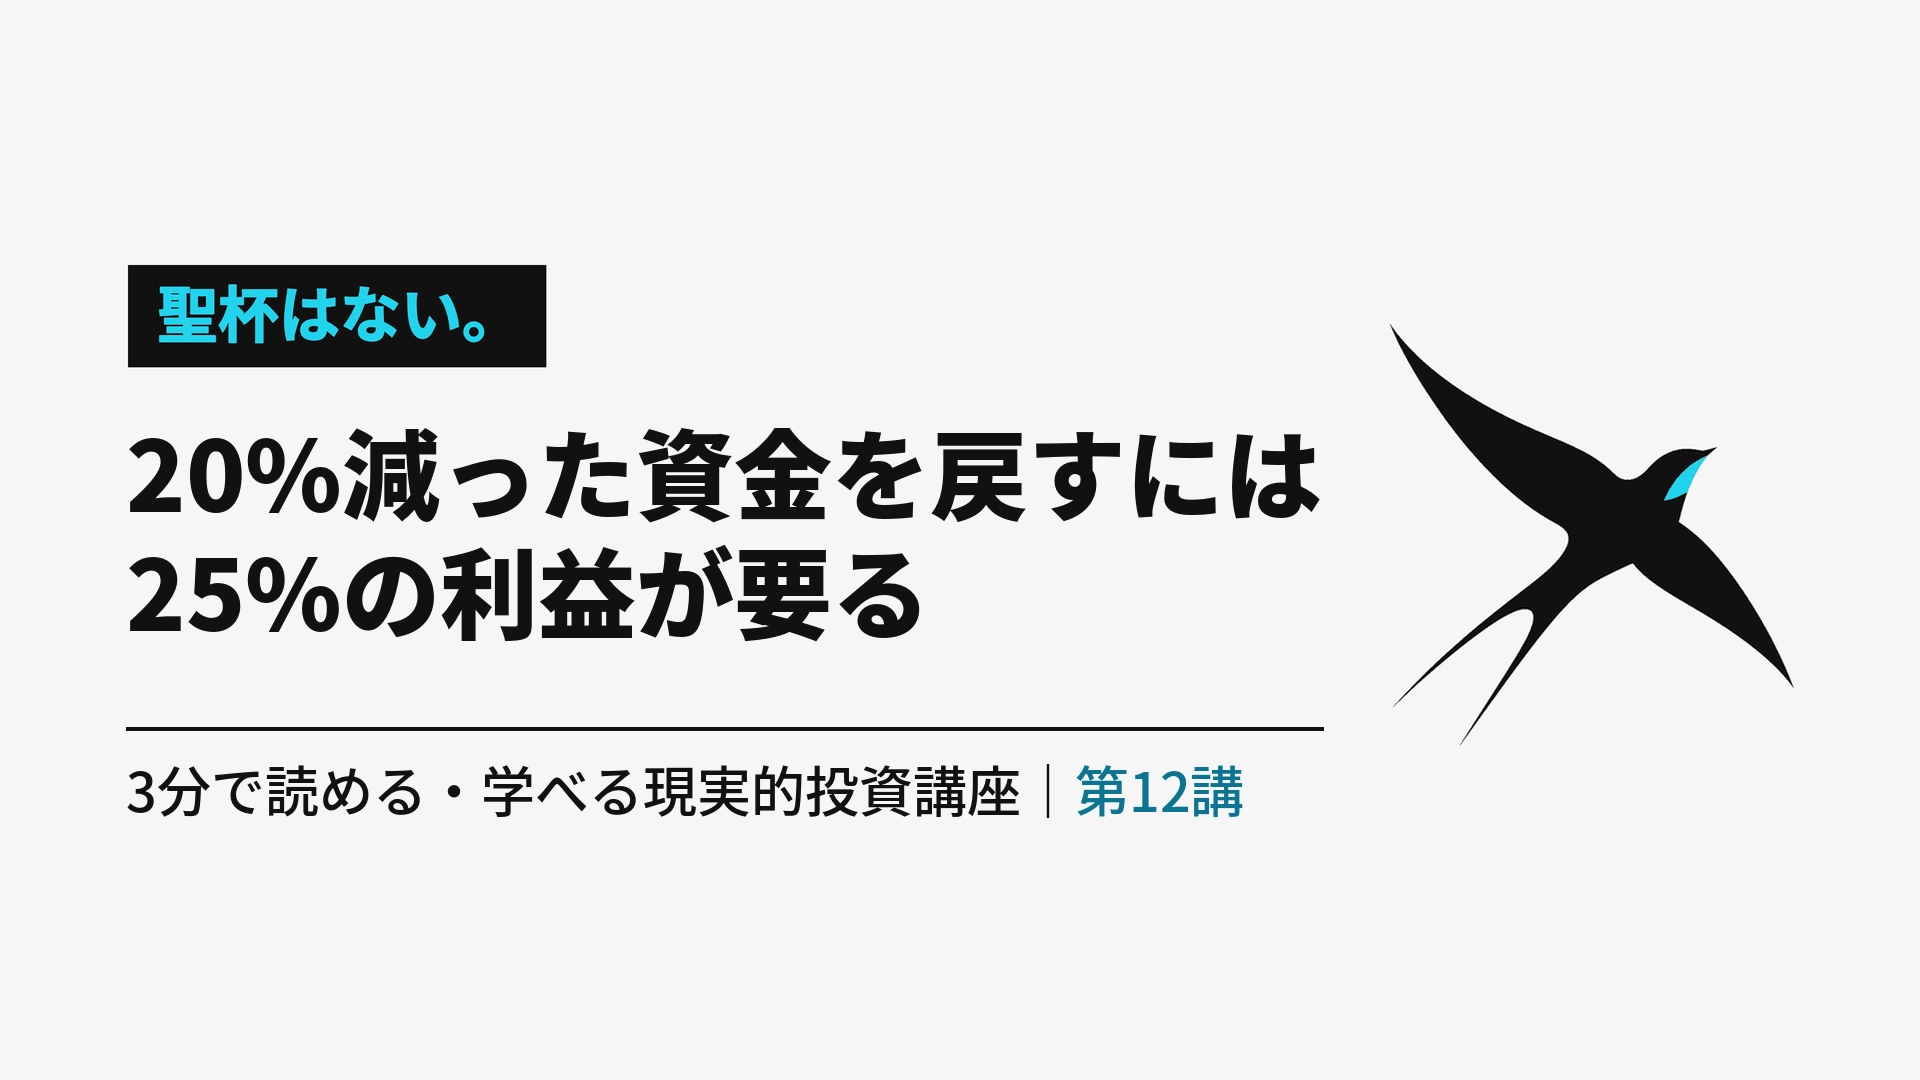
[A realistic 3-minute read-to-learn investment course | Lesson 12: To recover capital after a 20% loss, you need a 25% gain]
If your capital drops by 50%, you need to double it to get back. A table shows the gap between the loss percentage and the gain required for recovery, stressing the importance of per-trade risk settings to avoid “falling into a deep hole,” rather than how to climb out.
Survivors decide in advance which days they won’t trade
When conditions don’t align, when a loss rattles your emotions, or before key data when price action is unreadable. By defining skip scenarios in advance, you can focus on the days you do trade. A short, to-the-point column.

For those who can’t stop overtrading GOLD | Three frameworks to cut entries
Over-entry isn’t about lack of patience; it’s about not defining “when and what not to enter.” We organize three reasons entries increase and present ways to limit trades using three frames: time, count, and pattern.

UTokyo Med School (Sci-III) AI judged the Monday USDJPY as “wait”
On a Monday morning when the weak 1-hour trend and the 15-minute pullback conflicted, the in-development decision AI chose neither buy nor sell, but “wait.” From a one-off test log, we consider how to view markets with range yet no aligned direction.

[BB New Series, Part 2] Before thinking buy or sell — First judge the “3 market states” with BB
Before making trade decisions with BB, first judge whether it’s squeeze, expansion, or nearly flat. Rather than which line price touched, we explain the order of reading changes in the shape of the entire band.
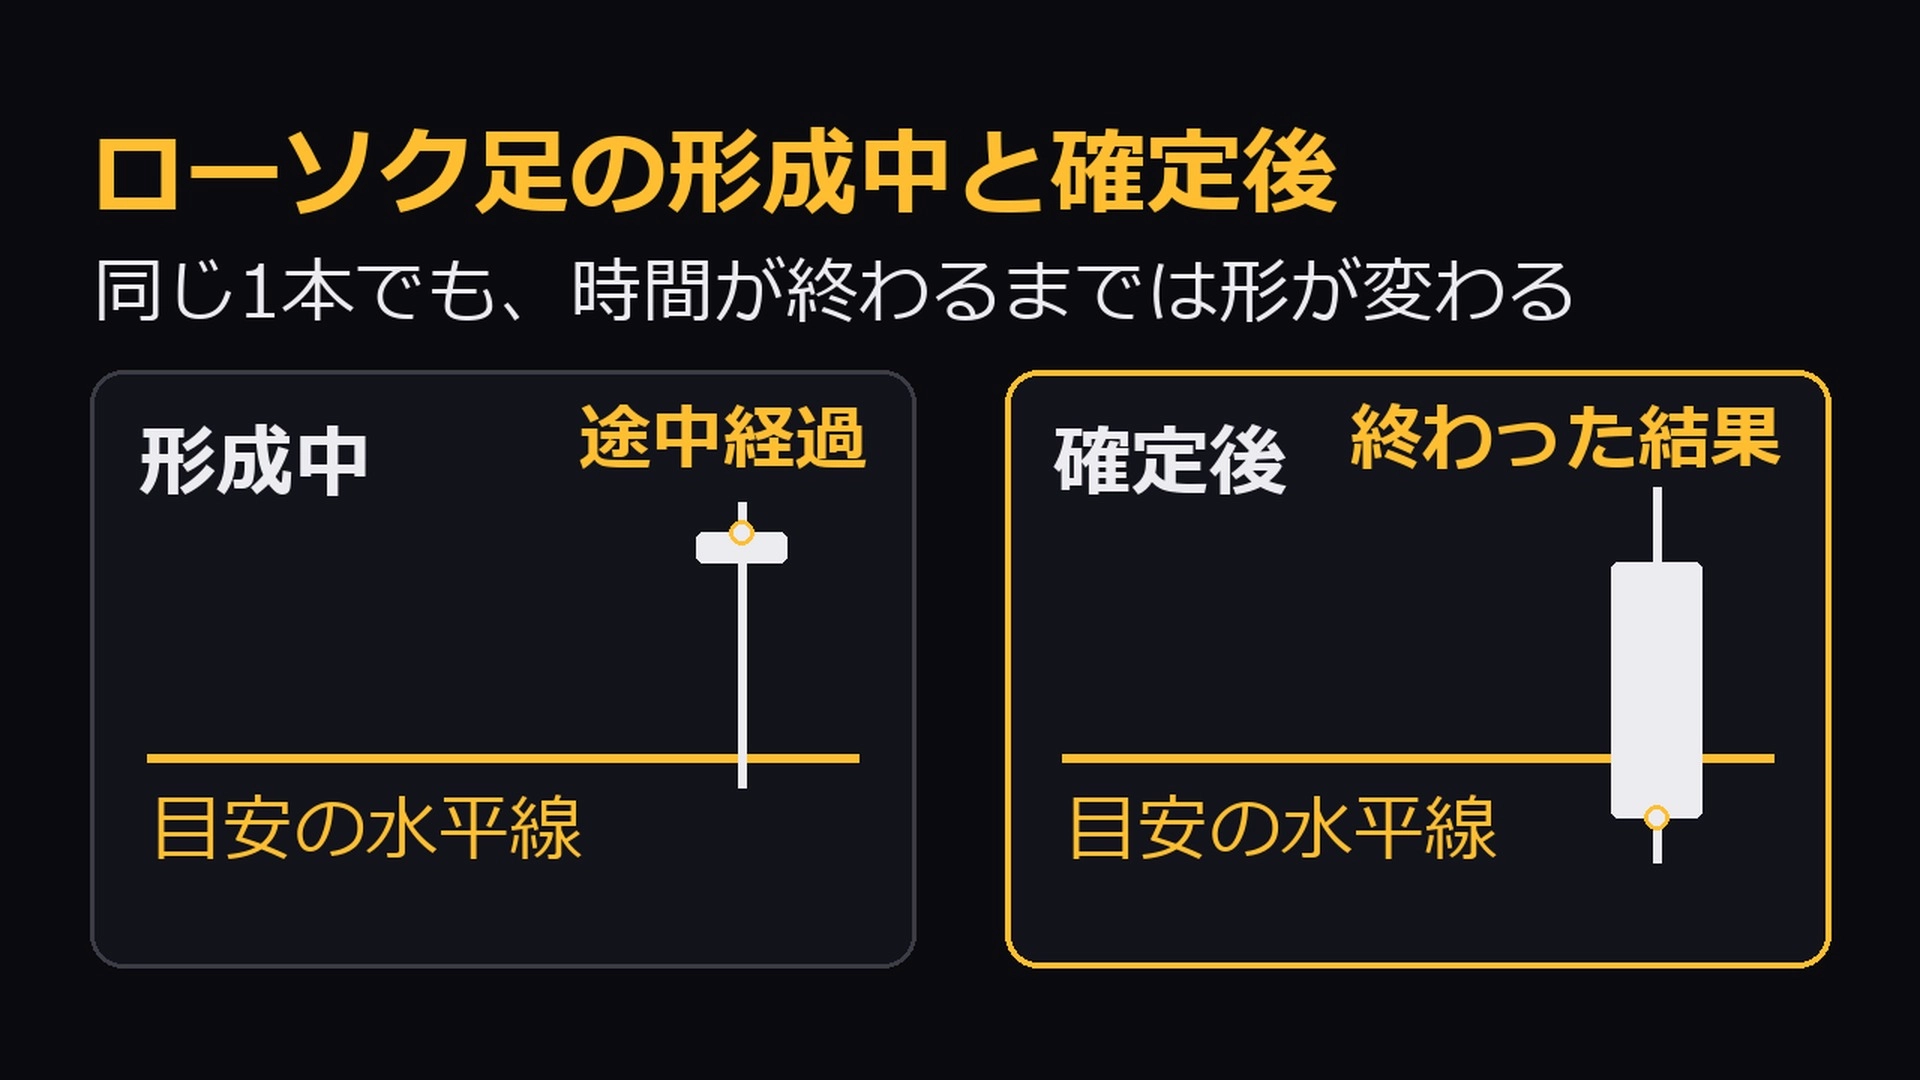
What’s different during formation vs. after close of a candlestick?
Using gold’s 4-hour chart as an example, we illustrate that “touched the line” and “closed above the line” are not the same. We neatly organize how OHLC evolves until confirmation, and what to re-check after the next bar begins.
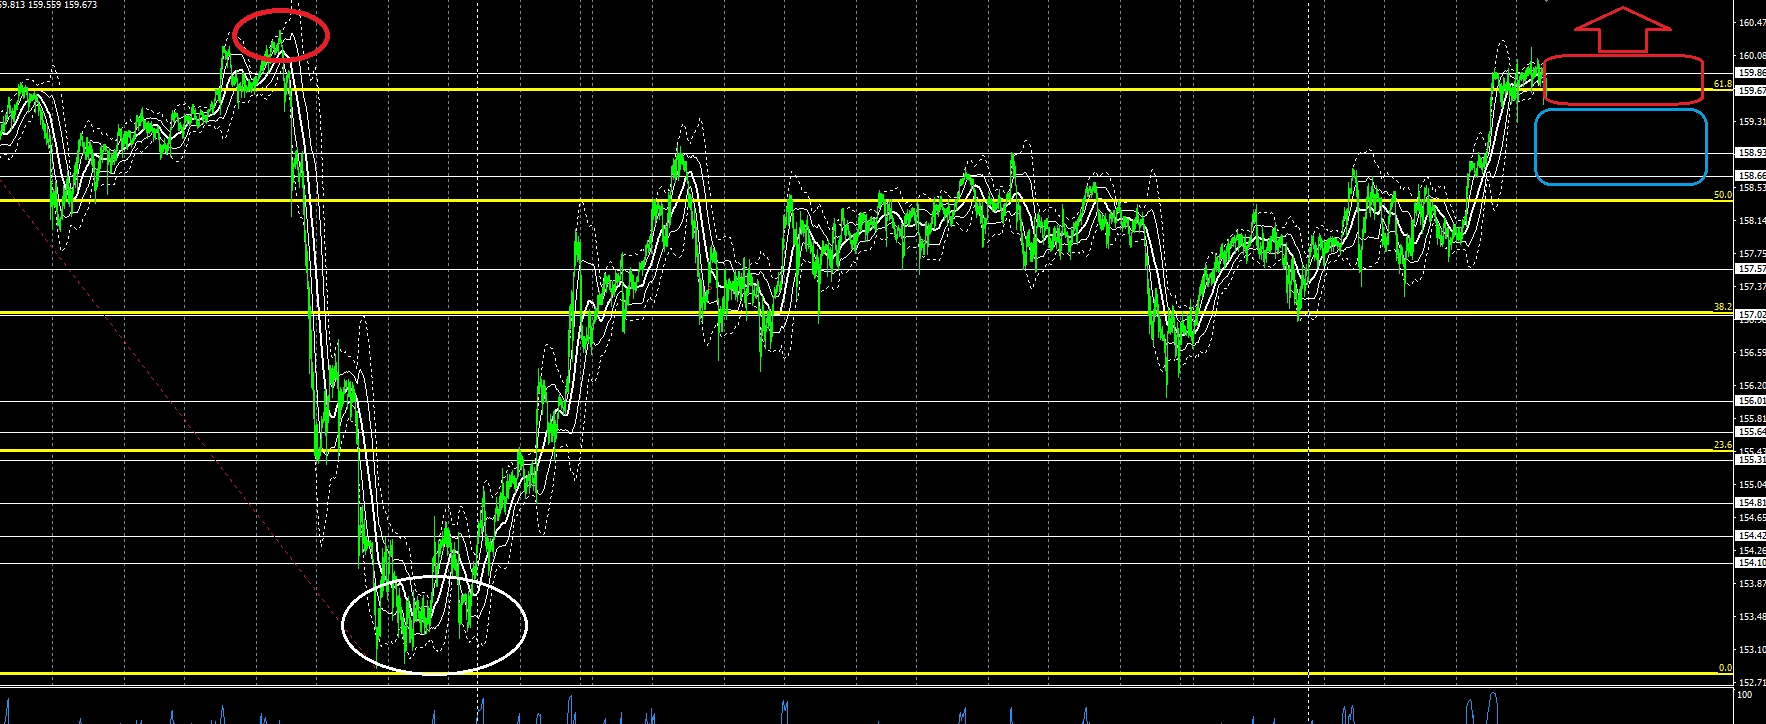
For USDJPY, check this first
USDJPY broke above the long-standing 157–159 range. With about 50 sen of post-break range, we discuss which way it might break next and the outlook ahead of the BOJ meeting in a month, along with key points on the 1-hour chart.
[Goldman Sachs vs. Nomura Securities] Different mechanisms that move markets
A pure investment bank that tilts currency strength via proprietary capital and order flow, versus a securities firm expanding overseas atop a domestic retail network. From differences in their business models, we decipher how capital flows arise.
For those who want to learn even deeper — Paid Series Picks
 Paid Series
Near-daily reports combining line trading and fundamental analysis
A practical series that reads mid- to long-term supply–demand by combining line trading using trendlines, horizontals, and Fibonacci with fundamental analysis.
 Paid Series
The Royal Road of Investing
A higher-timeframe series that practices a method of selecting optimal currency pairs to trade based on currency strength data, centered on daily and 4-hour charts.
 Paid Series
Learn for a coin a day! Highly reproducible GOLD trading method
The practical edition of the GOLD Silver-Bullet Manual. A series that explains highly reproducible entry thinking and actual trade points, learnable for less than a coin a day.
What is Investment Navi+?
Covers a wide range of investment themes
Market views on FX, stocks, and crypto assets; trading methods; investment mindset; and money management. It’s an investment information content hub you can read within GogoJungle.
Written by sellers and experts
GogoJungle sellers and investment experts publish their knowledge as articles. We deliver highly reliable content written by proven professionals.
Use as a gateway to learning
From free articles to paid series, choose according to your learning depth. Updated weekly as a feature, it delivers this week’s highlighted content.