

【11/16〜11/20 Forex & Gold Weekly Outlook】Dollar strengthens further as US CPI comes in hot. Will USD/JPY break above the 160 level amid intervention expectations?|DXY・EURUSD・USDJPY・XAUUSD
Good morning, this is Noritsin.
First of all, thank you for your hard work this week as well.
Until recently, I had only released work on Kindle, but thanks to a connection, I came to the Gogijan scene, so I plan to post the forex and gold outlook for weekdays and weekends that I had been posting little by little on Note, here from now on. The "3-minute practical investment course you can read and learn" is posted around 8 PM every day, but regarding this outlook article, on weekdays I will post around 7–9 AM and on weekends, usually during Saturday daytime, as long as motivation lasts. (Today is Sunday, though.)
For this weekend edition, I will deliver the outlook for next week (11/16–11/20) using three timeframes: weekly, daily, and 4-hour. All are based on price movements confirmed by the NY close on 11/13 (Friday). This time, because of the transition, the content of this post is exactly the same as the Note version.
This Week’s Review and Next Week’s Overview
This week was a week where the dollar strengthened sharply triggered by the US CPI.
On 11/10, October US CPI rose +0.4% month-on-month, above the forecast +0.3%, and core CPI rose +0.3% vs. +0.2% expected. Fed Governor Waller indicated that if core CPI rises more than 0.3% month-on-month, he would support a 0.5% rate hike in December, making the view of a December rate hike almost certain. Friday’s US PPI rose +0.3% MoM, below the forecast +0.4%, but the overall trend did not change.
DXY rose +1.1% for the week, closing at 103.41. This is the highest weekly close since late March 2025. EURUSD broke below a five-week range, falling to 1.1020, with a weekly close of 1.1022—the lowest since early April 2025. USDJPY broke above the upper boundary of the range on 11/11, rising to 160.20 by 11/13. However, Finance Minister Katayama on 11/13 warned of possible FX intervention, increasing hedging concerns about intervention.
Gold fell sharply by 4.6% for the week due to expectations of rate hikes and dollar strength. It briefly dropped to 3,852 on 11/12, below the 3,870 low on 10/30, but the daily closes on 11/12 at 3,878 and 11/13 at 3,885 remained above 3,870.
This is a recap of last week’s outlook.
Next week’s three points of focus are:
Next Week’s Major Schedule (Japan Time)
Next week’s highlight will be Tuesday’s US Retail Sales and Thursday morning’s FOMC Minutes. In October’s FOMC, Governor Cook and Cleveland Fed President Lacker voted against the rate hike, and the minutes showing how much other members were inclined toward tightening will influence expectations for the December move (0.25% or 0.5%). However, this meeting occurred before the strong CPI, so market reactions may be limited.
For the yen, Japan’s Monday morning GDP and Friday morning national CPI will sway expectations for a December rate hike by the BOJ. With intervention risk high around the 160 level, be prepared for sudden moves regardless of the indicators.
DXYU.S. Dollar Index
1WWeekly
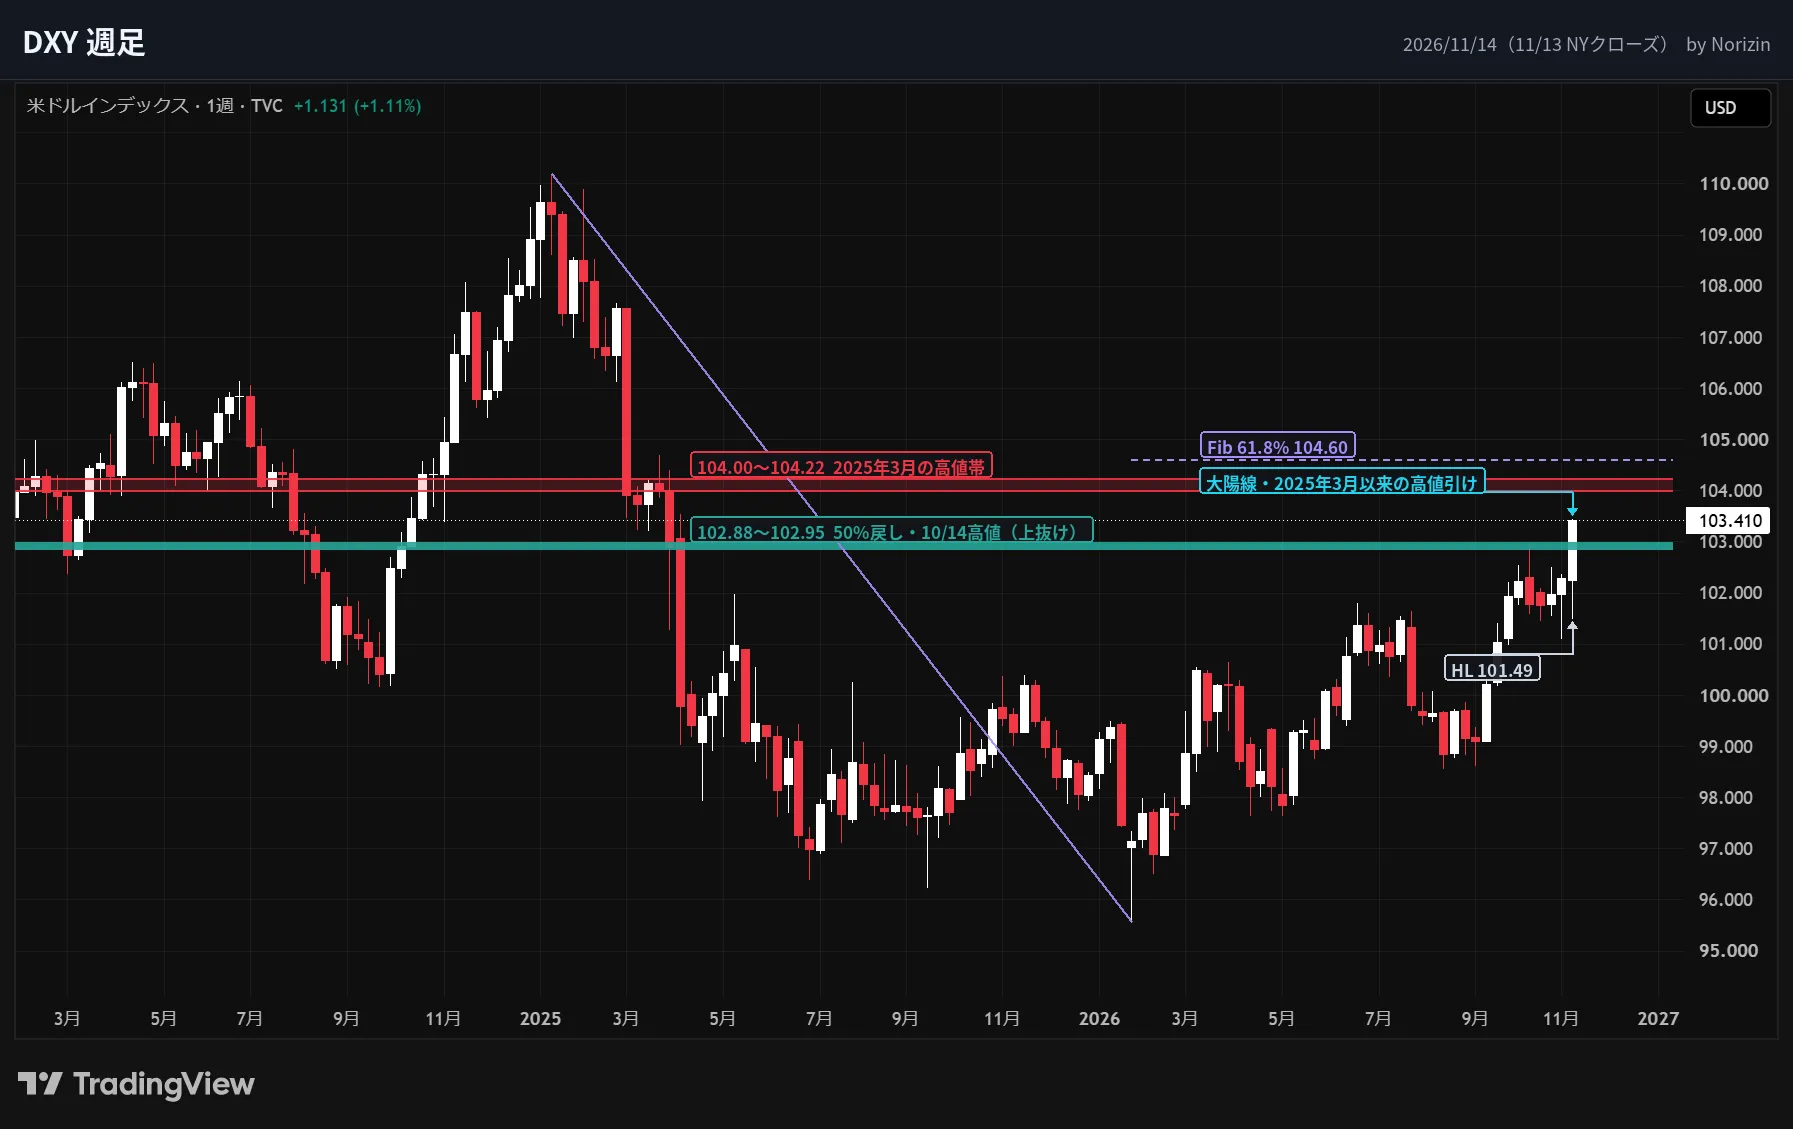
This week rose from 102.28 to 103.41, closing near the high of 103.44 with a large bullish candlestick (+1.1%). This is the highest weekly close since late March 2025.
From the 2025 January high of 110.18 to the January 2026 low of 95.58, the 50% retracement at 102.88 and the 10/14 high of 102.95 were first broken on the weekly close. Having broken above these levels, the next targets are the 104.00–104.22 area from the March 2025 high and the 61.8% retracement at 104.60. The lows have been stepping up (97.65, 98.57, 101.10, 101.49), clarifying a rising trend pattern.
1DDaily
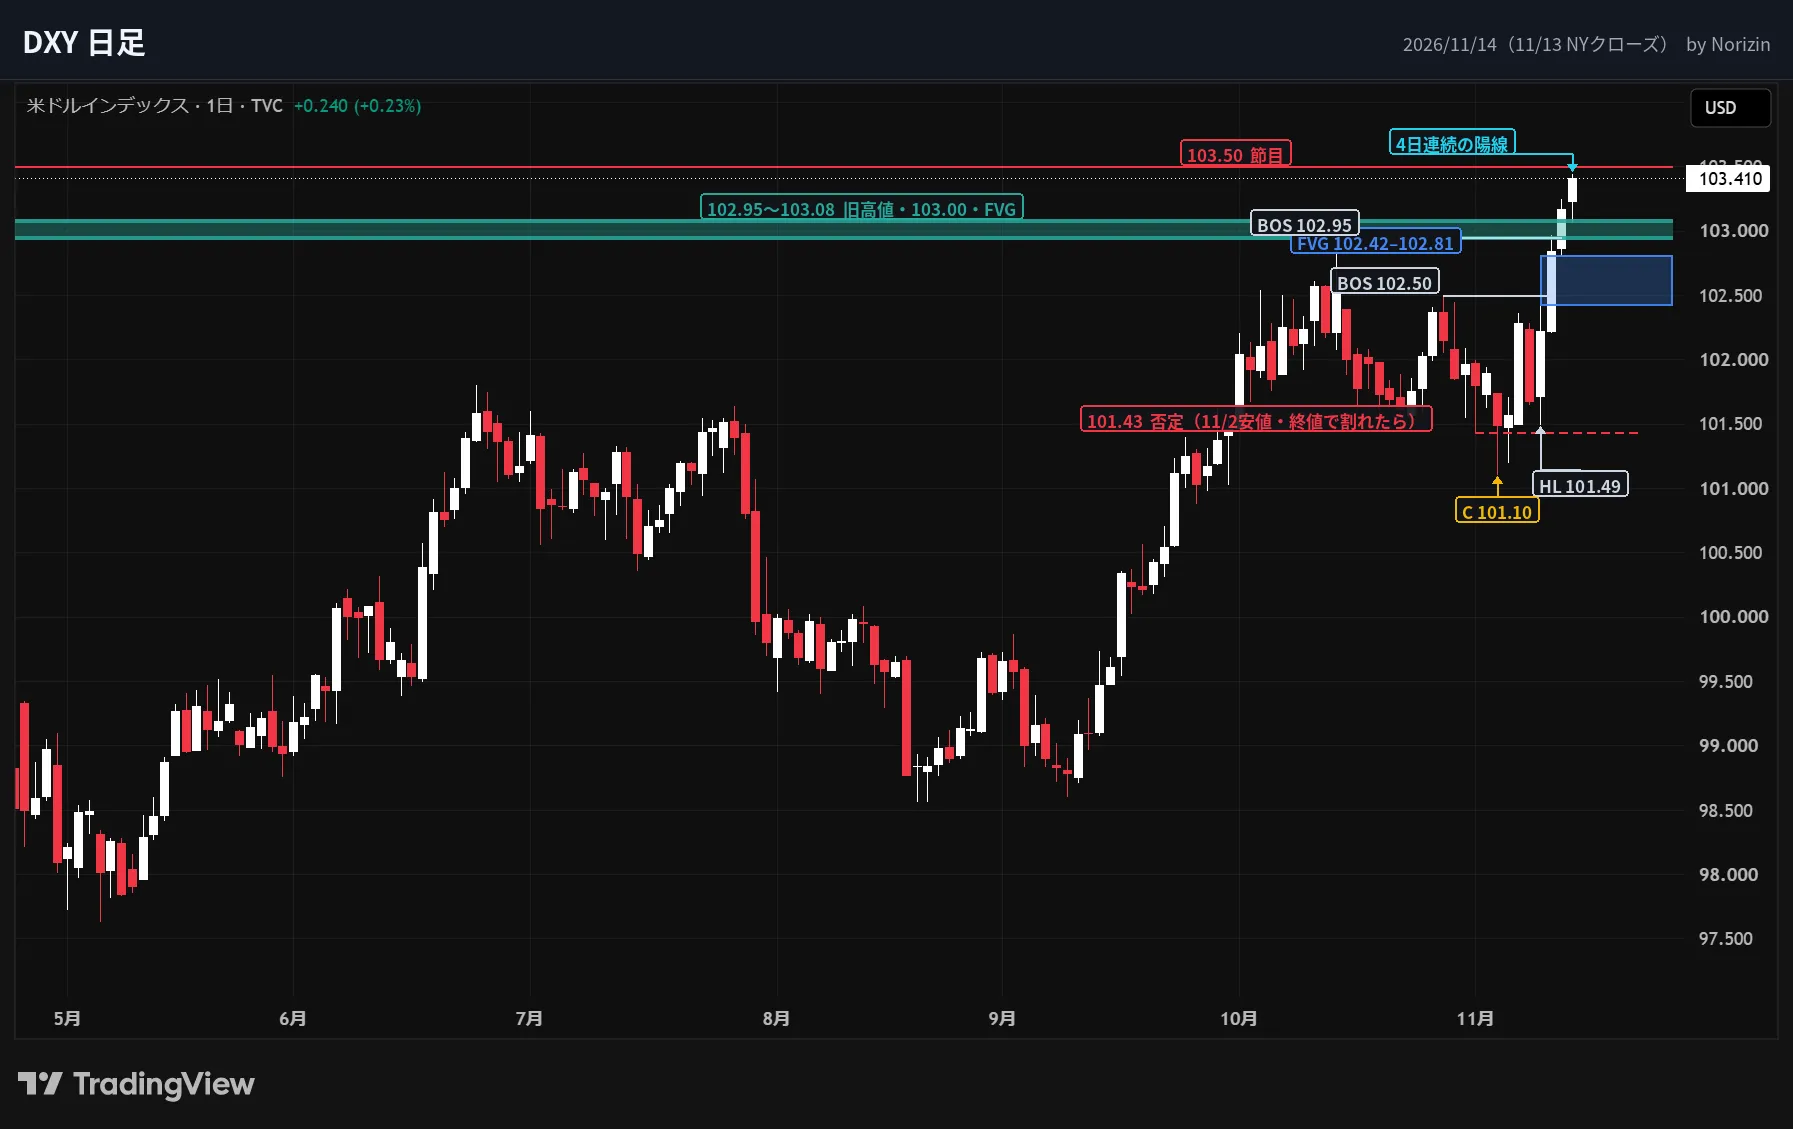
On the daily chart, after a push to 101.49 on 11/10, there were four consecutive positive days. The 11/10 low was higher than 11/4’s 101.10, showing higher lows (HL). On 11/11, it closed above 102.50 (10/28 high), and on 11/12 it closed above 102.95 (10/14 high) (BOS).
From an Elliott wave perspective, if you count 98.60 on 9/9 to 102.95 on 10/14 as five waves, and 101.10 on 11/4 as an A-B-C correction, the current move could be the start of the next up wave. If the 11/2 low of 101.43 is broken by the daily close, this view would be invalidated.
During the rise, two daily FVG gaps remain: 102.42–102.81 formed on 11/11 and 102.97–103.07 formed on 11/12. The 102.97–103.07 aligns with the breakout high of 102.95 on 10/14 and the 103.00 milestone.
4H4-hour
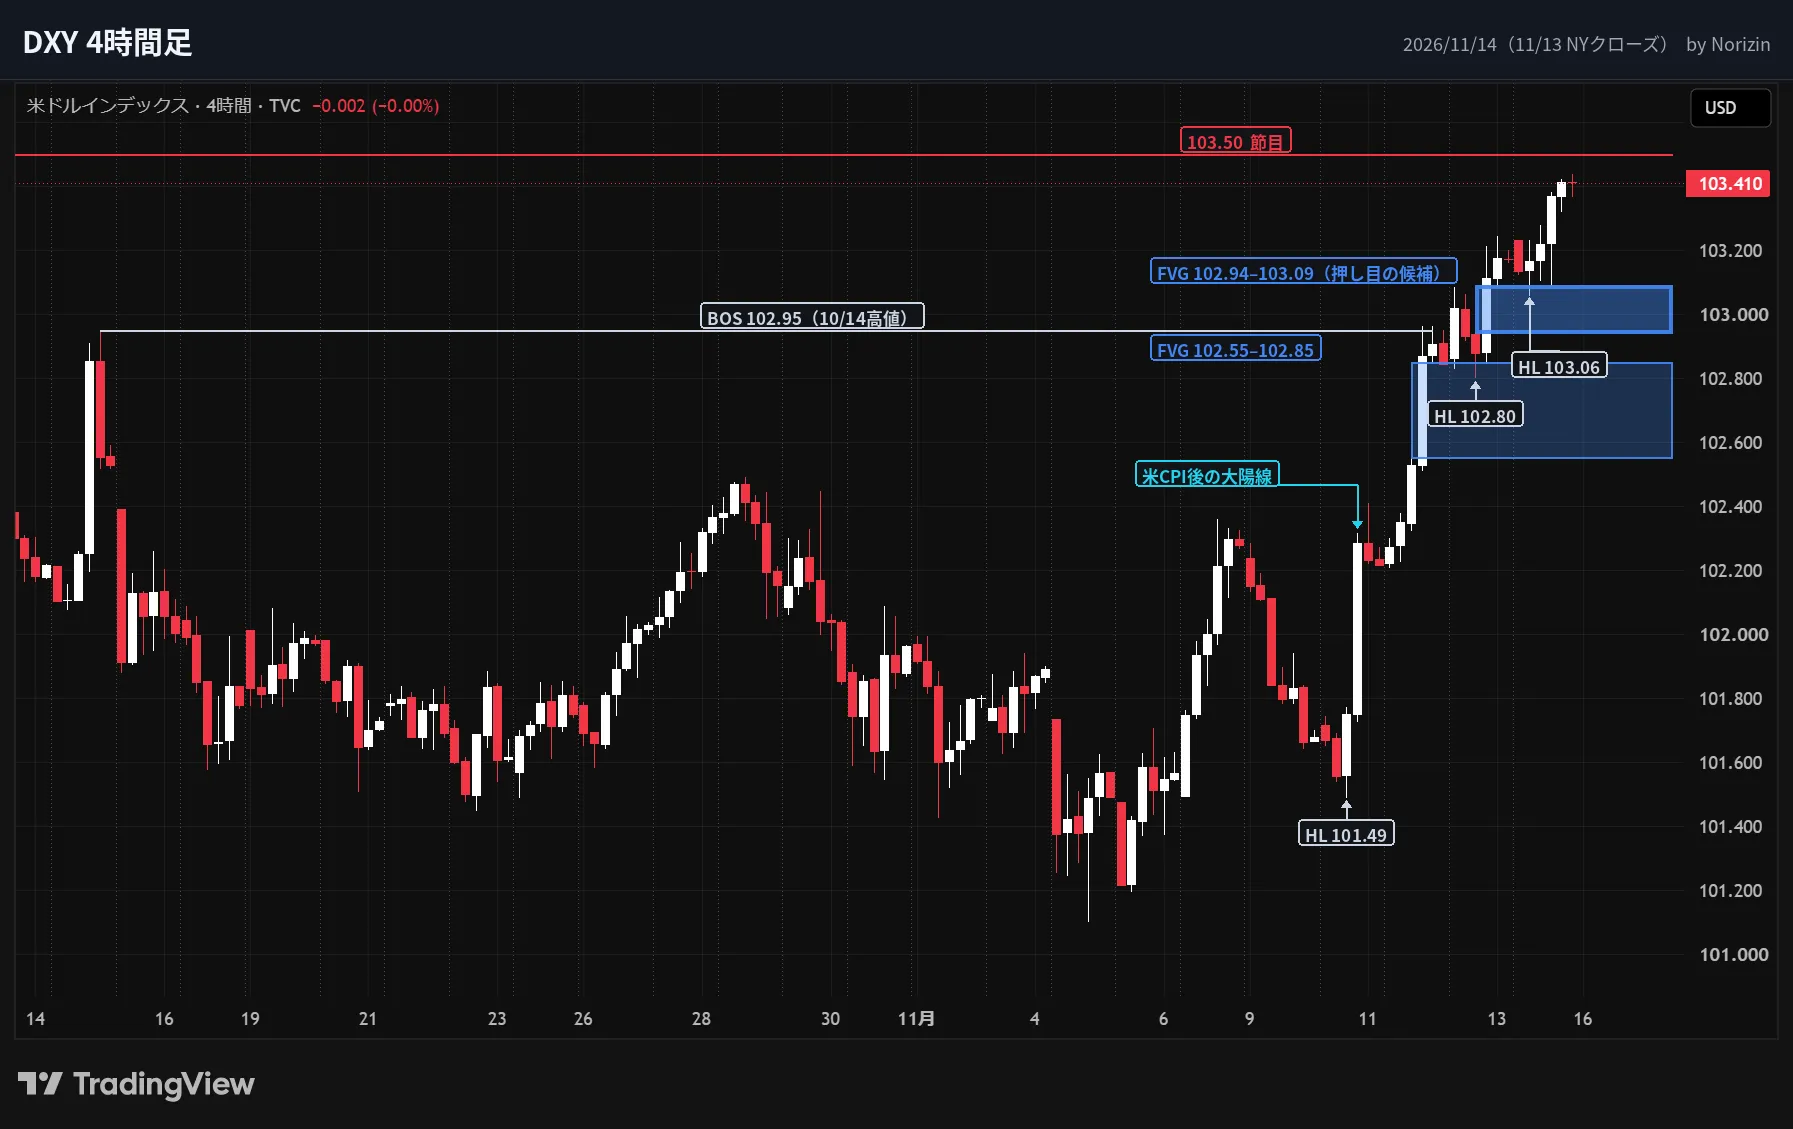
In the 4-hour chart, after the CPI release on 10/14, a strong up move began, with rising pullbacks: 101.49, 102.80, 103.06.
Pullback targets are 102.95–103.08. The 4-hour FVG 102.94–103.09 overlaps with the breakout high of 102.95 and the 103.00 milestone, with the pullback stalling at 103.06 on 11/13. This is the most important price zone for next week, where three different bases converge. Above, watch whether 103.50 can be broken.
BIASDirection for next week
LEVELSKey price zones
PLANScenario
MAIN
Support pullback at 102.95–103.08, break above 103.50, and test 104.00–104.22.
ALT
If 102.95 fails on daily close, pullback could extend to 102.42–102.81 on the daily FVG.
EURUSDEuro-Dollar
1WWeekly
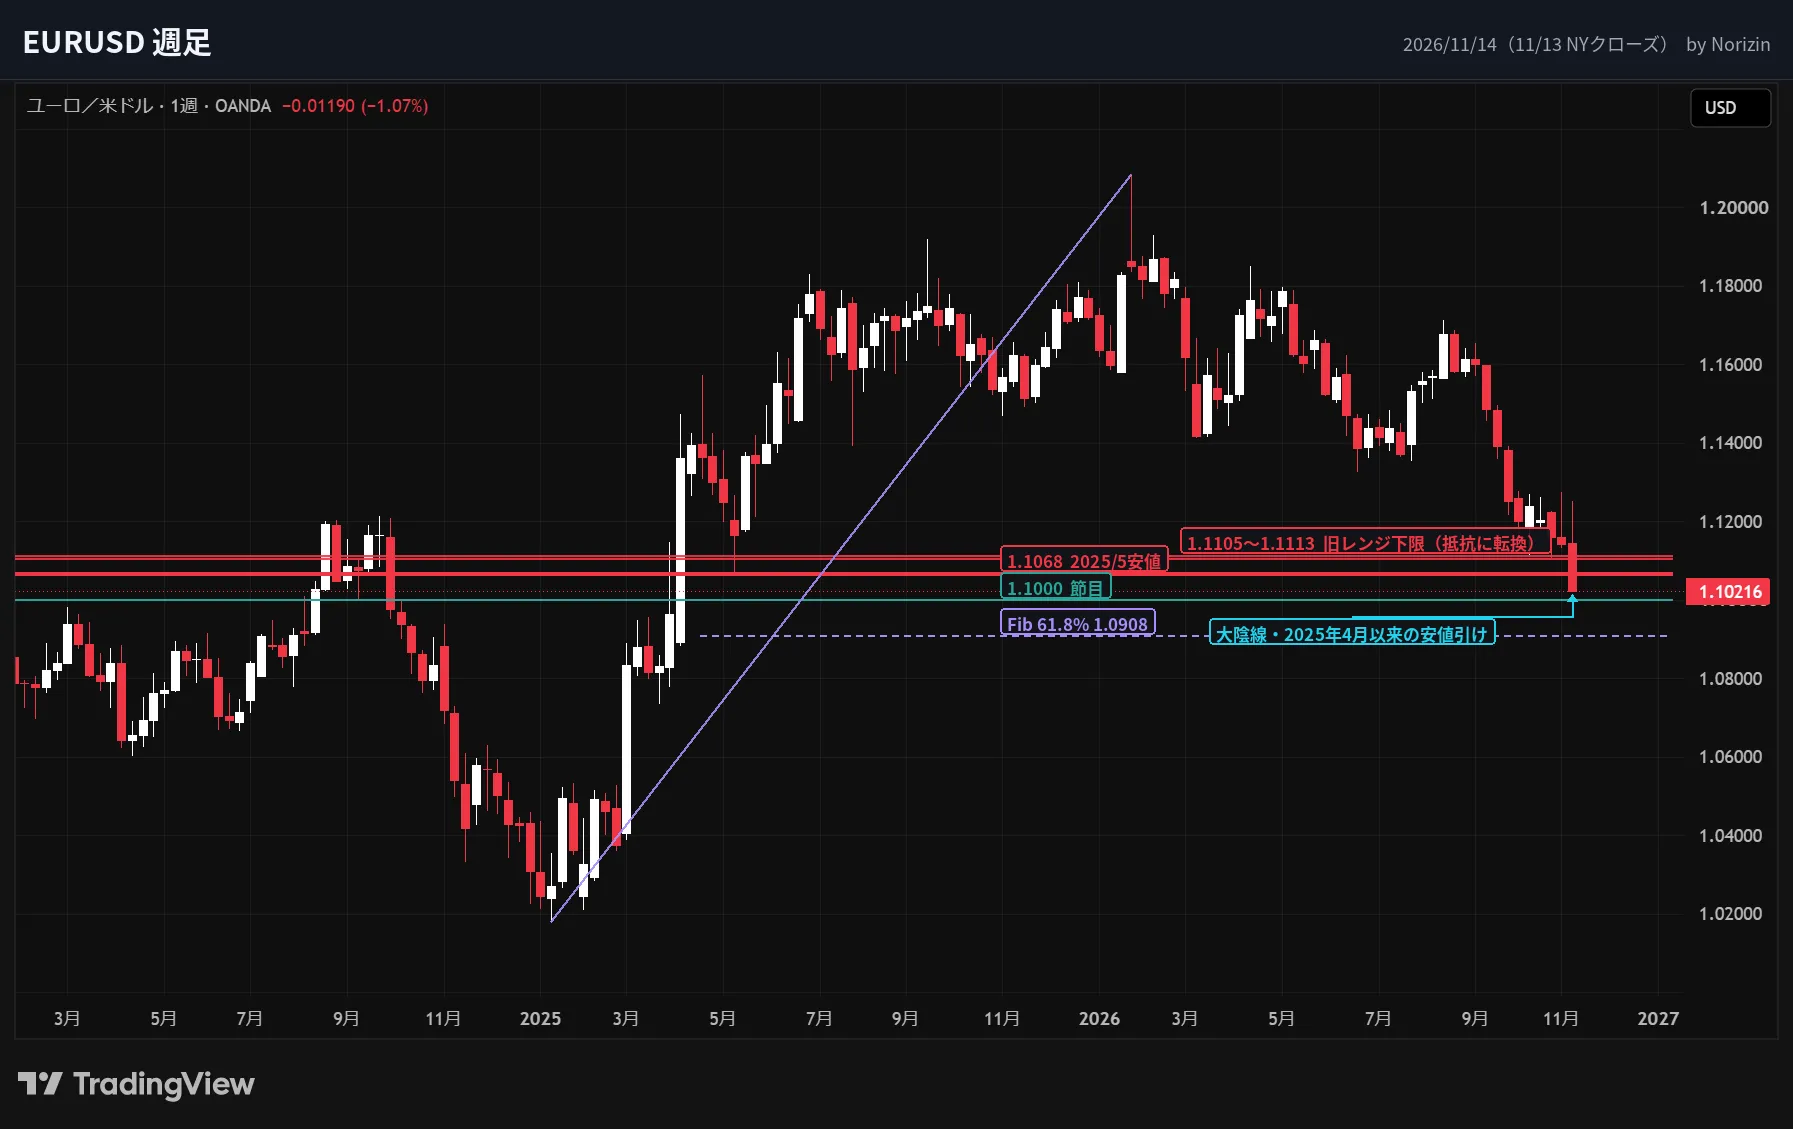
This week saw a large bearish candlestick from 1.1141 to 1.1022 (-1.1%), with the weekly close at the lowest since early April 2025. It briefly retraced to 1.1252 in the first half of the week, but then sold off sharply.
It broke the five-week range’s lower bound of 1.1105–1.1113, and the May 2025 low of 1.1068 was also closed below. From January's high of 1.2084 through April’s 1.1850 and August’s 1.1712 to November’s 1.1252 retracements, the downtrend persists. The next targets are the 1.1000 milestone and the 61.8% retracement at 1.0908 rising from the January 2025 low of 1.0182 to the January 2026 high of 1.2084.
1DDaily
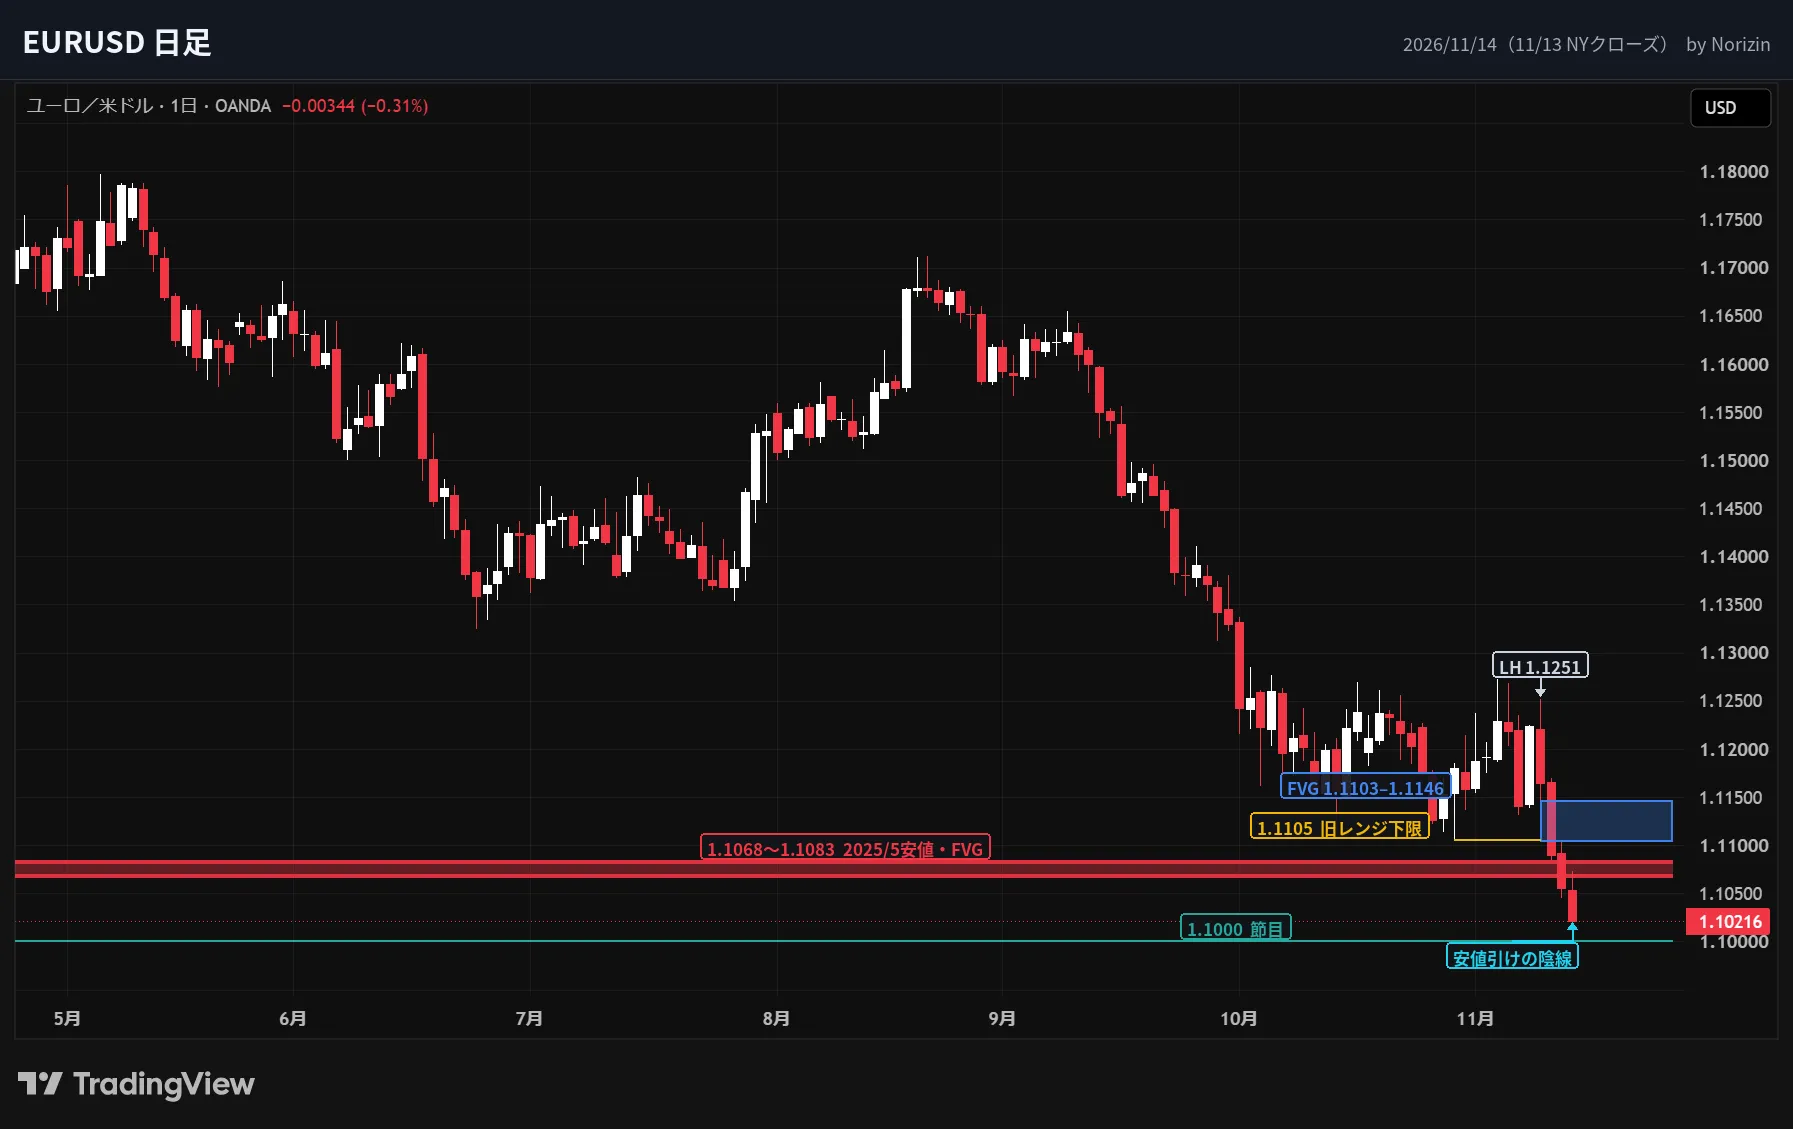
On the daily, after falling to 1.1022 on 11/13 with a push lower, the low of 11/4 at 1.1010 was taken out, and 11/13 closed near the low at 1.1022. Above, two daily FVGs remain: one at 1.1103–1.1146 created on 11/11 coinciding with the broken lower range 1.1105–1.1113; another at 1.1073–1.1083 created on 11/12, just above the May 2025 low of 1.1068. The 11/13 pullback stopped at 1.1073.
4H4-hour
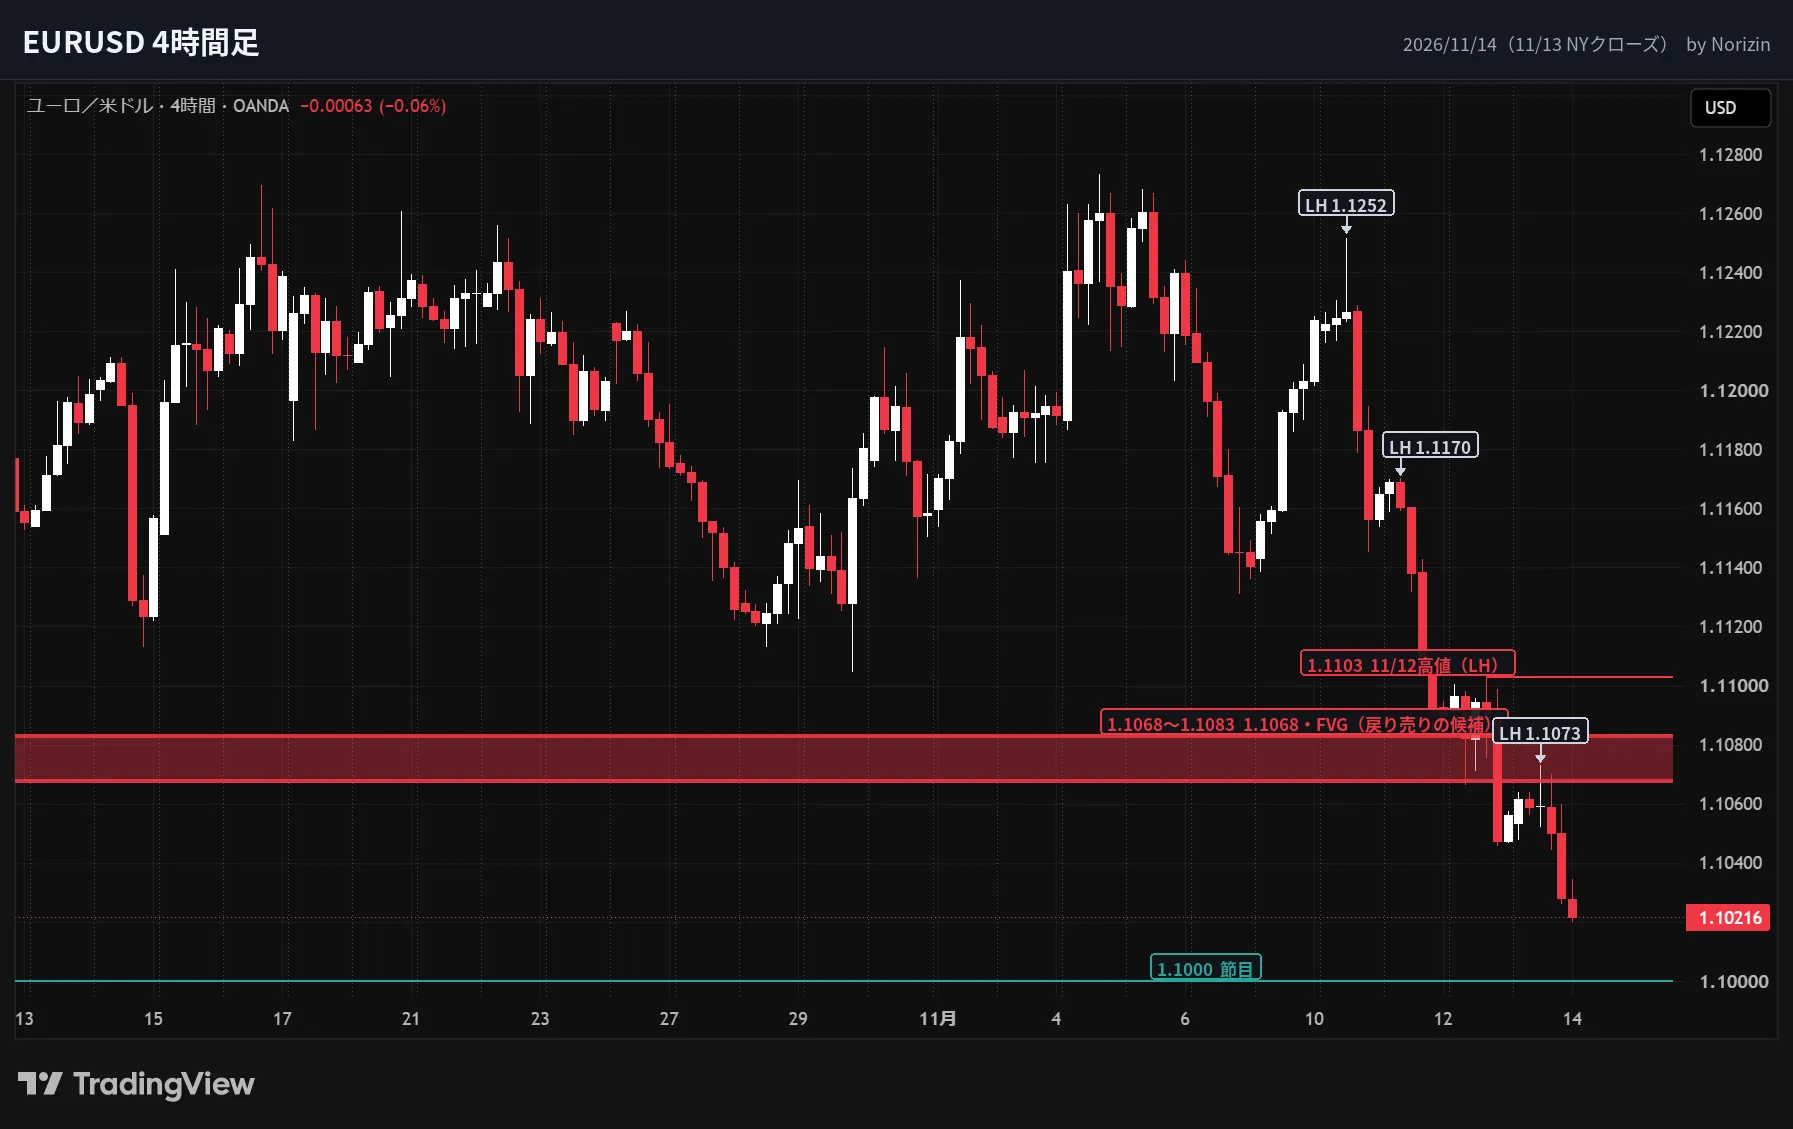
In the 4-hour chart, recovery highs have stepped down: 1.1252 (11/10), 1.1170 (11/11), 1.1103 (11/12), 1.1073 (11/13). Pullback targets are 1.1068–1.1083. The May 2025 low of 1.1068 now acts as a resistance level, overlapping with the daily FVG and 11/13 high of 1.1073 (pullback target).
BIASDirection for next week
LEVELSKey price zones
PLANScenario
MAIN
Hold the pullback in the 1.1068–1.1083 range and test 1.1000. If the daily close breaks below 1.1000, 1.0908 becomes the next target.
ALT
If 1.1083 breaks above on the daily close, there could be a rally back to 1.1103–1.1113.
USDJPYDollar/Yen
1WWeekly
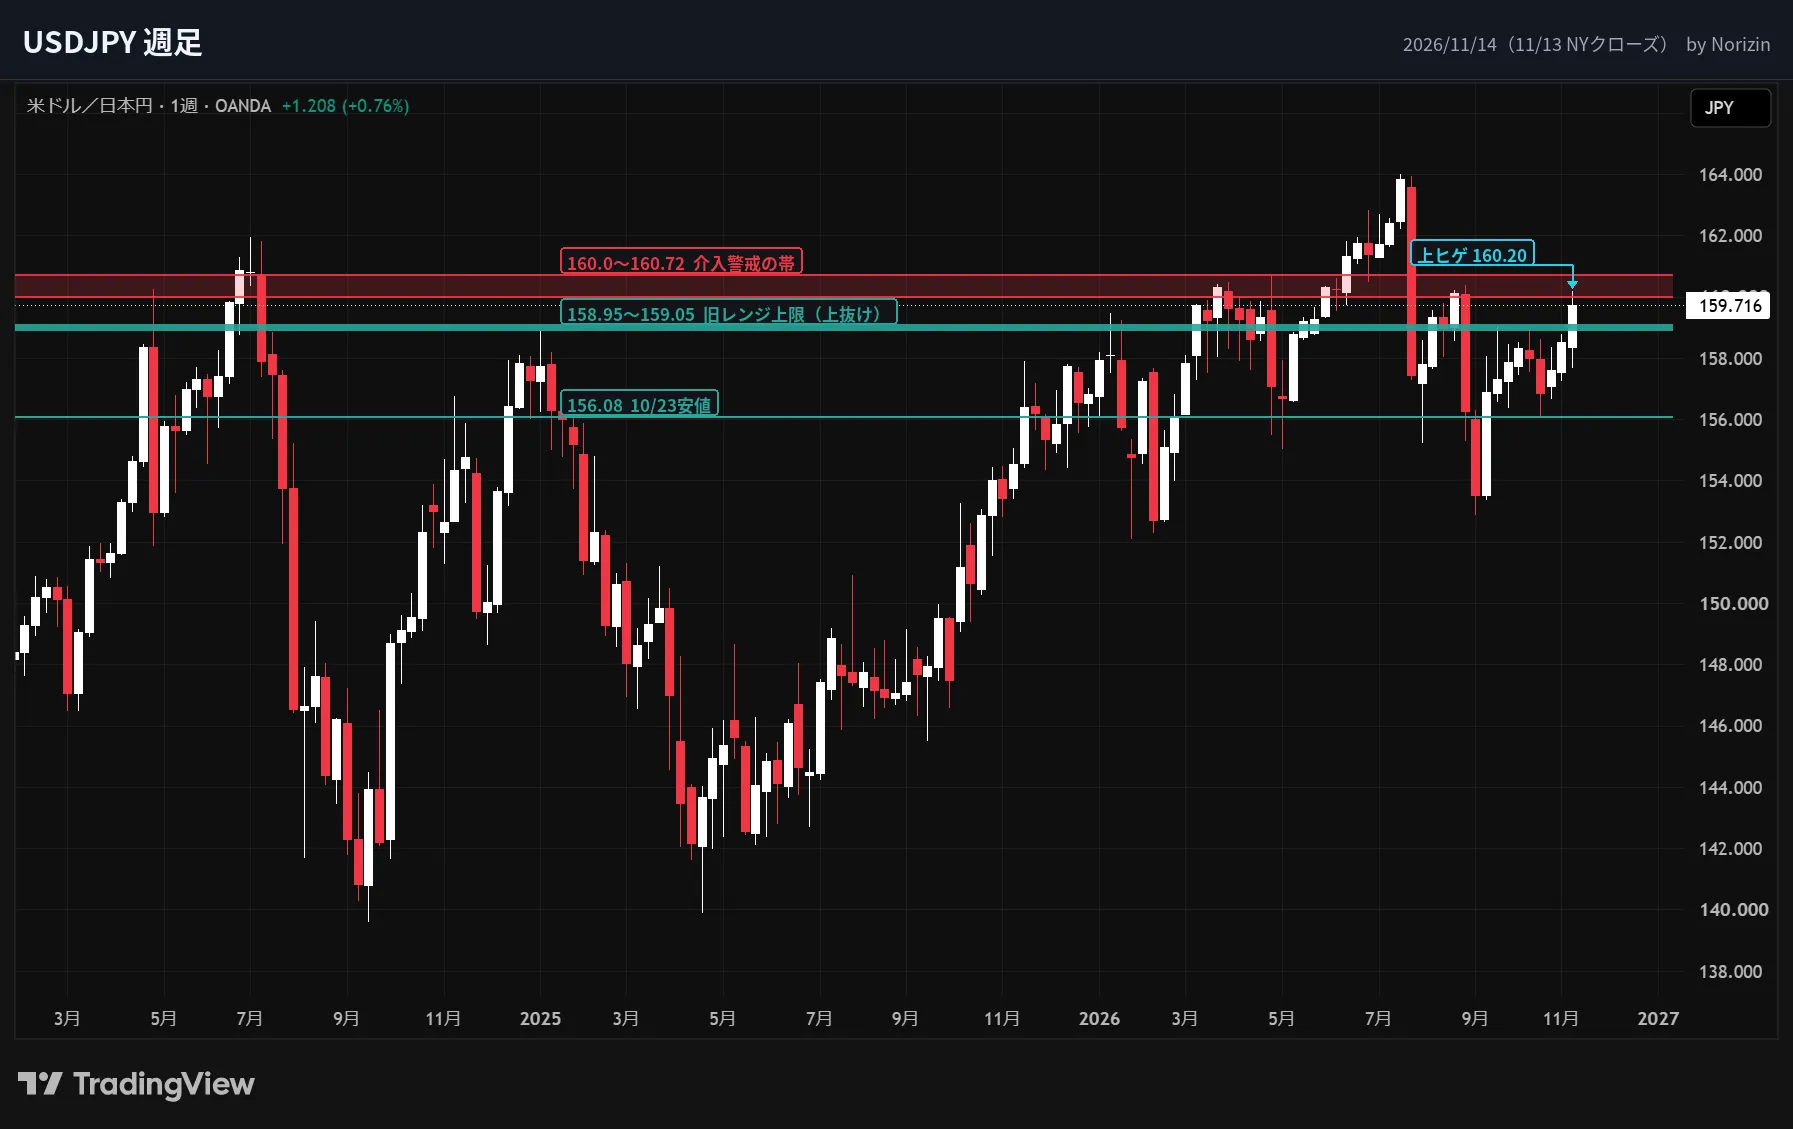
This week rose from 158.51 to 159.72 (+0.8%), breaking above the range top of 158.95–159.05 on a weekly close for the first time since late August, making the close the highest since late August 2025.
However, from the high of 160.20 it pulled back, leaving a long upper wick. The zone around 160.0–160.4 is a high-risk area due to past highs in late August–early September and the 160.72 high of 4/30 when the government and BOJ intervened, hence hedging is prudent.
1DDaily
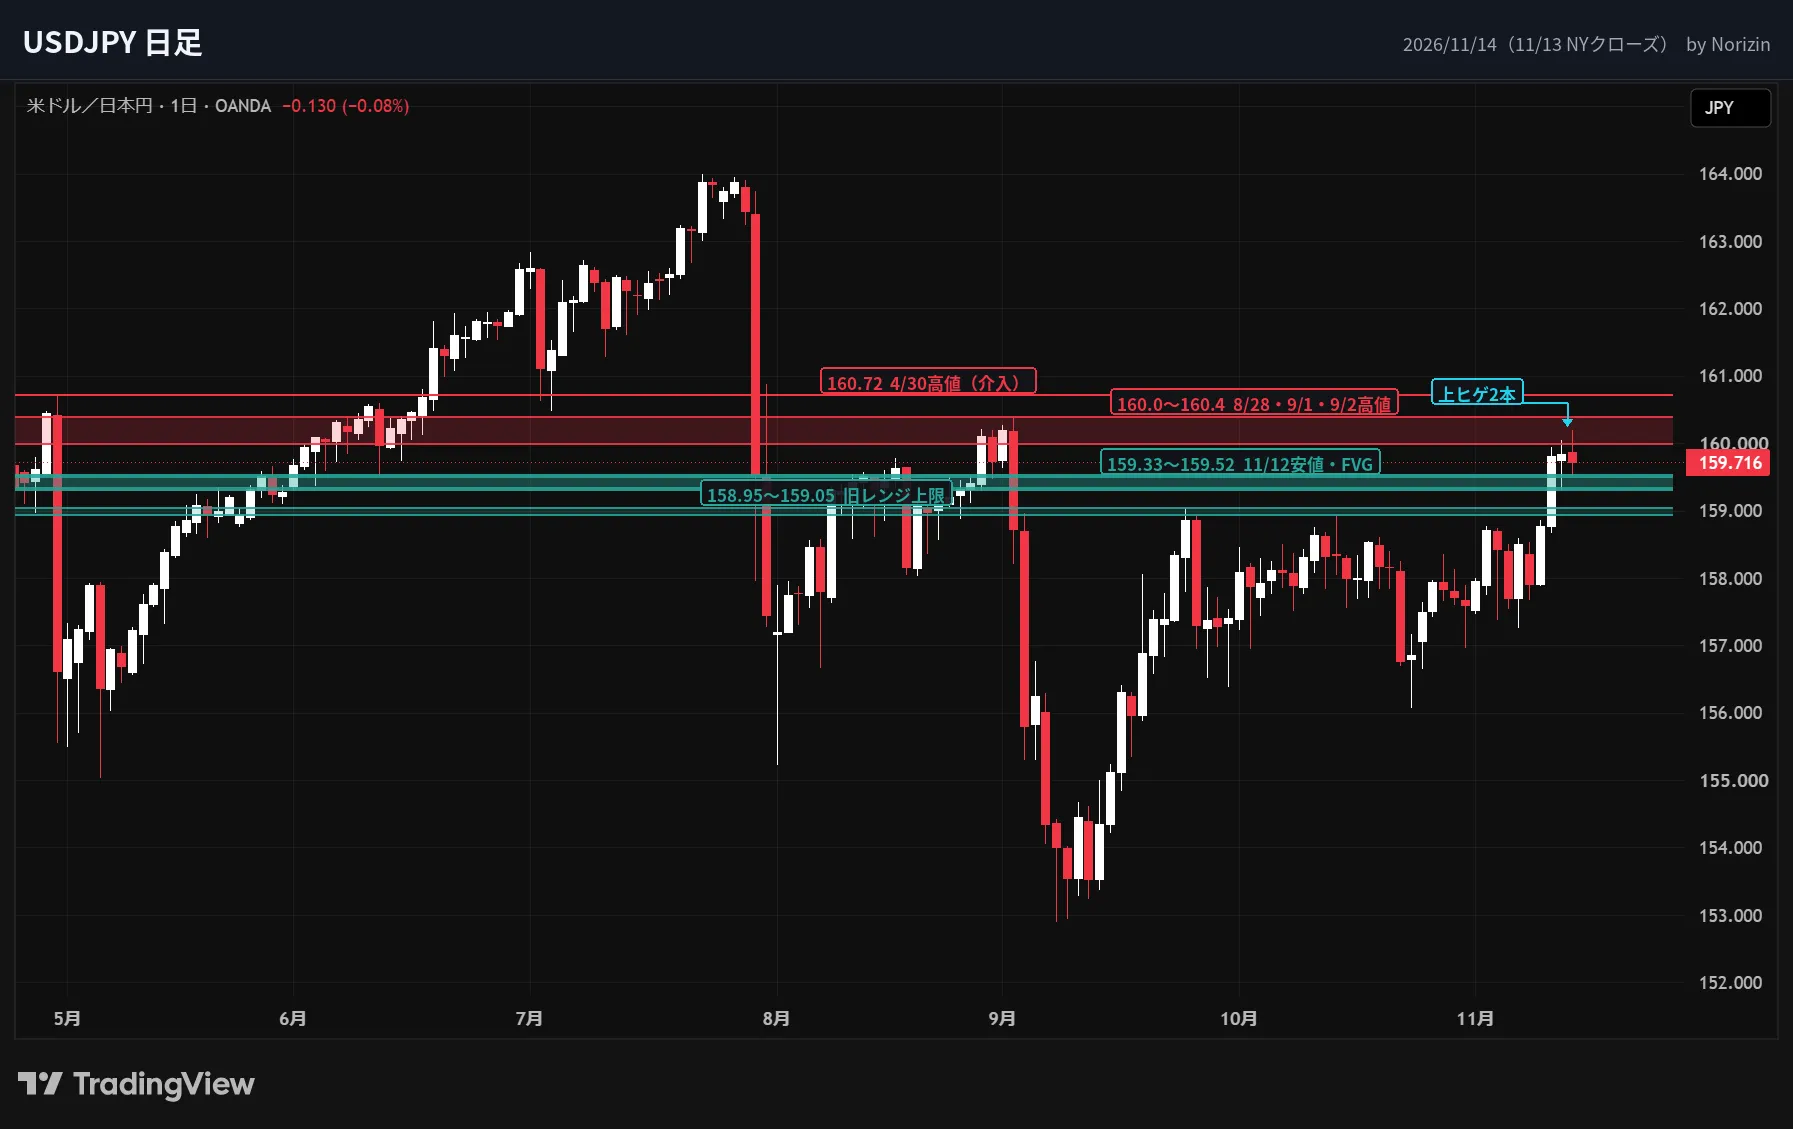
On the daily, CPI-driven move lifted to 159.05 on 11/11 and closed at 159.81. The next two days reached 160.05 (11/12) and 160.20 (11/13) but both times the price failed to sustain and returned to the 159x area. On 11/12 there was a rapid drop to 159.33 just after hitting 160.05 during NY hours. The upper boundary around 160.0–160.4 remains a significant resistance.
Below, the 159.33 low on 11/12 and the 4-hour FVG upper edge around 158.97–159.52 form the first support, with 158.95–159.05 being the upper end of the broken range now acting as support to confirm a possible shift.
4H4-hour
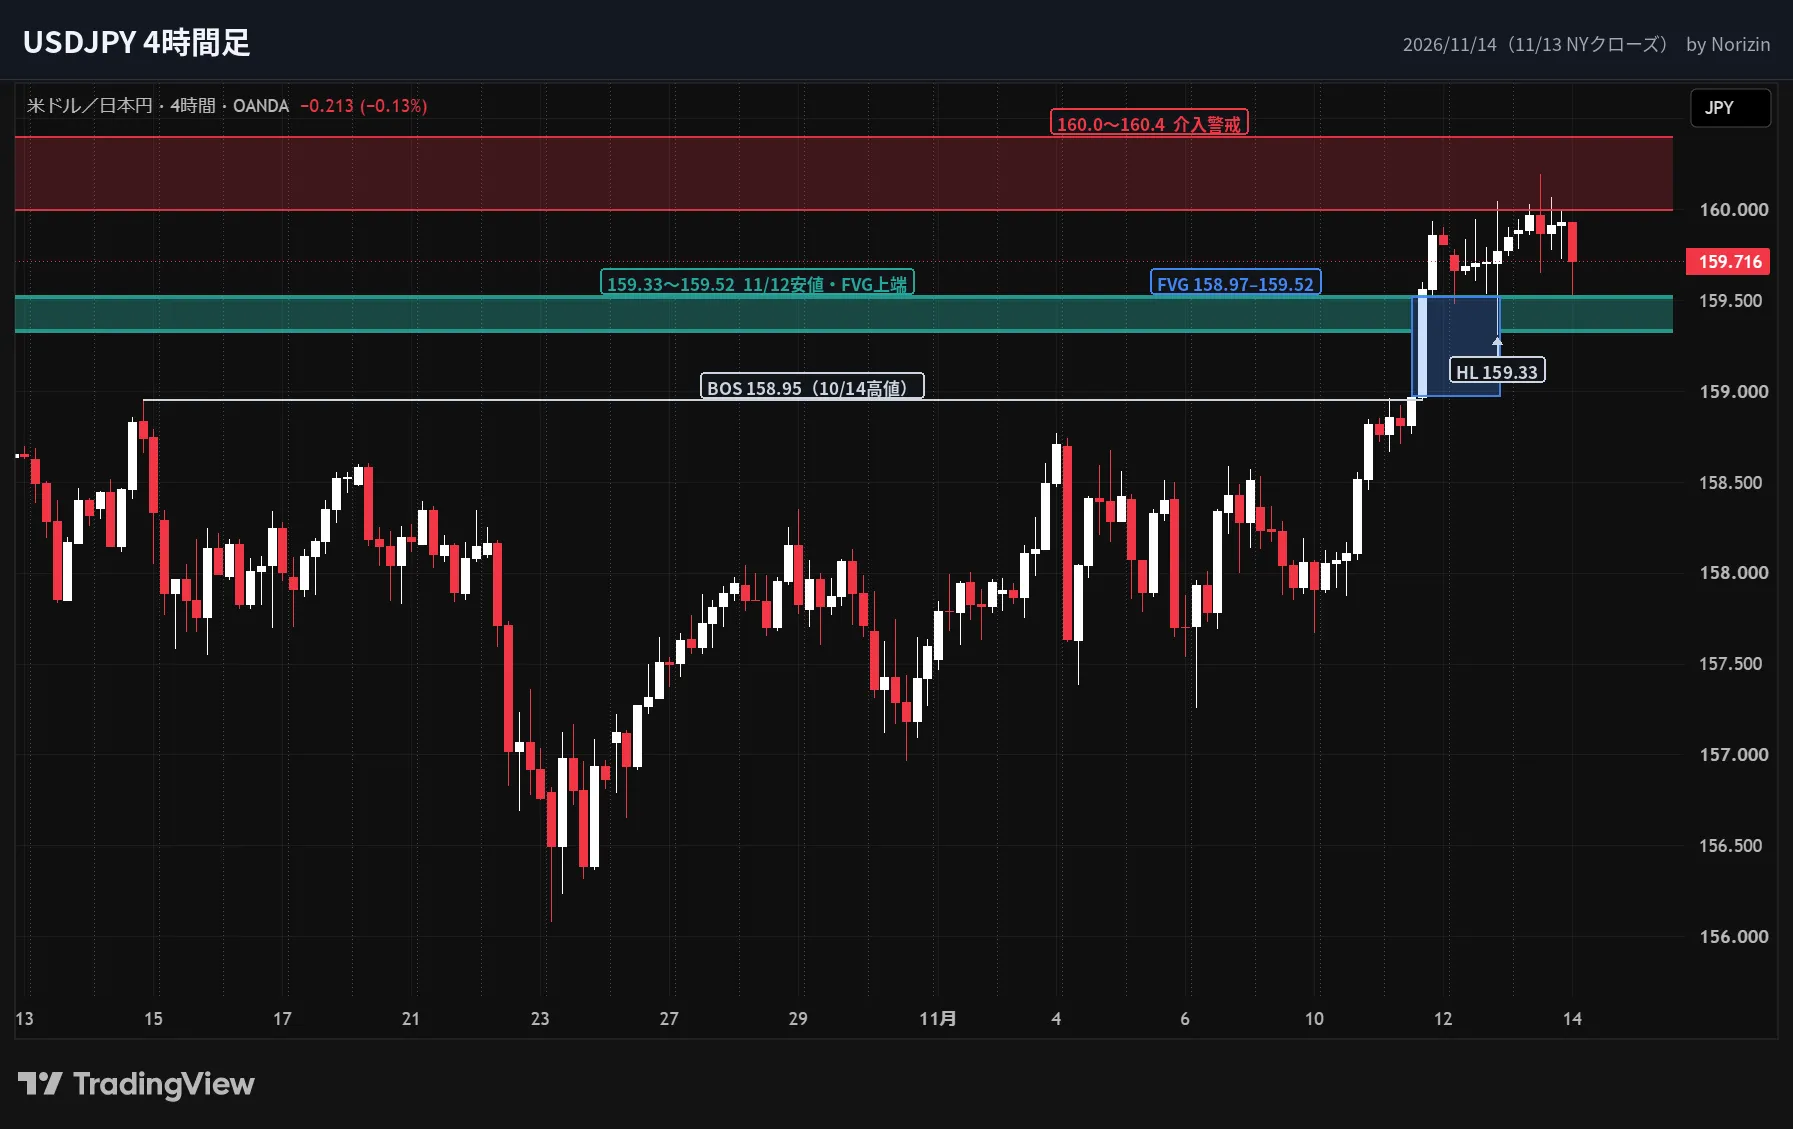
In the 4-hour chart, after the 10/14 high of 158.95 was broken on 11/11 (BOS), 11/12–11/13 range has been 159.33–160.20. The lower bound of 159.33 is a floor; the upper around 160 is a cap.
Breaking below 159.33 on a 4-hour close would push toward the FVG lower edge at 158.97 and the range top at 158.95–159.05.
BIASDirection for next week
LEVELSKey price zones
PLANScenario
MAIN
Support pullback at 159.33–159.52 and break above 160.0–160.4 to test 160.72; but be wary of sudden yen moves around 160.
ALT
If 159.33 breaks below on daily close, pullback could extend to 158.95–159.05.
XAUUSDGold
1WWeekly
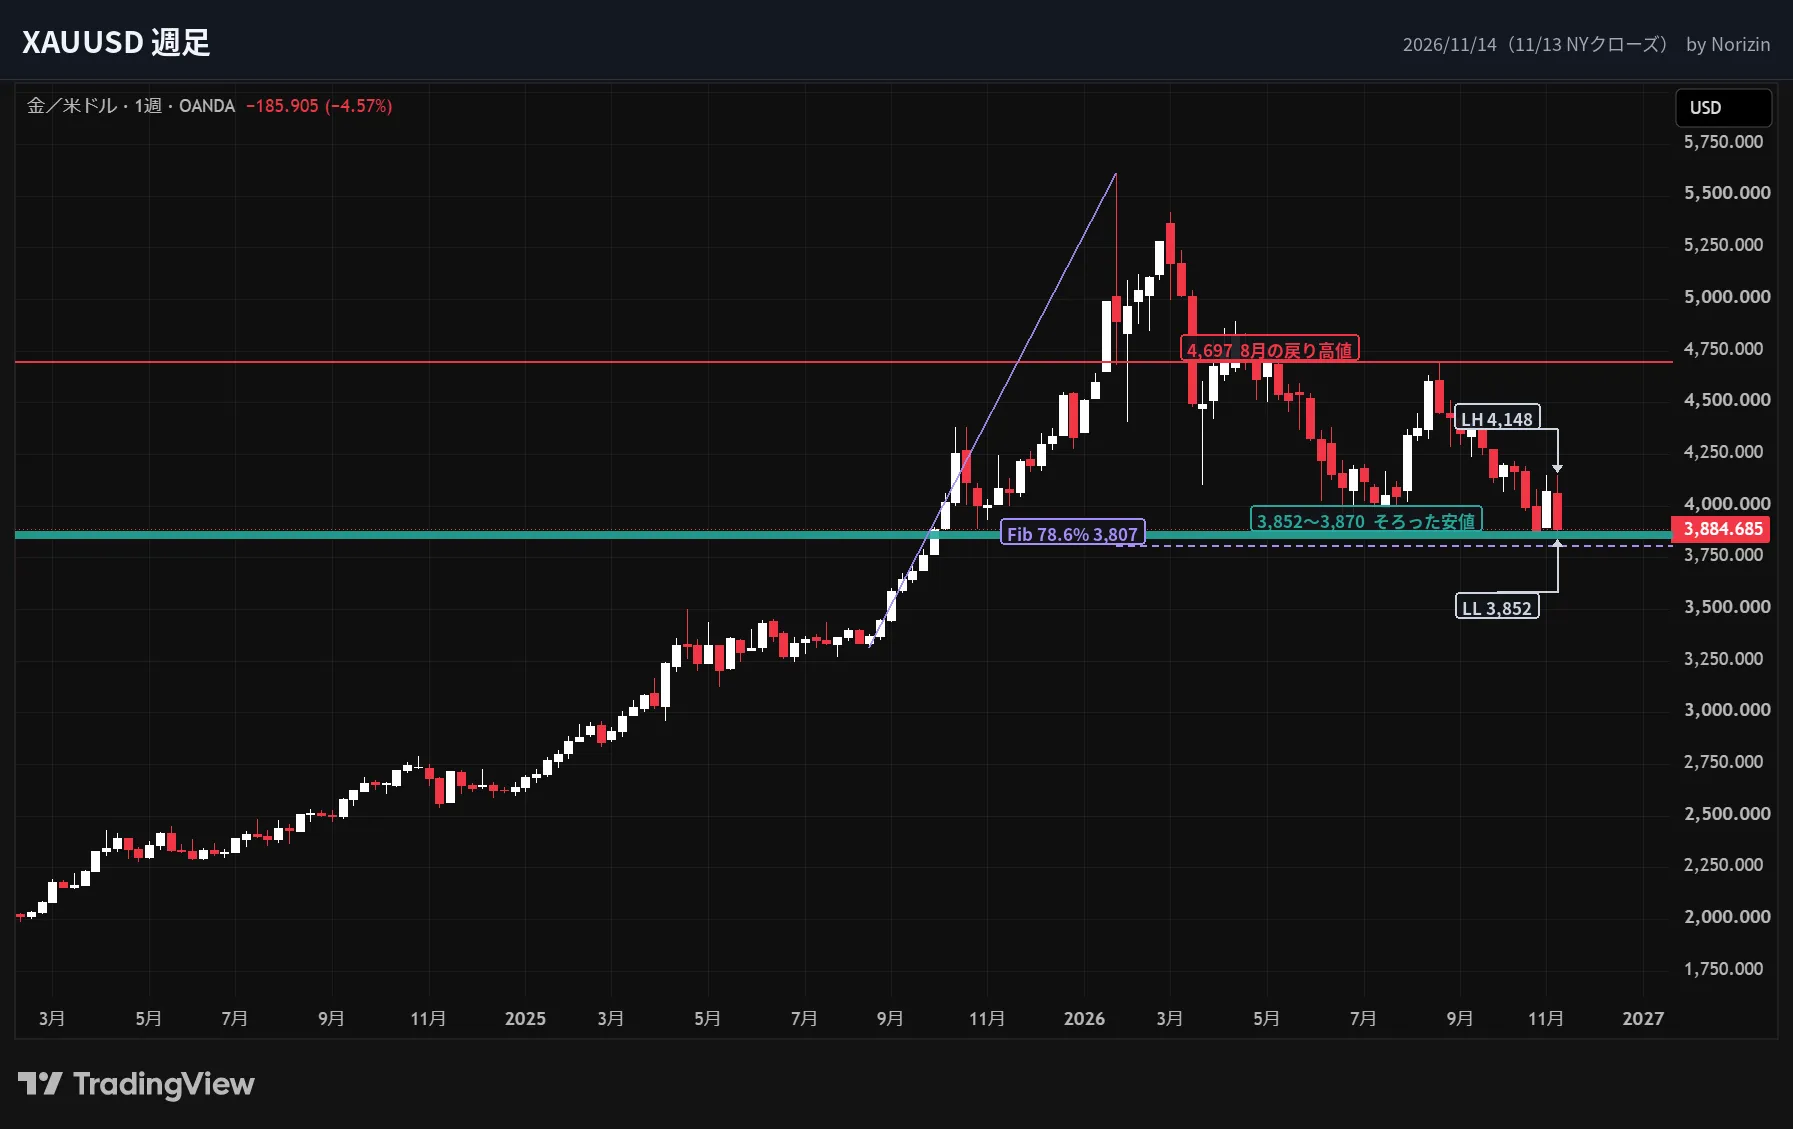
This week’s large bearish candlestick from 4,071 to 3,885 (-4.6%) largely offset last week’s gain of +5.0%. The low of 3,852 undercuts the Oct 30 low of 3,870, continuing the downtrend. The higher retracement highs have also stepped down from August’s 4,697 to this week’s 4,148.
Key support levels are 3,807 (78.6% retracement from the August high to the all-time high at 5,605) and the 3,800 milestone.
1DDaily
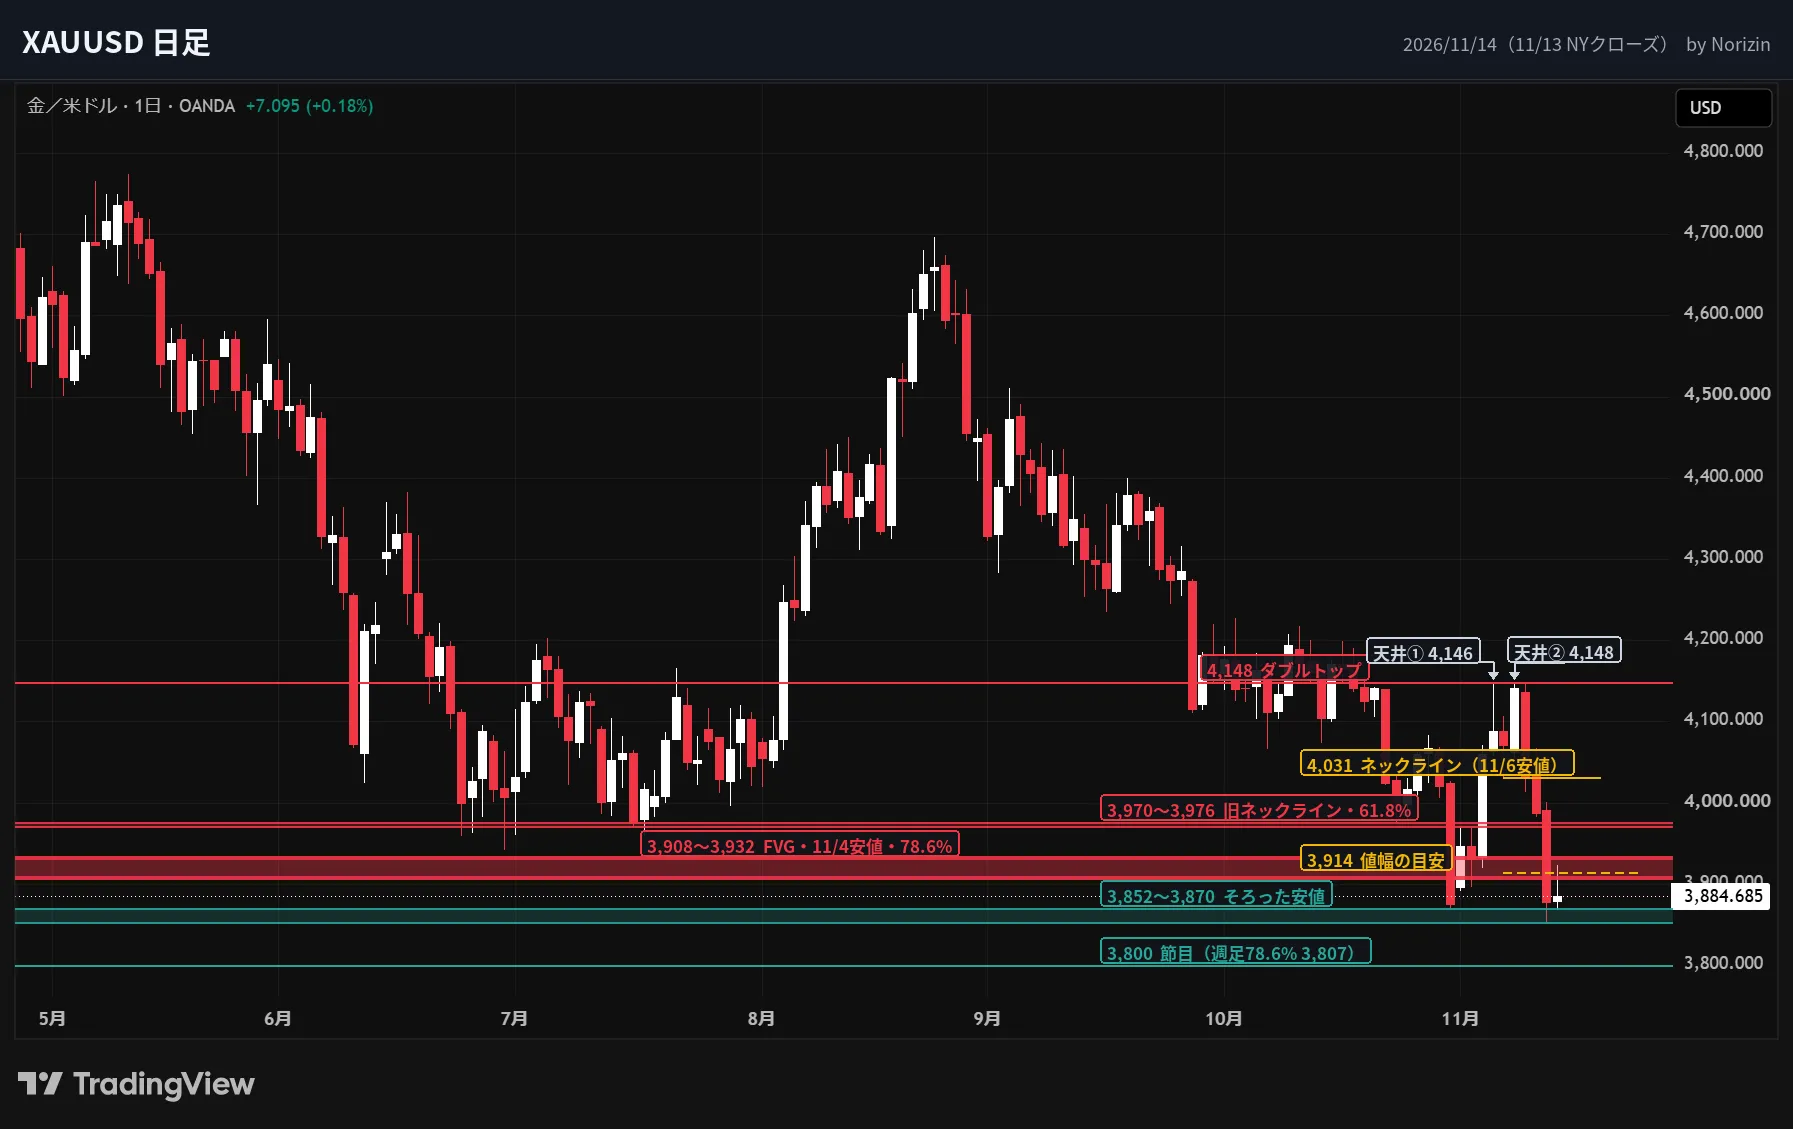
On the daily, a double top formed at 4,146 on 11/5 and 4,148 on 11/9. The neck line at 4,031 (11/6) was breached, closing at 3,987 on 11/11. A measured move from neck to top places support around 3,914, and 11/12 closed below that at 3,852.
From an Elliott wave view, the move from 8/25’s 4,697 to 10/30’s 3,870 as five waves remains valid for now. The price briefly pierced 3,870 on 11/12–11/13 but closed above it, so the view stands unless daily closes below 3,870.
There are two walls above. One around 3,908–3,932 coinciding with the 4-hour FVG, 11/4 low 3,919, and 78.6% retrace of 3,870–4,148 (~3,930). The other around 3,970–3,976 at the 11/4 completed double bottom neck 3,970 and 61.8% retrace 3,976. The 11/13 rebound stopped at 3,923.
4H4-hour
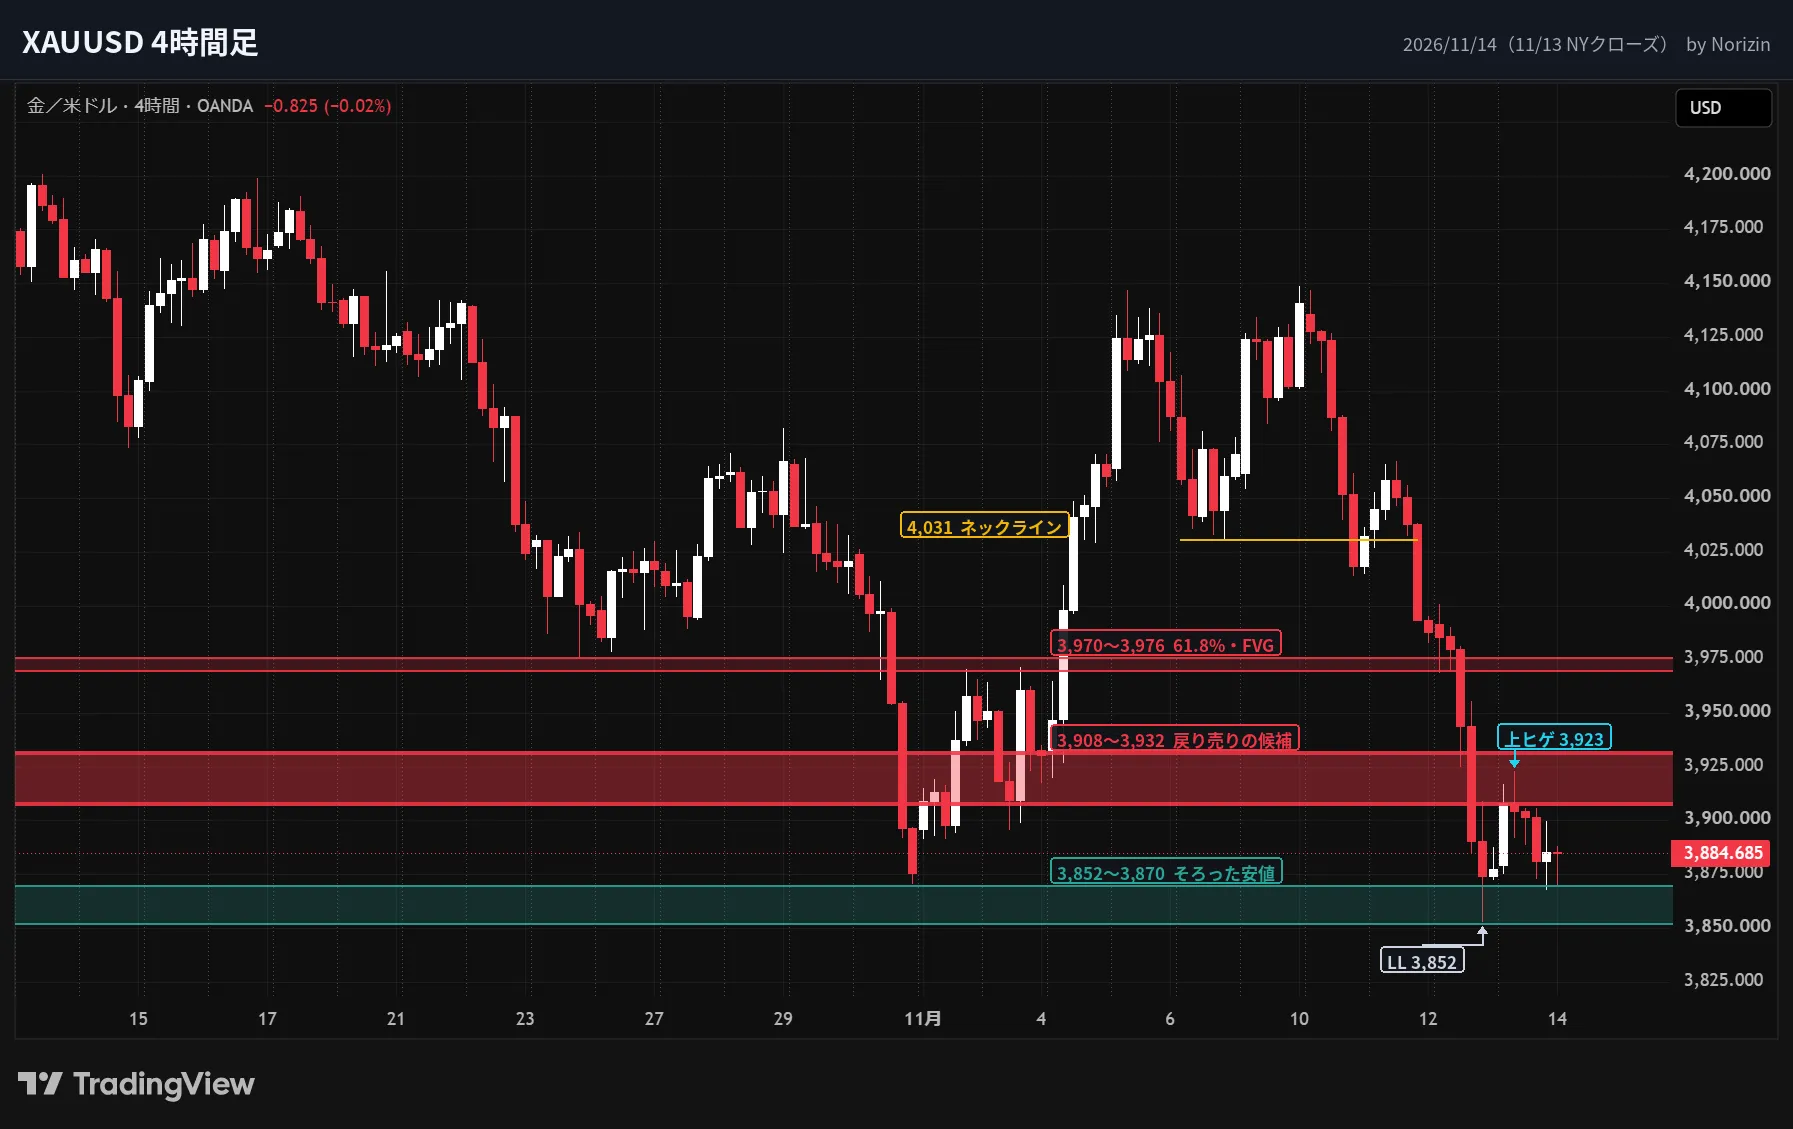
In the 4-hour, after the 10/30 drop to 3,852, price traded in a tight 3,868–3,923 range; the retrace on 11/13 paused at 3,923 and turned down.
The lower zone 3,852–3,870 is a cluster with the 10/30 and 11/12 lows; there are many stop orders below, so a close below 3,852 on a daily basis could accelerate the decline.
BIASDirection for next week
LEVELSKey price zones
PLANScenario
MAIN
Hold pullback in 3,908–3,932 and attempt 3,852–3,870; if daily close breaks 3,852, next target is 3,800–3,807.
ALT
If price breaks above 3,932 on a daily close, it may retrace to 3,970–3,976.
Next Week Summary
This week, US CPI surprise strengthened expectations for a December rate hike and led to a broad dollar rally. DXY broke above the 102.95 high from 10/14, EURUSD broke below its five-week range, and gold formed a double top.
Next week is about confirming whether the dollar’s strength persists. DXY’s pullback zone around 102.95–103.08, EURUSD’s sell zone around 1.1068–1.1083, and gold’s sell zone around 3,908–3,932 are key. USDJPY may diverge from the other three due to intervention risk around the 160 level.
This Week’s Quick Tip: FVG (Gaps) are places where pullbacks and corrections tend to stop
A Fair Value Gap (FVG) is a “gap” left when price moves quickly and the ranges of the first and third candles do not overlap. Because price moved rapidly in one direction, that price area has little trading. When price returns, pending orders and positions waiting to be unwound become more likely to be executed, and pullbacks or corrections tend to stop there.
This week, three assets saw effective FVGs.
What’s common among the three is that the FVG aligned with other evidence. DXY aligned with the breakout level at 102.95–103.00, EURUSD with the broken May 2025 low at 1.1068, and gold with the 3,919 low on 11/4 and the 78.6% retrace at 3,930. Do not rely on FVG alone; look for confluence with other evidence to identify likely support/resistance zones.
Conversely, if the price closes beyond an FVG, that zone’s role ends. Next week, whether DXY breaks 102.95 on a daily close and whether gold breaks 3,932 on a daily close will be the breaking points for each scenario.
Have a great week ahead.
Note: This article reflects a personal interpretation based on technical analysis and does not constitute a recommendation to buy or sell any financial instrument. Backtest results are based on historical data and do not guarantee future performance. With leveraged trading such as FX and CFDs, there is a risk of losses exceeding the initial capital. Please make investment decisions at your own risk.