

+1547pips【Weekly Trade Verification & Delivery History】GOLD Day Trade Specialized 「GOLD STREAMv2」2026.11.9~11.13
+1547pips【Weekly Trade Verification & Delivery History】
GOLD Day Trading Specialization "GOLD STREAM v2" 2026.11.9~11.13
Review GOLD’s price movement, strength, and correlations, and test signal accuracy, range, and expectancy weekly. We evaluate this trading environment not only by win rate but also by PF, Exp(R), and 5-day ADR comparisons.
① GOLD Market Analysis
1. Price Variability
- From the start to the middle of the week, there were back-and-forth battles around highs with ups and downs, but from the midweek a strong selling pressure erupted, breaking major supports one after another and developing into a historic sharp decline trend.
- In the latter half, after testing the lows, the retracement selling overwhelmingly dominated, continuing a dynamic downtrend that offered multiple ideal setups for short-term trend-following.
- Throughout the week, energy of price moves was large, and with the directional bias clearly tilted downward, market environment allowed for sizable price ranges.
5-day ADR1080pipshighlights, creating an exceptionally large profit opportunity in day trading due to favorable volatility.
2. Supply/Demand & Investment Factors
- Fluctuations in U.S. Treasury yields and the dollar trend acted as headwinds for gold, pressing prices lower.
- Stops and profit-taking by longs in high-price zones were triggered in sequence, sharply shifting the supply-demand balance downward.
- A large shift of short-term speculative funds toward selling became the main driver speeding up the decline trend.
3. Investment Trends
- In gold ETFs and futures markets, rapid price swings led short-term traders to close positions and build trend-following sell positions.
- Backdrop of 1080pips ADR drew market participants to breakout methods and trend-following day-trading strategies.
- As contrarian buying dried up, a highly advantageous trend-following short strategy demonstrated strong edge.
4. Overall Evaluation
This week's GOLD market was“from a small back-and-forth to a powerful downward trend, recording overwhelming volatility”.
In noisy conditions with unclear direction, use filters to avoid unnecessary entries and aim to profit when the main downward wave is in effect.
⑤ SILVER / COPPER Market
SILVER
SILVER market: Silver mirrored GOLD’s sharp decline trend, with strong selling pressure across precious metals pulling down prices.
COPPER
COPPER market: Copper faced global economic trends and a firming dollar, continuing a narrow range with heavy topside pressure as it searched for direction.
② GOLD STREAM v2 Weekly Trade Verification
Weekly Verification Results
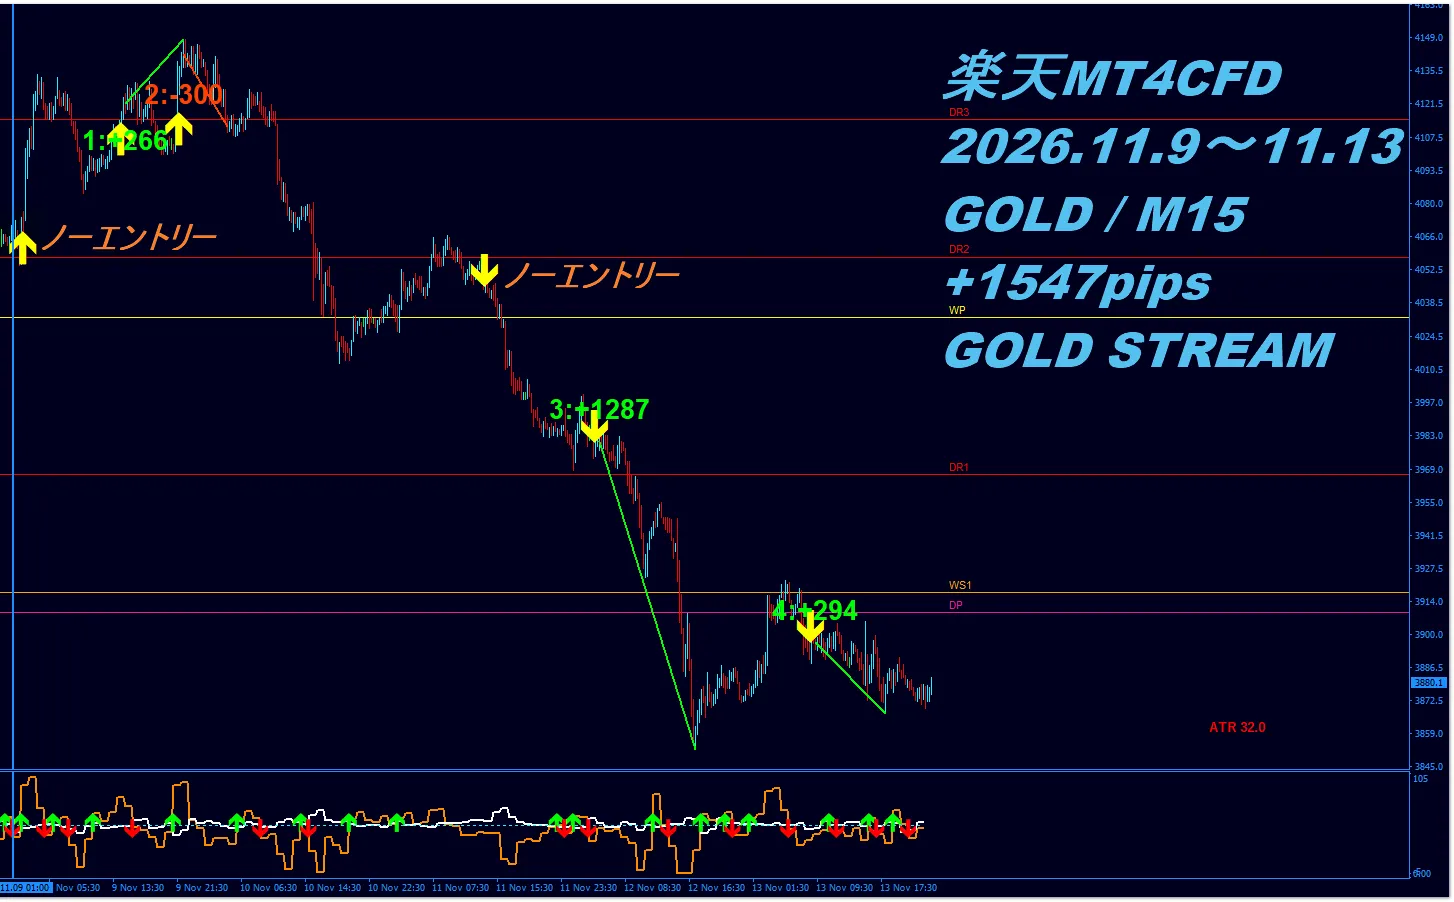
③ GOLD STREAM v2 Delivery History
Weekly Signal Delivery History

④ Weekly Verification AI Evaluation
This time5-day ADR 1080pipsprovides an exceptionally high-volatility environment; we thoroughly evaluate entry signal accuracy (two no-entry signals due to correlation disagreement) and trading performance based on a verification panel and chart figures.
■ Signal Judgement and Entry Accuracy
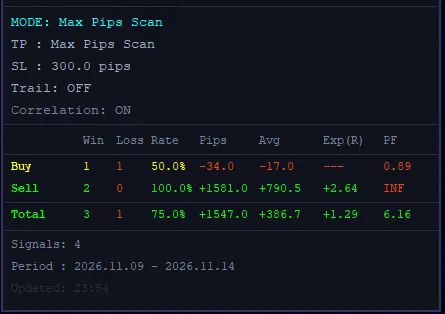
The verification panel (2026.11.09 - 2026.11.14) recorded 4 valid signals in total (2 Buy, 2 Sell), yielding3 wins, 1 loss; win rate 75.0%.
Breakdown: Buy 1-1 (-34.0pips), Sell 2-0 (+1581.0pips); total pips gained+1547.0pips (average +386.7pips) [cite: 45]. Sell signals captured large downward waves of +1287pips and +294pips, yielding substantial profit width.
Also, as clearly noted on the chart, the no-entry signals due to correlation disagreement were accurate2 times, preventing unnecessary entries in noisy periods.
■ Performance Metrics: Win Rate, PF, Exp(R)
This week's results showWin rate 75.0% · PF 6.16 · Exp(R) +1.29Rindicating a remarkably high level of edge.
Profit Factor (PF) reached6.16due to strictly controlled loss via fixed SL on losing trades and substantial +1581pips return on winning Sell trades, illustrating ideal small-loss big-gain structure.
Also, the expectancyExp(R)+1.29Rdemonstrates system robustness with an average return of 1.29 times the risk per unit.
■ Strength/Correlation Analysis Evaluation
In a challenging correlation environment with mixed directions early to mid-week, the strength and correlation analysis filter (Correlation: ON) functioned effectively.
In moments of hesitation, two mismatch signals were properly omitted2 times, preventing unnecessary stop-outs and laying the foundation for a total +1547pips win. This reflects the high accuracy of risk management features.
■ MAX Pips Scan & SL
This chart usesMODE: Max Pips Scan / Correlation: ON. [cite: 45]
The displayed pips are the MAX value when the price moves after signal generation to full hold. Therefore, +1547pips does not guarantee actual realized profit [cite: 45].
Also, SL decisions are based onthe 4-hour chart; decisions cannot be made solely from short-term moves on the M15 chart.
■ GOLD Market Difficulty
★★★★☆ 4 / 5
With a large price range of 1080pips ADR and high volatility, this market posed significant difficulty due to risk of large reversals if trend turns were misread.
■ GOLD STREAM Weekly Trade Verification Evaluation
★★★★★ 5 / 5
In a high-volatility environment, accurately passing two no-entry signals due to correlation disagreement,Win rate 75.0% · PF 6.16 · +1547.0pips gained, delivering exceptionally strong results.
■ AI Overall Commentary
This week's verification results highlight GOLD STREAM v2’s true value in correlation filtering and trend capture. By skipping unnecessary entries in uncertain directions and riding the downtrend, it achieved substantial profits exceeding 1,500pips.
For those who want to trade with an objective system-based basis rather than emotions, this tool is a superb partner for day trading.
With GOLD STREAM v2’s strong risk management and outstanding performance, elevate your trading results to the next level.
Verification Numerical Evidence
Would you like to jump on the initial move of a爆益 trend?
Don’t miss entry opportunities anymore
“I don’t have time to stay glued to the chart, so I miss chances”
“I’m not confident where to enter on a trend-following strategy”
“I want to trade based on market strength, weakness, and correlations”
With GOLD STREAM v2,
two-stage smart alerts prepare you in advance, and AI WAVE (sold separately) provides high-precision scoring
and correlation alignment confirmation, enabling confident trend-following entries.
Obtain objective decision criteria, not relying on intuition,
and move GOLD day trading to a superior level.
GOLD STREAM Related Articles
If you want to learn more about trading perspectives and GOLD trading, check here.
- 【Video】Performance in the last 3 months | GOLD STREAM signals after price movements 2026 July–September
- 【Video】October all signal verifications | GOLD STREAM price movements after signals 2026 Oct 1–Oct end
- The one reason your results aren’t showing
- Why trades end with “steadily and massively” outcomes
- 【Tool’s true performance revealed】GOLD STREAM dedicated win/loss analysis tool verification
- Conclusion: GOLD (XAU/USD) can be traded in domestic FX accounts.
Please choose according to your trading environment
『AI WAVE』 MT5 Version
Forecast alerts, arrow signals, and UI auto-coordinates, etc., fully loaded in the latest MT5 model with added features unique to MT5.
MT5 version details & purchase here『AI WAVE』 MT4 Version
A fundamental model with proven performance, featuring its own AI wave detection and expansion visualization logic; compatible with GOLD STREAM.
MT4 version details & purchase here※The shown verification values in images indicate the maximum reached value after the signal, not a guaranteed future profit. Final investment decisions are yours.
“Can I combine AI WAVE with my own method?” For those wondering
“I want to test with my own indicators”
“I want to know in detail how to set up forecast alerts in MT5”
“Help me fix my habit of taking quick profits”
All questions and consultations are welcome.
The developer will respond directly via direct message!
Ask a question via direct messageAI WAVE Related Articles
- I’ll teach you the one sure way to improve your trading
- AI Wave TP displayable by AI WAVE MT5
- 【Waves precede price moves】GOLD STREAM × AI WAVE
- Prices seek orders: a trader’s common sense
- AI WAVE【how far it can extend】will transform trading
- “Make exits visible” with “AI × FIBO Expansion”
- “No sense needed” — the rule for winners who only look at AI scores and follow golden ratio
- “How far can it extend?” Trade thinking by reverse-calculating from target ranges
The verification results and figures presented in this article are references based on historical market data and do not guarantee future profits or identical results.
The pips and P/L data shown are based on the maximum movement (MAX value) reached after the entry signal and calculated using fixed stop loss (SL). These indicate the MAX value of price movement if held fully after signal, not actual realized profit or execution results.
Actual profit and loss depend on entry/exit timing, spreads, slippage, trading fees, execution environment, position size, take-profit/stop-loss judgments, and market conditions. SL judgments are based on the 4-hour chart and may vary with actual trading conditions.
Additionally, differences in trading conditions and price delivery across brokers/exchanges/ platforms may cause actual prices, pips, P/L, and execution results to differ. Therefore, there may be discrepancies between published data and actual performance.
This data serves as reference material to verify the edge and market analysis accuracy of GOLD STREAM v2 and AI WAVE signals. Final investment decisions should be made based on your own financial situation, risk tolerance, and trading environment.