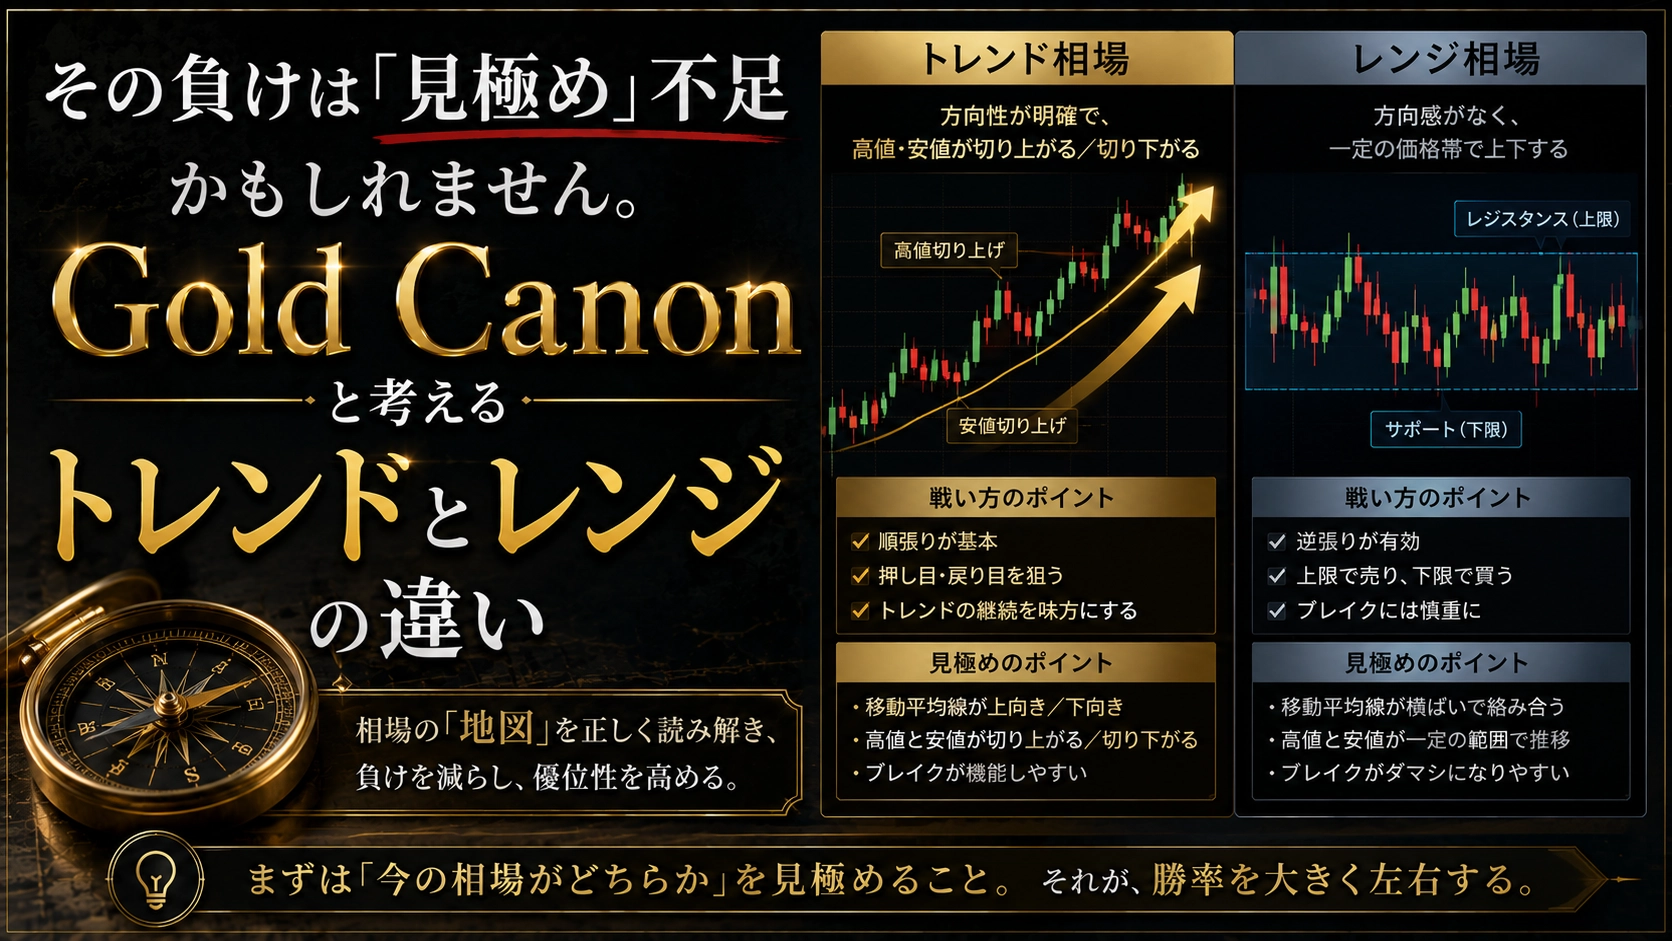

For those who keep losing with GOLD's dollar-cost averaging — three checks not to buy during a decline
In a 5-minute chart, the price drifts downward steadily.
It looks like a good dip, so you buy as usual.
But it doesn’t bounce back and continues to move lower.
You buy again at the next dip as well.
There, you also lose, and before you know it, the same loss has occurred three times in a row.
If you trade GOLD with discretion, you might have weeks like this.
First, the conclusion in advance.
The losses aren’t because you bought at a bad time.
It’s because you kept buying without confirming the direction of the higher time frame.
In this article, I will整理 three reasons why dip buying keeps failing.
Then I will introduce three checks to avoid buying during a downtrend.
You’re not the only one who lost on a dip
I too have incurred losses from information products and repaint signals.
With signals that change later, you can’t tell where the dip was.
So I began creating “signs that don’t change later” for myself.
This article reflects the thinking I整理 in that process.
Three reasons dip buying keeps losing
① Defining the dip only by the 5-minute chart
A dip is a momentary pullback within a uptrend.
So a dip assumes an ongoing uptrend.
However, when you only look at the 5-minute chart, every down move looks like a dip.
If the higher time frame is pointing down, that down move is not a dip but part of a downtrend.
② The premise that “GOLD will go up” makes it hard to pass
People who have seen long rallies tend to have a buying bias.
People tend to collect information that agrees with their own beliefs.
This is a cognitive bias called “confirmation bias.”
If the urge to buy is ahead, downward signals are harder to notice.
As a result, you find reasons to buy even when you should pass.
③ Trying to regain losses by moving in the same direction
After the first loss, you think, “I’ll make it back at the next dip.”
If the higher time frame remains bearish, the second loss is likely for the same reason.
Thus, losses pile up rather than stop at one.
Three checks to avoid buying in the middle of a downtrend
① Before entering, write down the directions of the daily, 4-hour, and 1-hour charts
Before entering, write the directions of the three timeframes in one line.
A sufficient format is, for example, “Daily: Up, 4H: Up, 1H: Down.”
Writing it down helps you notice discrepancies that you wouldn’t see on the 5-minute alone.
② On days when directions aren’t aligned, designate it a “pass day”
Only when all three directions align do I look for dips.
On days when they don’t align, I won’t enter the chart at all.
Even the days you pass are days you followed the rule.
In the record, write “pass” and close it.
③ If you lose twice in the same direction, recheck the higher time frame
If you lose twice in a row in the same direction, stop before the third attempt.
Once more, confirm the directions of the daily and 4-hour charts.
Rather than trying to make back losses, first confirm that the premise hasn’t changed.
This single rule helps prevent accumulation of losses.
Reference material: In the Gold Canon case
I’ll introduce an example that embodies “enter only when the higher-time-frame directions align.” This is our Gold Canon.
In simple terms, it’s a GOLD signal that doesn’t change later, made semi-automatic with one button.
A set of signals for XAUUSD on MT5 with 5-minute charts, plus a buyer’s EA as a bonus.
- Two buys (TRI, H4) and one sell (SELL) engine
- TRI buys on dips only when all three timeframes are rising
- SELL sells on retracements only when three timeframes are falling and the daily is below the EMA200
- Stop loss and trailing stop are broker-side. On Fridays, all positions are closed before NY close
- Arrows do not repaint. You can choose which days to run via RUN ON/OFF
When the higher time-frame directions don’t align, trading stops.
Instead of continuing to buy during a down move, wait until conditions align.
Sell is designed for use in a long downtrend as a defensive measure.
Testing including down years and weak points
We tested with data from another broker (OANDA) from 2006 to May 2020.
That includes the year 2013 when gold fell about 30% in a year.
With 1% risk per engine, all 15 years were profitable.
In 2013, it was +16.6%, PF 1.49, max DD 15.3%.
Weak points are also disclosed in advance.
We also tested in MT5 from 2019 to October 2026.
In this test, 2019 was almost flat. The same 1% risk condition applies.
Note: All are simulation (backtest) results.
In actual trading, results may differ due to slippage and wider spreads.
Answers to common questions in advance
Q. Do the signals disappear or move after they are issued?
A. They are non-repainting with confirmed signals. Past arrows show signals that existed at that time.
Q. How much capital is needed?
A. For 0.01 lot, with the standard 3 engines, recommended capital is at least 2 million yen.
The maximum drawdown under the same conditions was about 700,000 yen.
If using TRI and SELL together, recommended capital is at least 1 million yen.
※ Reference value for 0.01 lot: backtest from Jan 2025 to Oct 2026, USD/JPY 158, including spreads and costs. If needed, consider accounts with smaller contract sizes.
Q. Is averaging down (närping) dangerous?
A. In the buying engine, adding the same lot is limited to a maximum of 2 times.
With 0.01 lot, the maximum lot per basket is 0.03.
Stop losses are placed with the broker.
Q. How about stopping when necessary?
A. If you turn RUN OFF, no new orders will be entered.
You decide when to stop, e.g., before significant events or busy days.
Q. Can I try it with my own broker?
A. There is a 3-day free trial (signal indicator).
On your MT5, you can verify how the arrows appear.
In 3 days, new signals may not appear.
The EA is a purchaser’s perk for the product version and is aimed at hedged accounts.
Who this is not suited for
- People looking for a tool that guarantees no losses
- People who want to use large lots without preparing recommended capital
- People who want to use the EA on a netting account (manual signals permissible)
For those who want to keep discretionary trading while simplifying lot calculations and staged exits.
There is also MT5 panel “Trade Pilot Pro.”https://www.gogojungle.co.jp/tools/indicators/85576
Summary
The three reasons losses occur with dip buying are as follows.
- Defining the dip only with the 5-minute chart
- The premise that “GOLD will go up” makes passing difficult
- Trying to regain losses by moving in the same direction
The checks you should perform are writing down the three time-frame directions.
If they don’t align, designate a pass day.
And if you lose in the same direction twice, recheck the higher time frame.
Finally: Why I created this tool
What I wanted was a tool to reduce the time I spent wondering, “Is this a dip?” every time.
A signal that doesn’t change later and execution that excludes emotion.
And a rule that allows waiting when directions don’t align.
I couldn’t find it, so I made it for myself. That is Gold Canon.
I don’t intend to cherry-pick only good results.
First, try it on your own chart for three days before deciding.
▶ Three-day free trial:https://www.gogojungle.co.jp/tools/indicators/84465
Past performance does not guarantee future profits. Please make investment decisions at your own risk.