

How many consecutive losses for EA are considered within expectations? The line I set before moving, and the way I set it [Series "FX Holy Grail Institute's Promise" Part 1]
I am the director of FX Holy Grail Research Institute. I am a 50-year-old systems engineer and I am keeping a record of testing and breaking automated trading methods that look like they could win, using past data.
Starting today, I begin the series “Promises of the FX Holy Grail Research Institute.” I am verifying 100 candidate trading rules for EA (a program that automatically conducts FX trading) using historical movement of USD/JPY. Before that, I decided to define a line that separates pass and fail, document it, and not rewrite it later. In this series, I will explain that promise one by one in eight installments.
The price movement used is the hourly chart of USD/JPY (each hour’s movement consolidated into one bar).
The first installment is the line of consecutive losses.
About the numbers in this article:16 times, 1%, 1000 times, the top 5% and the 25%/4%/2x that appear in the series schedule are lines I decided before looking at the results, not performance. The numbers in Figure 2 and Table 1 are calculation examples for explanation. The results of my verification are not written in this article.
Conclusion
- My line is “up to 16 consecutive losses at most.”The assumed maximum consecutive losses is the larger of: (a) the actual longest losing streak, and (b) the 5% percentile of losing streaks when the order of trades is shuffled 1,000 times. Trades with a net loss of 0 yen or less count as losses.
- This 16 is paired with the condition “in a single trade, the amount lost before stop loss equals 1% of the balance.”This line is my own candidate criterion and not yours. If the percentage lost in one trade differs, the same 16 consecutive losses can correspond to different capital drawdowns.
- The 16 was decided beforehand using artificially generated movements with no chance of success.This is to prevent a weak method from accidentally passing all seven gates (criteria to discard candidates) just by chance.
How to count losses
A losing streak means a series of losing trades.
In my counting method, trades with a net loss of 0 or less are counted as losses. Exactly 0 yen is also a loss. If, after deducting trading costs, the result is 0 yen, that trade did not increase the capital.
With this counting method, the longest actual losing streak in the real sequence of trades is called the “actual maximum losing streak.”
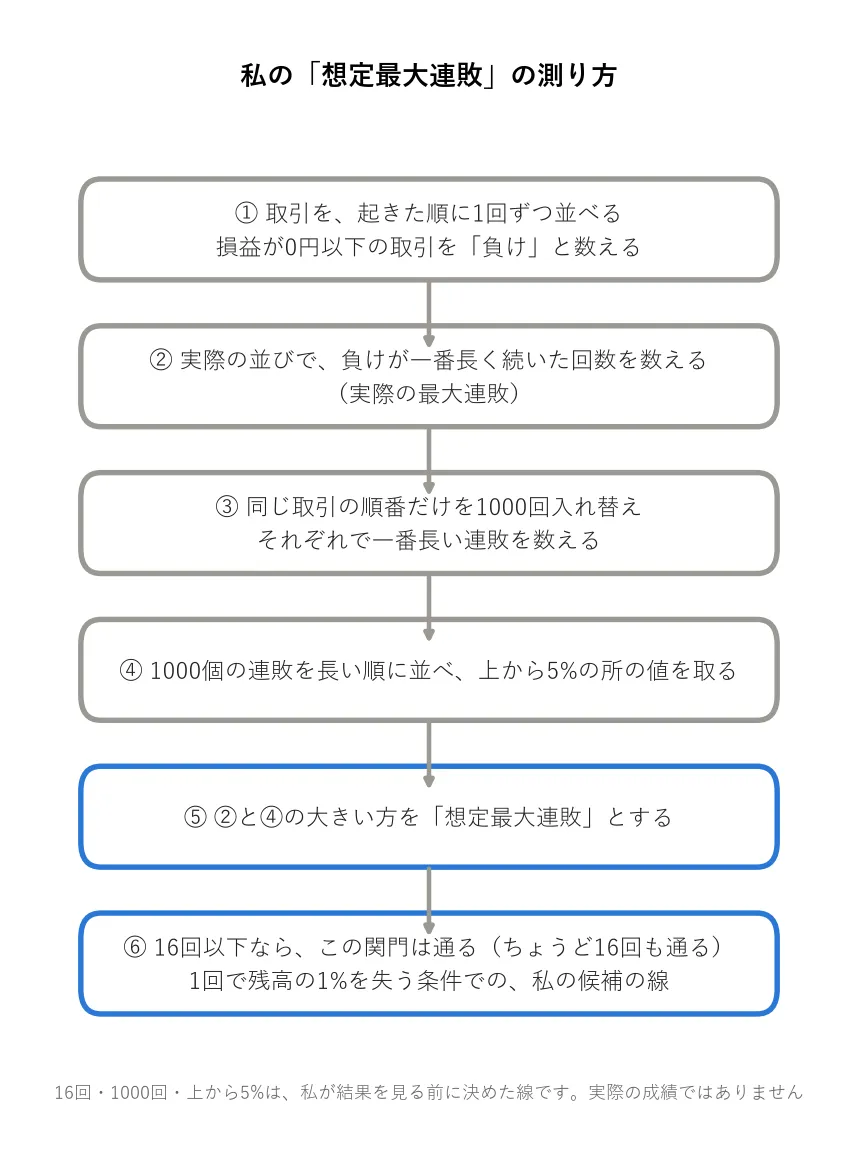
Figures ①–⑤ indicate the measurement method, and ⑥ is my line.
Why reorder the sequence
The sequence of trades tested on historical data is just one occurrence by chance. Even with the same number of wins and losses, changing the order can change the length of losing streaks.
Therefore, I will shuffle the order 1,000 times while keeping the trade content the same. Each time I shuffle, I count the longest losing streak. I arrange the 1,000 losing streaks in descending order and take the value at the top 5%, i.e., the 50th longest value from the top.
Calculation example: a synthetic sequence of 200 trades with 80 wins and 120 losses.
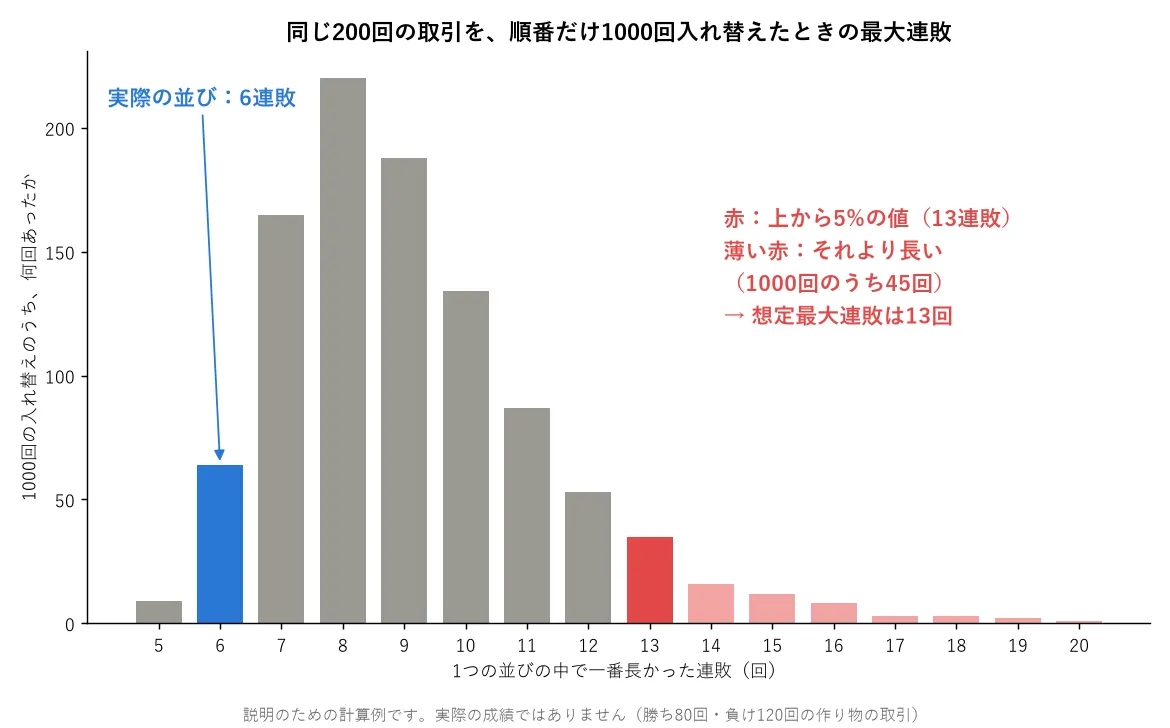
Condition: a synthetic sequence with 80 wins and 120 losses. 1,000 shuffles. This is an explanation calculation example and not actual performance.
In the actual sequence, the longest losing streak was 6. However, when the order was shuffled, there were 927 out of 1,000 sequences that produced a losing streak longer than 6. The top 5% value is 13.
Therefore, the assumed maximum losing streak for this trade is counted as 13 rather than 6. Looking only at 6 would lead to assuming the method’s losing streak length because losses were scattered by chance.
Since 13 is less than or equal to 16, this example’s trade passes the losing-streak gate. However, this is only one of seven gates.
16 and the line set with 1% per loss
Taking the number 16 alone has no meaning. The weight of 16 losses changes depending on how much capital is lost with each single loss.
My candidate uses 1% of the balance lost per trade before stop loss. Stop loss is the rule to end the trade when the loss reaches the predetermined amount.
The calculation example compares the balance after 16 consecutive losses starting from 1,000,000 yen.
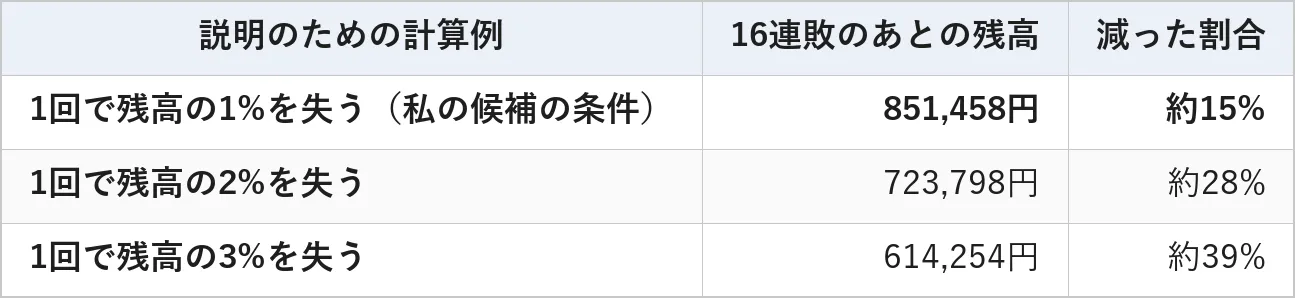
Condition: initial funds 1,000,000 yen. Each single loss reduces the balance by a fixed percentage. Truncation of fractional trade amounts, trading costs, and price gaps at the start of the week that cause losses larger than stop loss are not included. This is a calculation example for explanation.
If loss per trade is 1%, after 16 consecutive losses the balance is 851,458 yen, about a 15% decrease. The same 16 losses with 2% per trade reduce the balance about 28%, and with 3% per trade about 39%.
Therefore, my 16 is the line determined by my candidate’s conditions.It is not your EA’s line.The percentage lost per trade and the method of counting losses differ by EA. This article does not determine your EA’s line.
How to determine 16
What I most wanted to avoid when deciding the line was moving the line after seeing the results. If my preferred candidate had 17 consecutive losses, I might think, “Would 17 be okay?”
Therefore, I decided 16 in advance using a different criterion before moving any of my 100 candidates in USD/JPY.
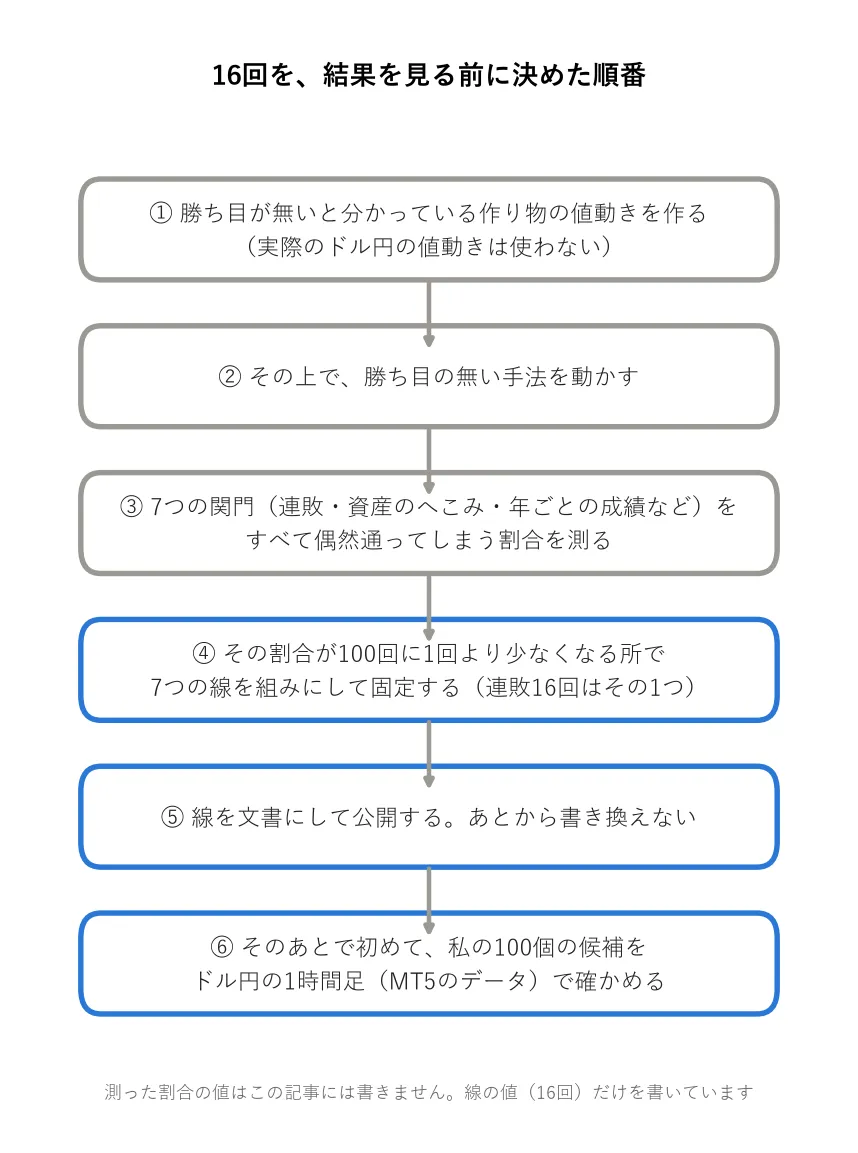
I used artificial price movements where there is no chance of profit. Even then, moving the None of these seven gates can be passed entirely by chance. It’s just random.
I fixed seven lines including the 16-loss line when their chance of passing fell below 1 in 100. This was done to form a fixed set.
The measured percentage values are not written in this article. Only the fixed line values are written.
Exactly 16 is a pass. 17 is a fail. If you don’t decide the threshold in advance, you’ll be indecisive at the exact point.
Three things to align before comparing loss numbers
Loss counts cannot be compared across different conditions. The three conditions I always write together with my line when I create it are:
- What percentage of capital is lost in one loss:1% vs 3% yields different drawdowns for the same number of losses
- What is counted as a loss:Whether trades that exactly break even (0 yen) are counted as losses or not
- Real sequence only, or reorderings as well:The real sequence is just one occurrence by chance
Whenever you see a losing-number somewhere, if you do not understand these three, I will not read that number with the same yardstick as my 16 losses.
What this series will cover
The series “Promises of the FX Holy Grail Research Institute” consists of eight parts. Each part is a promise I set before looking at results to apply to my own candidates.
- How many losses are considered within the expected range (this time)
- Why I write the stopping line before moving it
- Why I discard any candidate with even one year of losses
- Why I don’t sell if the pass is 0
- Why I cap the maximum drawdown to 25%
- Why I limit losses to 4% when prices jump at week start
- Why I check whether doubling the trading costs would break the line
- Why I fixed constraints in advance so they cannot be changed later
Next time, the reason for writing the line to stop EA before moving it.
In conclusion
In today’s calculation example, a sequence that actually had 6 consecutive losses over 200 trades became 13 consecutive losses in the top 5% when the order was shuffled. And even with the same 16 consecutive losses, if the amount lost per trade is 1%, the decrease was about 15%; if it’s 3%, about 39%.
The figures and tables in this article are generated with AI, and the numbers in the calculation examples are verified by programming.
I will not promise a method that guarantees profits. Still, I believe there is a Holy Grail worth pursuing. The Holy Grail I refer to is a trading rule that does not crumble even after including trading costs or in periods not yet observed.
If you can read the loss count together with the shuffled order as one measure, you can avoid believing a method that merely appears to have short losing streaks as a neat number. For each fake removed, you move one step closer to the Holy Grail.
Glossary
- EA: A program that automatically conducts FX trading
- Candidate: The trading rules I am testing. I prepared 100
- Gate: The criteria to discard a candidate. If any one is not met, it fails
- Consecutive losses: A sequence of losing trades. I count trades with a net loss of 0 yen or less as losses
- Actual maximum consecutive losses: The longest losing streak in the actual sequence of trades
- Assumed maximum consecutive losses: The larger of the actual maximum consecutive losses and the 5% percentile of maximum losses after shuffling the order 1,000 times
- Stop loss: The rule to end a trade when the loss reaches the predetermined amount
- Trading costs: Money incurred per trade. The spread between bid and ask and fees
- 1-hour chart: The price movement consolidated into one bar per hour
- MT5: Software to trade FX. EAs run on top of this
Note: This article is not investment advice. The lines 16, 1%, 1000 times, top 5%, 25%, 4%, and 2x are lines decided before looking at results, and the numbers in Figure 2 and Table 1 are calculation examples for explanation.