
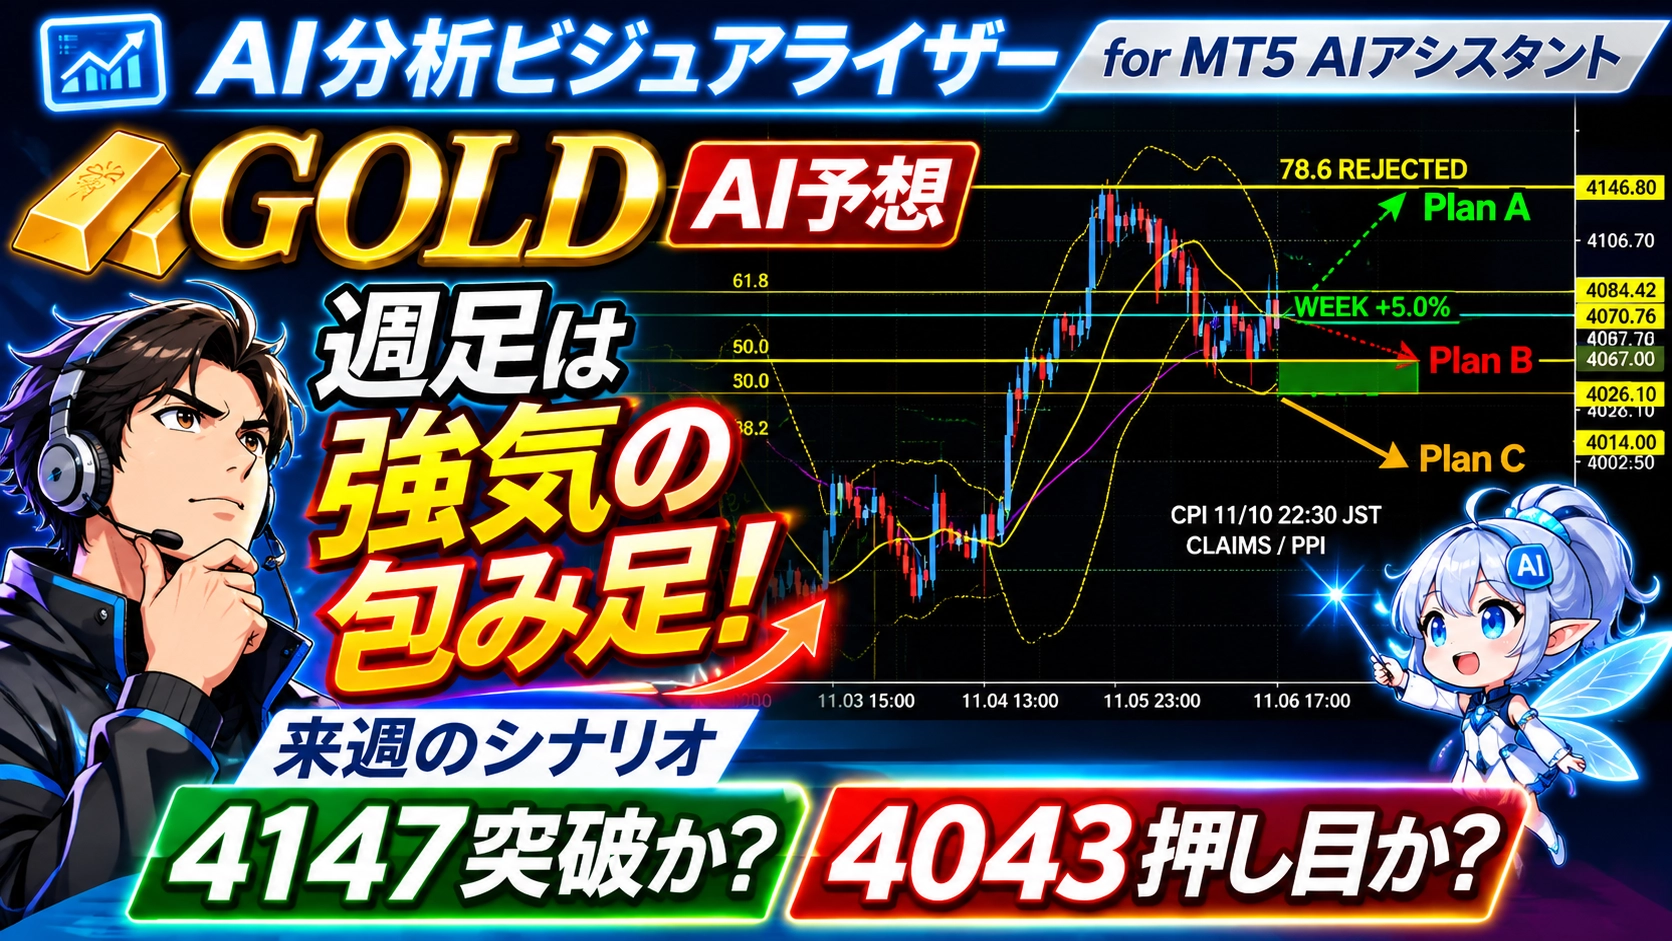
GOLD (Gold) AI Market Outlook|The weekly chart shows a bullish engulfing pattern; next week, is dip-buying the main strategy?
?This article was posted on November 08, 2026=>Latest related articles?
※This article introduces the results visualized by MT5 AI Assistant's market analysis throughAI Analysis Visualizer. AI's analysis is based on chart data at specific points and does not guarantee future price or profits.

1. This Week's Gold Market: From Bearish to Bullish Turnaround
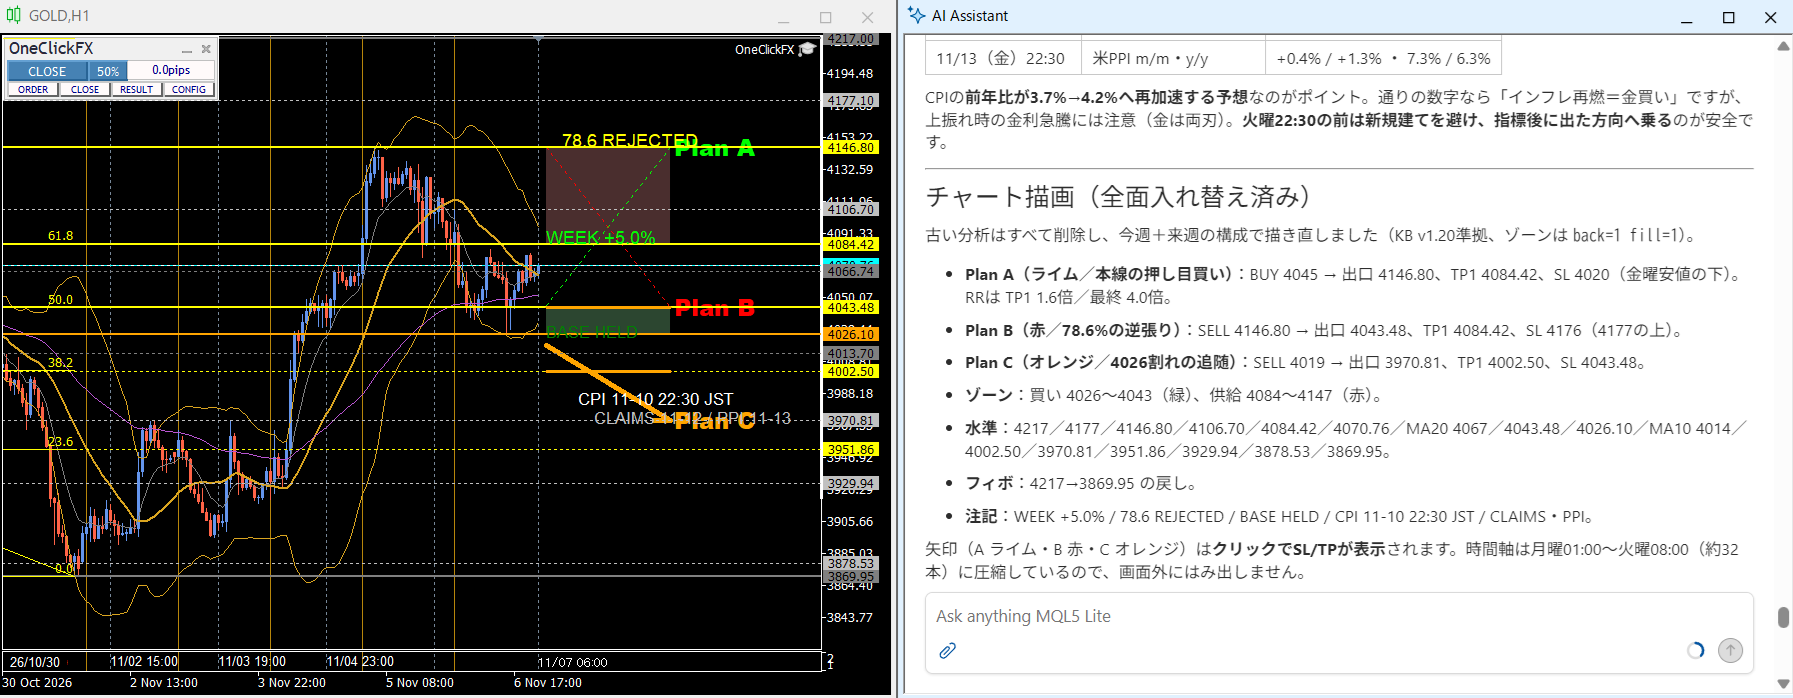
Gold from November 2nd to 6th showed a strong rebound.
Last week, we expected a breakdown from October's range with a downside target of 3733–3800 dollars, but following the U.S. election results, there was a rapid rally afterwards.
Key price movements this week are as follows.
- Week opening price: 3880.10 USD
- Week closing price: 4070.76 USD
- Week high: 4146.80 USD
- Week low: 3878.53 USD
- Rise from last week's close: 195.15 USD (about 5.04%)
Of particular note is the weekly chart pattern.
A strong reversal pattern where last week's bearish candle is fully engulfed by this week's bullish candle.
Weekly trading volume also rose to about 1.86 million, up 19.5% from last week's about 1.56 million.
Stocks fell while gold rose, accompanied by higher volume.
2. Notable Technical Points
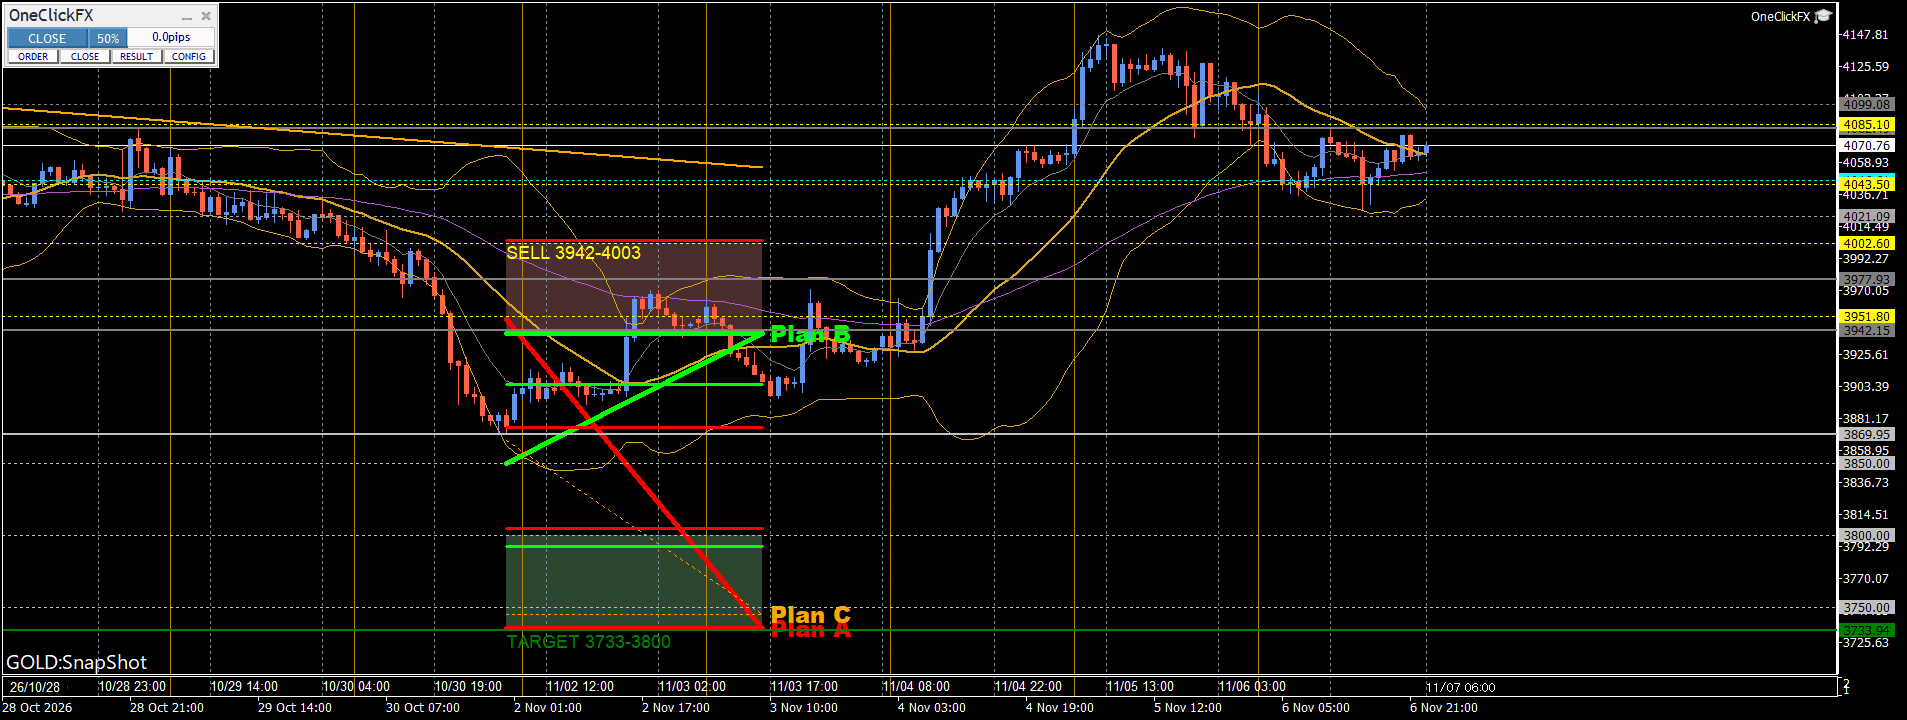
In this analysis, Fibonacci retracement levels and the recent high/low are important.
Resistance
- $4084: Fibonacci 61.8% retracement
- $4107: November 6 high
- $4147: Fibonacci 78.6% retracement; double-top candidate
- $4177: next upside target
- $4198: upside target
- $4217: October high
Of particular importance is $4147.
The high of $4146.80 on November 5 reached near the Fibonacci 78.6% retracement around $4142.72, before continuing to rise.
Furthermore, it is near the October 22 high of $4144.34, forming a potential double top.
Support
- $4043: Fibonacci 50% retracement
- $4026: October 30 high / current breakout level
- $4003: Fibonacci 38.2% retracement
- $3971: November 3 double-top level
- $3930: next downside target
In particular, $4026 is important.
The November 6 low of $4026.07 is almost exactly the same as the previous high of $4026.15.
A price level that briefly broke above now acts as support.
AI analysis views $4026 as a key level for continuing bullish momentum.
3. Next Week's Main Scenario: Buy Dips
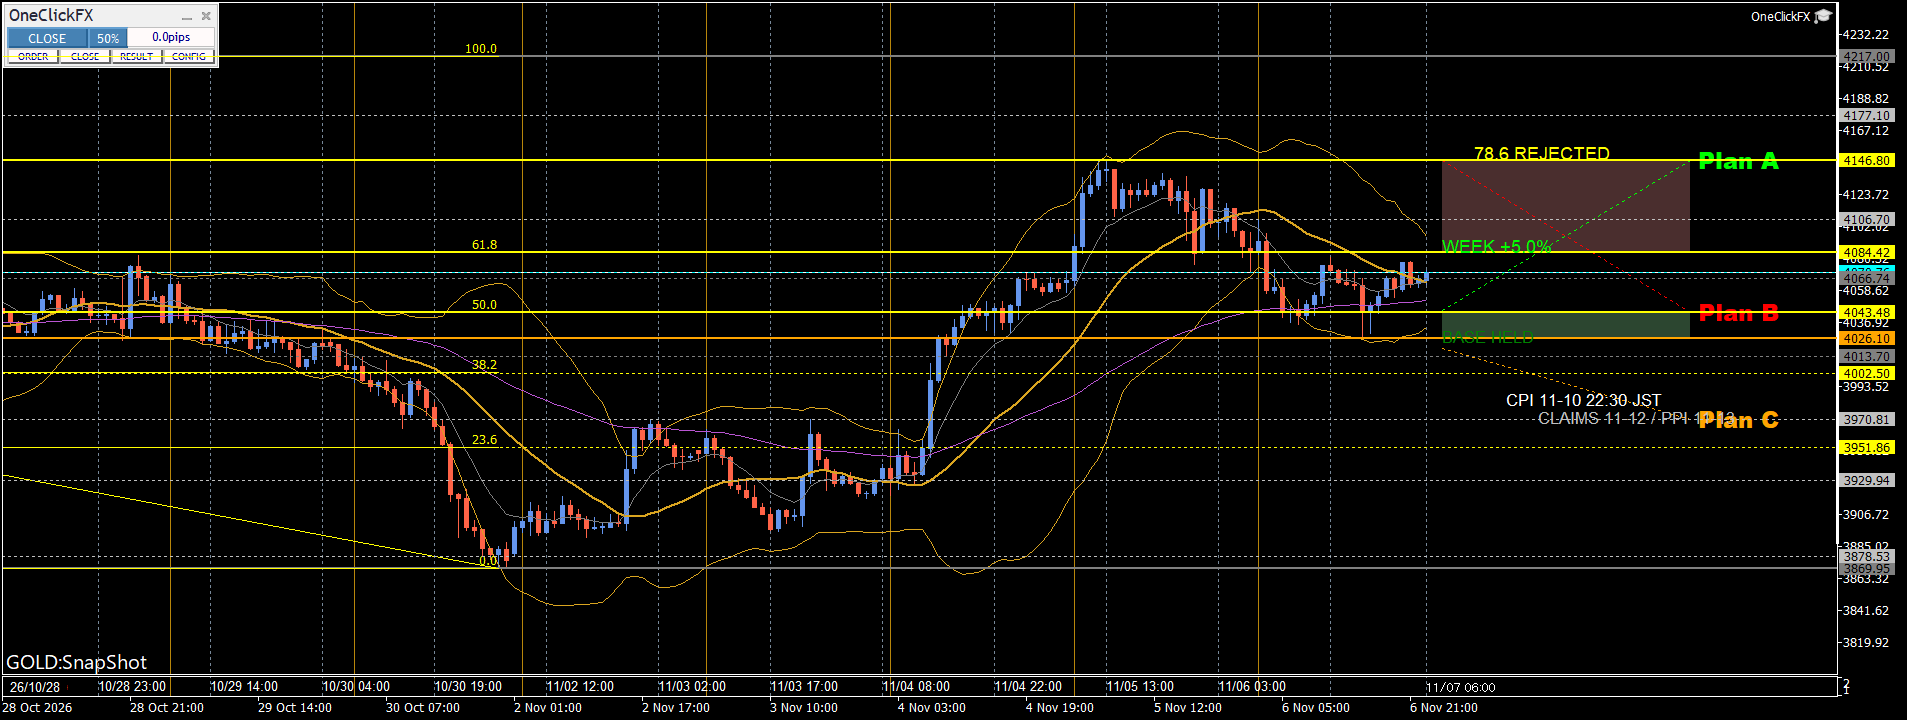
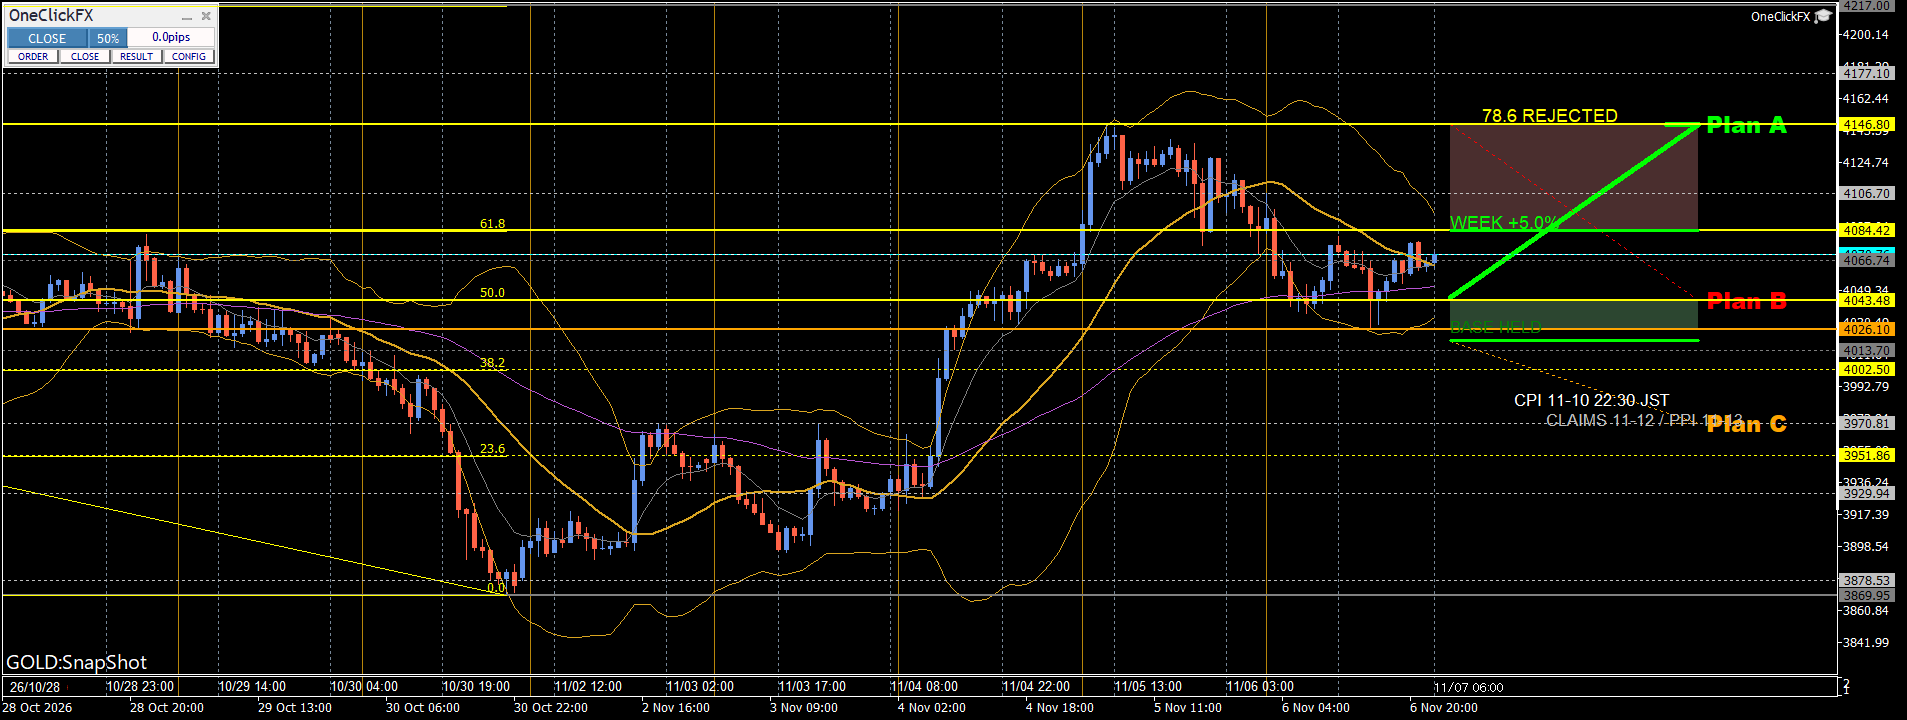
The baseline scenario for next week is to maintain an uptrend while forming a dip and testing higher levels again.
AI analysis estimates this scenario at about 55–60% probability.
Focal price flow is
$4043 → $4084 → $4147 → $4177 → $4217
.
First, around $4043 is the initial dip candidate.
If this level holds and rebounds, a test of $4084 and $4107 could occur, followed by a breakout of $4147.
If the close clearly breaks above $4147, the next targets are $4177, $4198, and the October high $4217.
On the other hand, if price stalls again at $4147, watch for the next decline scenario.
4. Sub-scenario: Decline from $4147
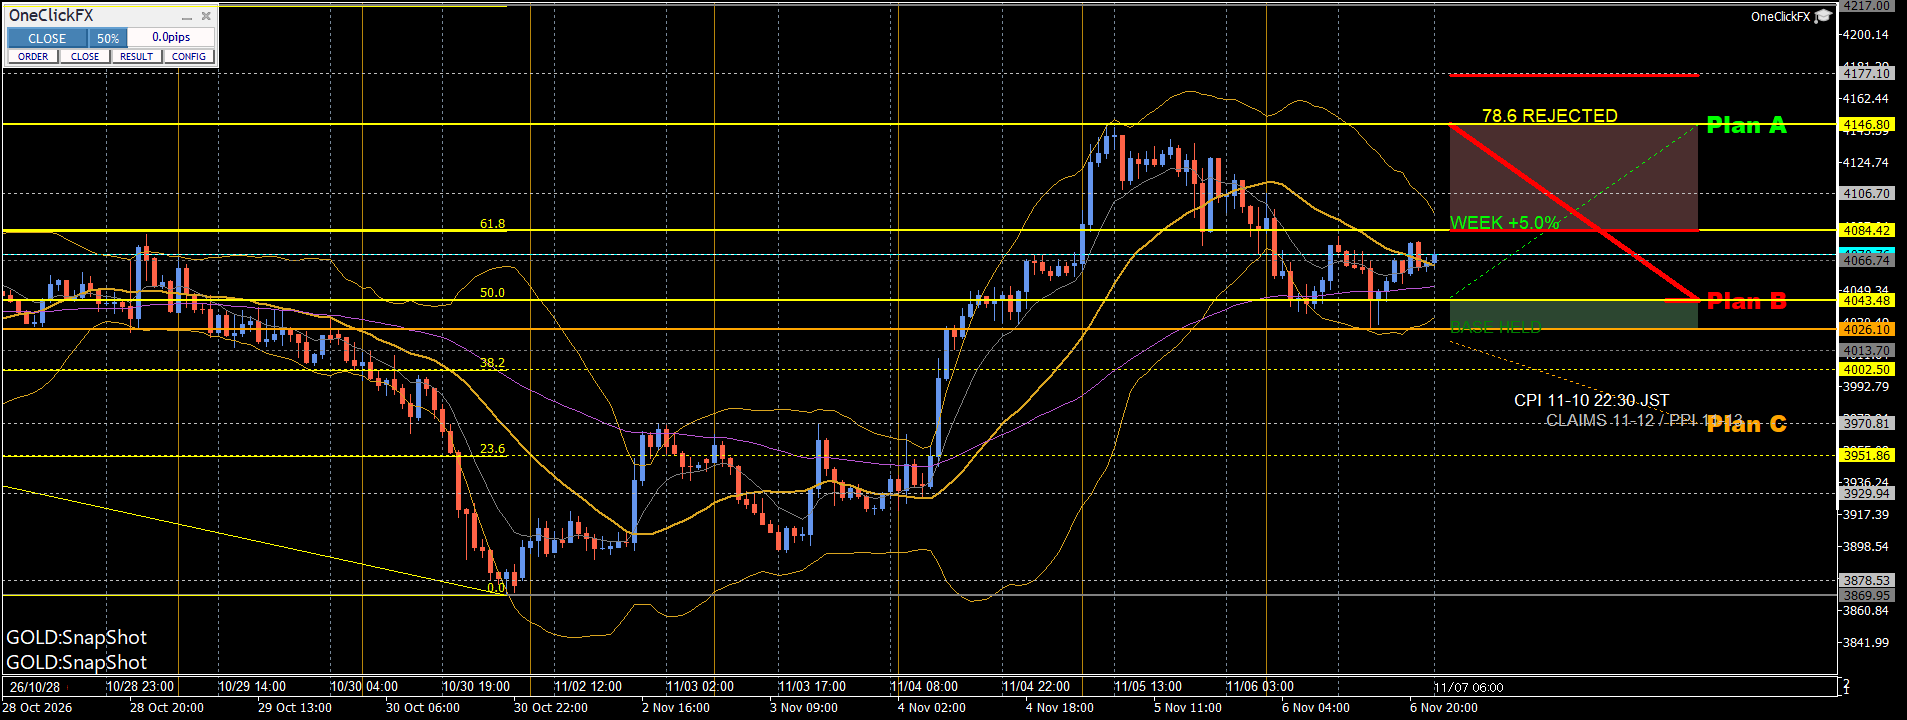
Another scenario is forming a double top near $4147 and then declining.
AI analysis estimates this around 40–45% probability.
Expected movement is
$4147 → $4043 → $4003
.
On Thursday, the move reversed around the 78.6% retracement, and on Friday the price fell with a stronger dollar.
This movement also signals resistance at higher levels.
If the price breaks below $4026 on a daily close, the bullish scenario would need to be reconsidered.
In that case, a further pullback to around $3971 is possible.
5. Important Economic Indicators for Next Week
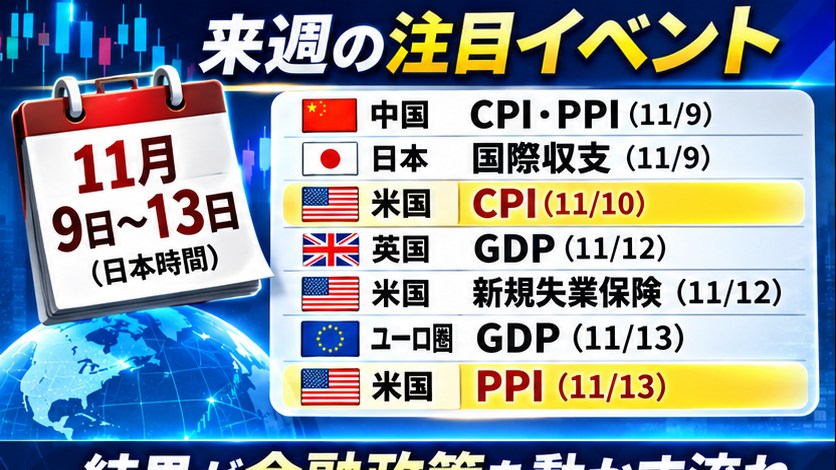
Next week, U.S. inflation-related indicators will be in focus.
November 10 (Tue) 22:30: U.S. CPI
- Previous: month-over-month +0.5% / year-over-year +3.7%
- Forecast: month-over-month +0.6% / year-over-year +4.2%
The point of attention is the expectation that year-over-year inflation accelerates from 3.7% to 4.2% again.
A renewed inflation surge could be a positive factor for gold, but if it leads to higher interest rates and a stronger dollar, it would be a headwind for gold prices.
November 12 (Thu) 22:30: Initial Jobless Claims
An important indicator confirming the U.S. employment situation.
November 13 (Fri) 22:30: U.S. PPI
- Previous: month-over-month +0.4% / year-over-year +7.3%
- Forecast: month-over-month +1.3% / year-over-year +6.3%
Results of CPI and PPI may alter market views on inflation and interest rates.
6. Next Week's Trading Plan
This chart sets up three trading scenarios.
? Plan A: Buy the dip at $4045 (main line)
- Entry: $4045
- Stop loss: $4020
- TP1: $4084.42
- Final settlement: $4146.80
- Risk-reward ratio: TP1 about 1.6x / final about 4.0x
This is the main scenario to wait for a dip before buying.
The key is whether the $4026–$4043 support zone holds.
? Plan B: Sell short at $4146.80
- Entry: $4146.80
- Stop loss: $4176
- TP1: $4084.42
- Final settlement: $4043.48
Seek a breakout stop and look for a decline near the 78.6% retracement.
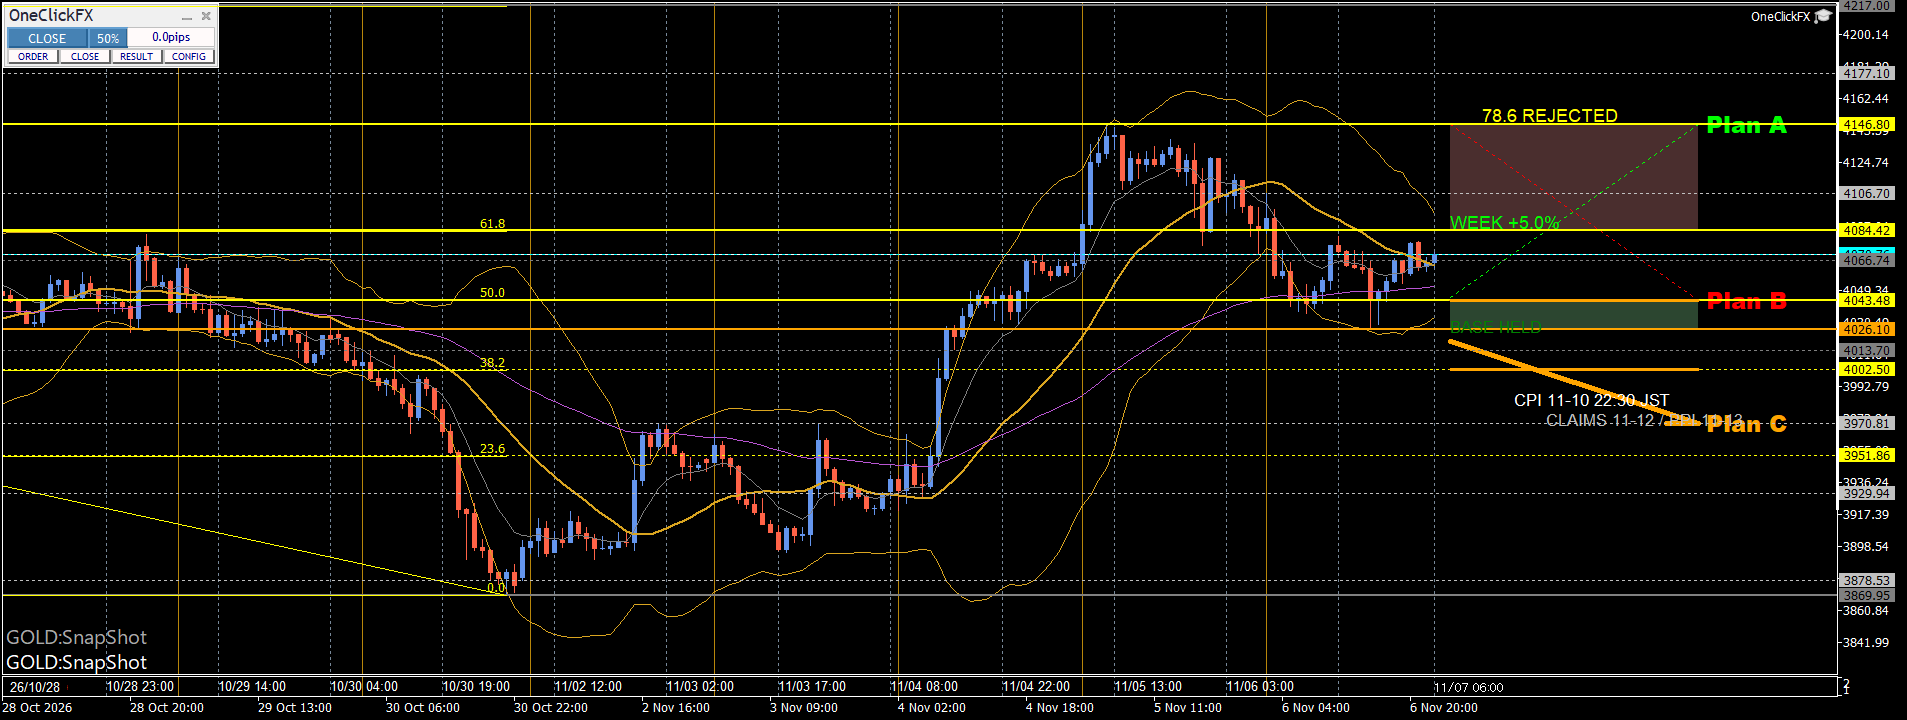
? Plan C: Sell on a break of $4026
- Entry: $4019
- Stop loss: $4043.48
- TP1: $4002.50
- Final settlement: $3970.81
This is a selling scenario if price breaks below the important support at $4026 for a bullish scenario.
7. This AI Forecast Summary: No Need to Force Participation
This analysis, following the strong weekly reversal, generally favors buying dips. However, there is clear upside resistance at $4147 and U.S. CPI is ahead.
After a sharp rise, there is no need to rush in. It may be prudent to wait and observe.
On the other hand, volatility is currently high, and substantial moves can occur in a short period. If conditions align, there will be trading opportunities.
The key is that high volatility does not mean you should participate unconditionally.
Decide whether to wait for a dip, target a pullback at resistance, or follow a breakdown at support, and judge only when the price reaches your pre-set conditions.
Having market opportunities and needing to hold a position now are not the same thing.
What to watch is whether the $4043–$4026 support holds and whether $4147 resistance can be broken.
Next week, including the U.S. CPI, we will monitor economic indicators and price responses to assess the next developments.

This analysis visualizes weekly reversals, key Fibonacci levels, and multiple trading scenarios on the chart.
Besides checking AI-driven market forecasts, the tool also allows you to compare actual price movements to which scenario they are progressing.
Formulating forecasts, waiting for conditions, and avoiding reckless trading are all important parts of market analysis.
※This article introduces market analysis and forecasts by AI analysis assistant and does not constitute investment advice or guaranteed profits. The price levels and trading scenarios shown are as of the analysis time and may change with market conditions. In actual trading, please verify the latest charts, prices, and spreads before deciding.