

Is there a “trend” in the gold daytime movement? Compare the real price action with the arranged “random” moves
Verification Notes|Counting Gold's “Common Sense” Series Part 1
“Gold tends to form trends,” “If you ride the trend, you’ll win.” These are common phrases often seen in explanations ofFX and commodities.
I am studying rules for short-term trading of gold. In doing so, I have been checking one by one, with past 1-minute data, whether these kinds of “common sense” actually show up in numbers. In this series, I will present the results together with charts.
The theme of Part 1 is“Is there a trend during gold trading hours?”.
First, a quiz: Which is real?
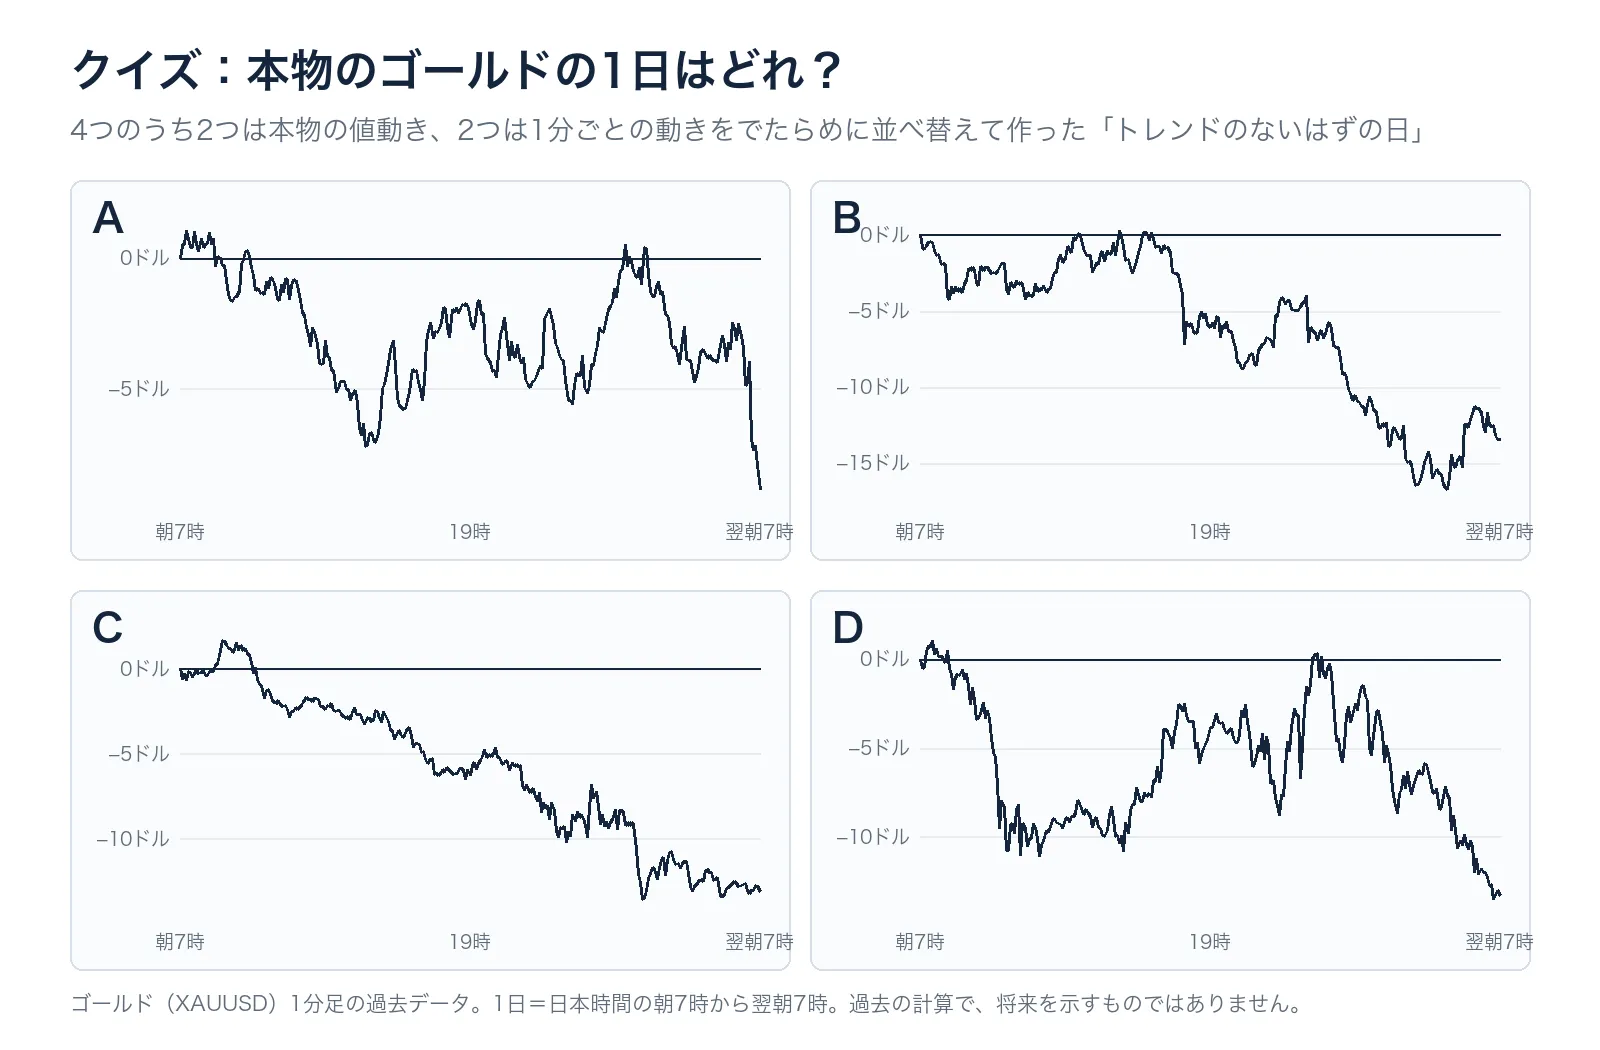
Two of the four are the actual price movements of one day of gold (from 7:00 AM Japan time to the next morning 7:00 AM). The other two are created by randomly rearranging the minute-by-minute ups and downs of a particular dayin order only.
The rearranged days have the same intraday ups and downs in size, the same open and close prices as that day. However, since the order is determined by drawing lots, the “flow” or “momentum” should be missing.
All four days end with a significant drop from the open. Which one is real? The answer is later in the article.
How to verify: compare the real day with the rearranged day
For gold from 2010 to 2019, I created 2,581 days, each day by randomly shuffling the 1-minute movements 200 times. Then I counted how many days wereone-direction days on the real day versus the rearranged day.
A one-direction day is when the movement from open to close (the body of the candlestick) accounts for at least seven-tenths of the day's high-to-low range. Days in which you feel a trend when looking at the chart usually have this shape.
If gold’s price movements have a tendency to continue once they start, there should be more one-direction days on real days than on rearranged days.
Result: One-direction days occur at the same rate as random days
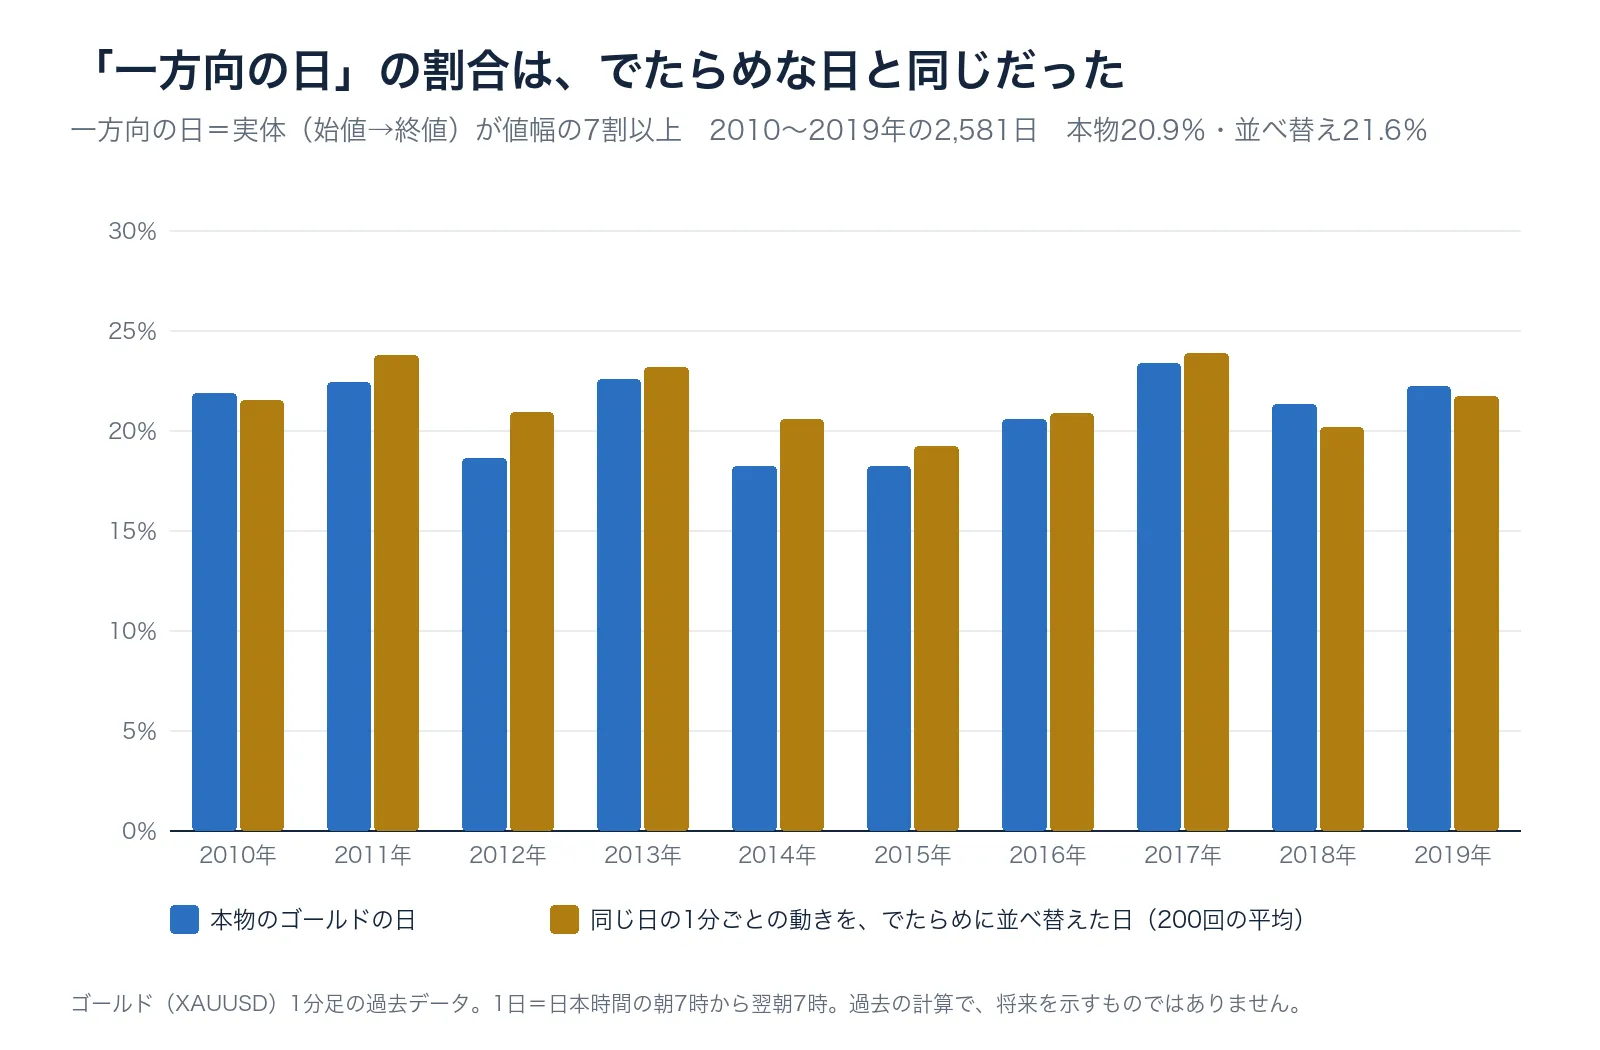
Among real days, one-direction days were20.9%, while among rearranged days they were21.6%. They are almost the same, with the real days even slightly fewer.
Even when broken down by year, the differences are within 2.4 percentage points for all years. The years with more one-direction days among real days were only 3 out of 10.
In other words,about one in five days shows a “trend day,” even when the price movements are random. When you look at the chart afterwards, you may clearly see a flow, but that “flow” cannot be distinguished from random price movements.
What you will understand going forward
- Answers to the quiz and clues to distinguish real days from rearranged days
- Comparison of the distribution of a day’s “straightness” (diagram)
- When looking at shorter time frames (5 minutes to 4 hours), is there a trend?
- Is this also true for gold after 2020 (up to September 2026)
- Results of verifying “trading with the flow in the middle”
- Three questions to ask when you see a method described as “capturing the trend”
You can read the continuation with a free access
You can read the continuation with a free access to this article. Those who sign up may receive notices useful for understanding gold price movements, including the next installment of this series.