
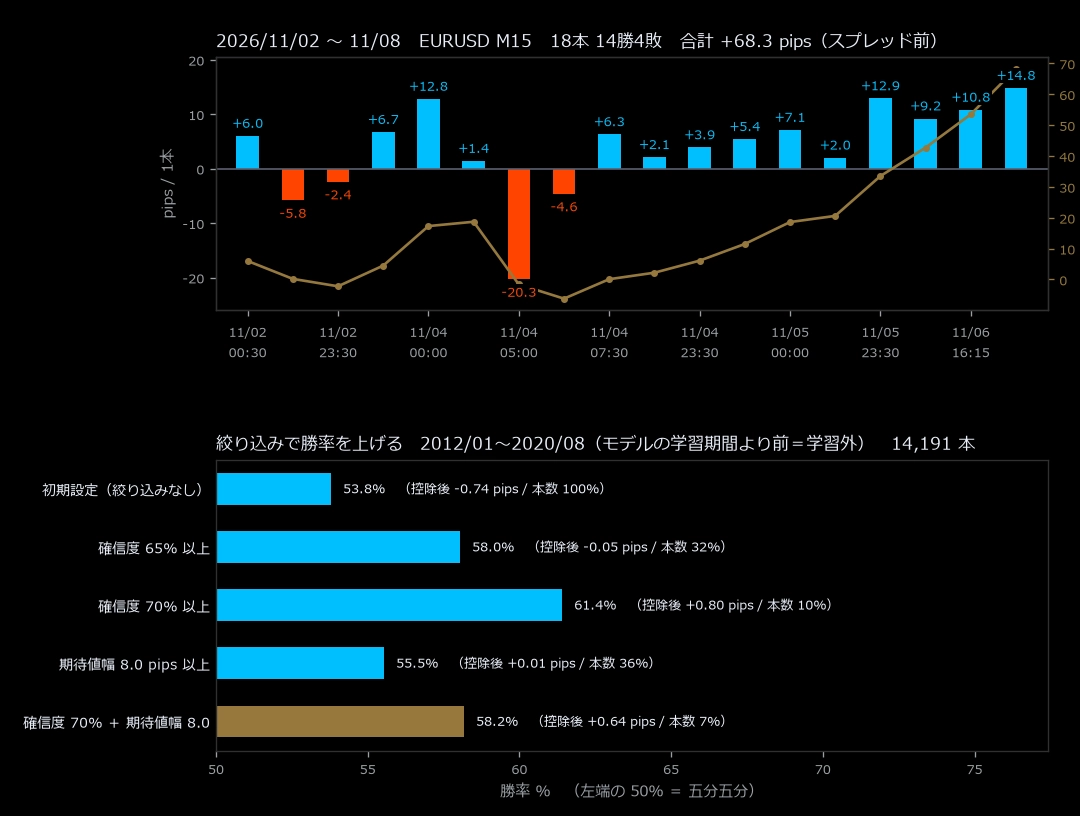
GS's AI Confidence Signal for 15M Weekly Report ~2026.11.7
GS' AI Confidence Signal for 15M
This Week's Summary
This Week's Signal Status
| Date/Time | Direction | Confidence | Expected Range | Entry | Exit | Result | Judgment |
|---|---|---|---|---|---|---|---|
| 11/02 00:30 | Buy | 62% | 5.0 | 1.11558 | 1.11618 | +6.0 | ○ |
| 11/02 23:15 | Buy | 67% | 5.6 | 1.11915 | 1.11857 | -5.8 | × |
| 11/02 23:30 | Buy | 66% | 5.3 | 1.11904 | 1.11880 | -2.4 | × |
| 11/03 00:00 | Buy | 74% | 7.1 | 1.11853 | 1.11920 | +6.7 | ○ |
| 11/04 00:00 | Buy | 75% | 5.4 | 1.11940 | 1.12068 | +12.8 | ○ |
| 11/04 04:30 | Buy | 59% | 6.0 | 1.12457 | 1.12471 | +1.4 | ○ |
| 11/04 05:00 | Buy | 59% | 5.4 | 1.12532 | 1.12329 | -20.3 | × |
| 11/04 07:15 | Buy | 60% | 6.6 | 1.12288 | 1.12242 | -4.6 | × |
| 11/04 07:30 | Buy | 59% | 5.7 | 1.12285 | 1.12348 | +6.3 | ○ |
| 11/04 23:15 | Buy | 66% | 5.9 | 1.12303 | 1.12324 | +2.1 | ○ |
| 11/04 23:30 | Buy | 71% | 7.4 | 1.12293 | 1.12332 | +3.9 | ○ |
| 11/04 23:45 | Buy | 73% | 7.7 | 1.12283 | 1.12337 | +5.4 | ○ |
| 11/05 00:00 | Buy | 72% | 6.9 | 1.12279 | 1.12350 | +7.1 | ○ |
| 11/05 23:15 | Buy | 67% | 6.2 | 1.12174 | 1.12194 | +2.0 | ○ |
| 11/05 23:30 | Buy | 67% | 5.9 | 1.12172 | 1.12301 | +12.9 | ○ |
| 11/05 23:45 | Buy | 65% | 5.0 | 1.12169 | 1.12261 | +9.2 | ○ |
| 11/06 16:15 | Buy | 64% | 6.0 | 1.11370 | 1.11478 | +10.8 | ○ |
| 11/06 16:30 | Buy | 63% | 5.7 | 1.11337 | 1.11485 | +14.8 | ○ |
Entries are the open of the next bar after the signal, exits are the open of the bar after 8 bars (2 hours). TP/SL are not used.
AI's View of This Week's MarketWeekly Insight
This week's EURUSD had a weekly high-low of 142 pips and finished -20 pips from the week's opening price. The ATR14 for one 15-minute bar is about 6.5 pips on average.
There were 18 signals (buy 18 / sell 0), with 14 wins and 4 losses, totaling +68.3 pips. Subtracting a round-trip of 1.0 pips yields +50.3 pips.
Confidence ranges from 59% to 75%, and the expected range is about 5.0 to 7.7 pips.
Applying the recommended filter below (confidence 70% + expected range 8.0) to this week results in 0 remaining signals. The filter isdesigned to reliably reduce signal count. Please use under the assumption that only a few signals appear per week.
Recent Trends6 weeks
The bars represent weekly total pips (pre-spread). The vertical line is 0.
| Week | Bars | Wins-Losses | Win Rate | Total Pips | Per Bar |
|---|---|---|---|---|---|
| Week 40 (09/28〜) | 9 | 7-2 | 77.8% | +20.9 | +2.3 |
| Week 41 (10/05〜) | 11 | 9-2 | 81.8% | +64.8 | +5.9 |
| Week 42 (10/12〜) | 12 | 6-6 | 50.0% | -12.6 | -1.0 |
| Week 43 (10/19〜) | 3 | 3-0 | 100.0% | +68.9 | +23.0 |
| Week 44 (10/26〜) | 10 | 6-4 | 60.0% | -0.4 | 0.0 |
| Week 45 (11/02〜) | 18 | 14-4 | 77.8% | +68.3 | +3.8 |
| Total | 63 | 45-18 | 71.4% | +209.9 | +3.3 |