

[Development Diary] Definition and How to Read the Maximum Drawdown — The Required Rise Rate for Recovery and the Three MT4 Indicators
In a backtest report, you will inevitably see 「drawdown」, and we will organize its definition, calculation, and reading in the report in a Q&A format.
Put operational handling aside for another time; here we focus only on “what numbers were measured and how.”
Q1. What is drawdown
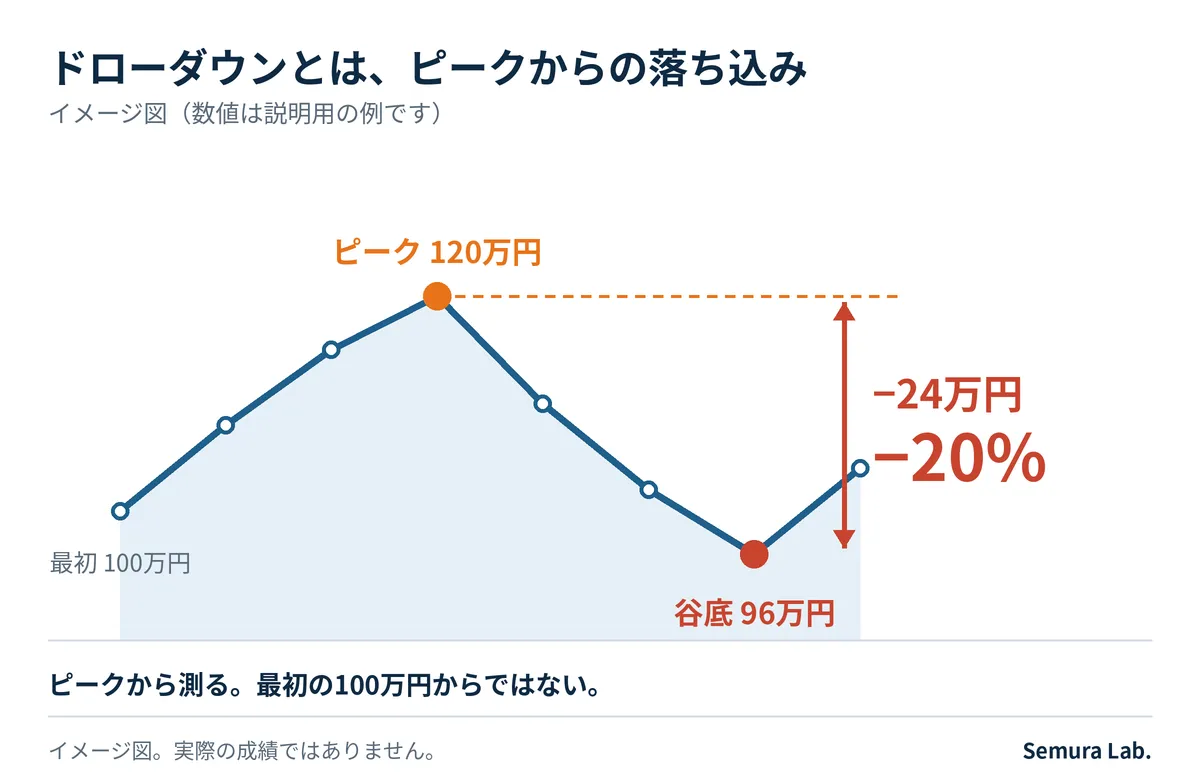
It is the decline from the asset's peak (high) after it has reached a high point.
Measured by account balance, or by usable margin including unrealized P/L.
It refers to the drop from the peak to the trough, with the largest drop across the period being the “maximum drawdown (maximum DD).”
The formula is drawdown (%) = (peak − trough) ÷ peak × 100.
It is the largest decline observed during the period and does not indicate an upper limit for future declines.
It is not a measure of win rate or number of trades; it looks at how the equity curve sinks.
Even with a high win rate, if the losing trades are large, the drawdown becomes large.
 【Image:fig45_drawdown_image.png】
Q2. How is it calculated
The reference is the peak, not the initial capital.
Whether you measure balance or usable margin depends on the tool.
For example, if an account grows from 500,000 to 600,000 and then drops to 450,000, the decline amount is 150,000.
Against the peak of 600,000, that is 25%.
Also, the same percentage can correspond to different dollar amounts depending on the account size.
25% on a 500,000 account is about 125,000, and on a 10,000,000 account is 2,500,000.
Q3. How much is needed to recover to the original level
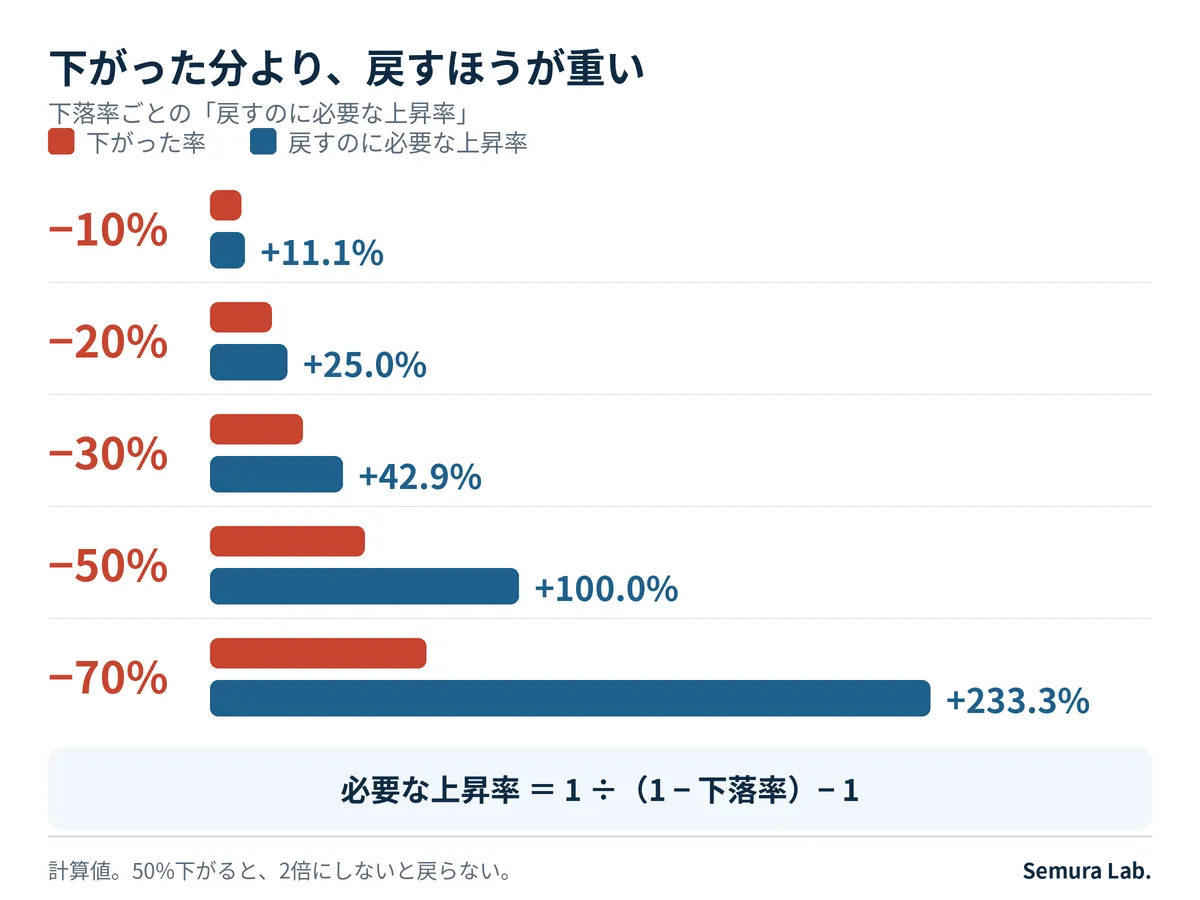
If the decline rate is d, the required rise to return to the peak is 1 ÷ (1 − d) − 1.
In the example above, rising from 450,000 to 600,000 requires about 33.3% growth.
Even with a 25% decline, a 33.3% recovery is required.
The deeper the decline, the wider this gap grows rapidly.
A 50% drop requires a 100% rise, and a 70% drop requires about 233% rise (these are calculated values).
 【Image:fig46_recovery_table.png】
Q4. What makes drawdown deepen
A representative factor is a sequence of losses.
Even with a trading approach that limits a single loss to 1% of balance, 10 consecutive losses will reduce the balance by about 9.6% (calculated from 0.99 to the 10th power).
If loss amount is fixed per lot, 10 consecutive losses amount to 10% of capital.
The combination of loss size, lot size, and length of losing streak manifests as the maximum drawdown.
In other words, the maximum DD is influenced not only by the logic but also by how the lot sizing is implemented.
Q5. Besides depth, what else should be looked at
The time it takes to return to the peak.
Even with the same depth, a recovery in a matter of weeks versus sinking for months makes the ongoing operation burden very different.
Because report numbers alone make it hard to read the period, also check the profit/loss graph.
Even if it appears to be rising, look for long sideways or troughs in the middle.
Q6. Why are there three types of drawdown in MT4 reports
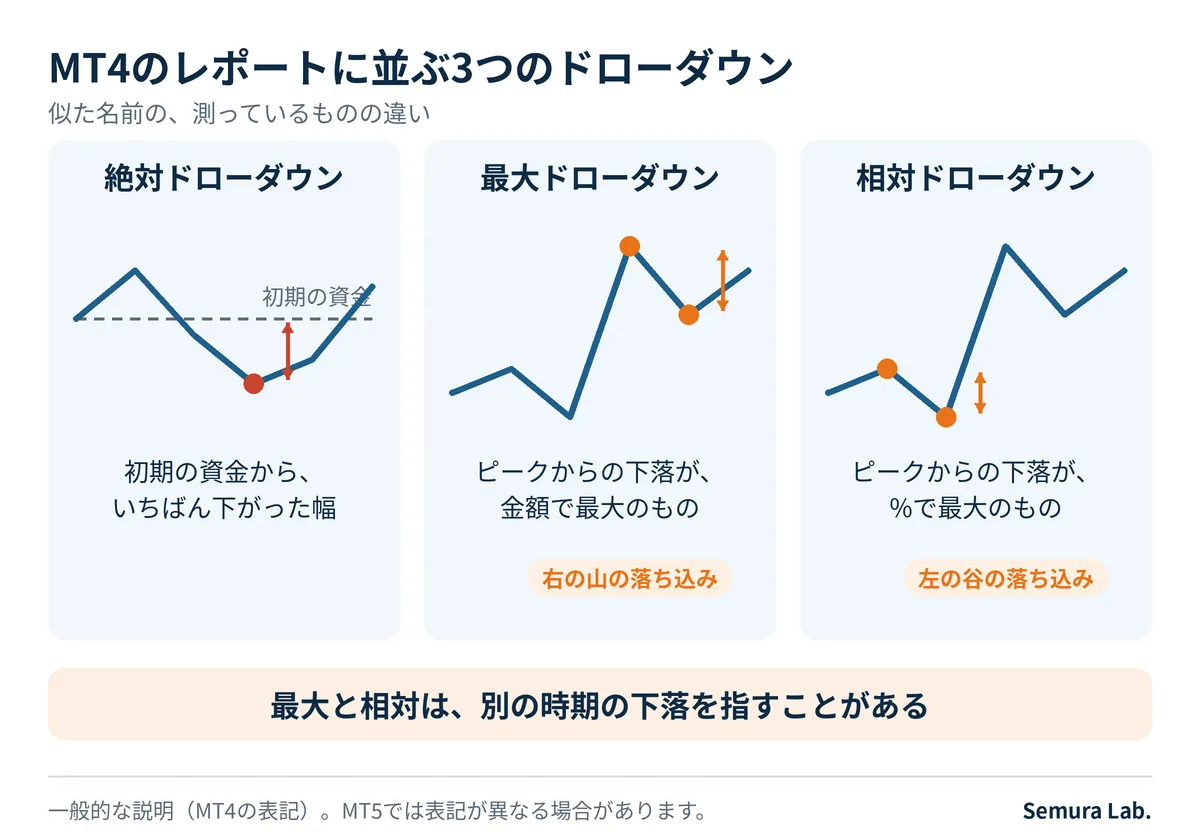
The Strategy Tester report shows three drawdowns side by side.
・Absolute drawdown: the largest drop from the initial funds
・Maximum drawdown: the largest drop in terms of money from the peak
・Relative drawdown: the largest drop from the peak in percentage
Absolute drawdown only covers the portion below the initial funds.
A report that increases smoothly from the start will be close to zero.
Maximum and relative drawdowns can refer to drops at different times. After an account grows, its subsequent drop may be large in amount but small in percentage.
In MT5, the notation may differ.
 【Image:fig47_mt4_three_drawdown.png】
Q7. How do lab products' maximum drawdown look
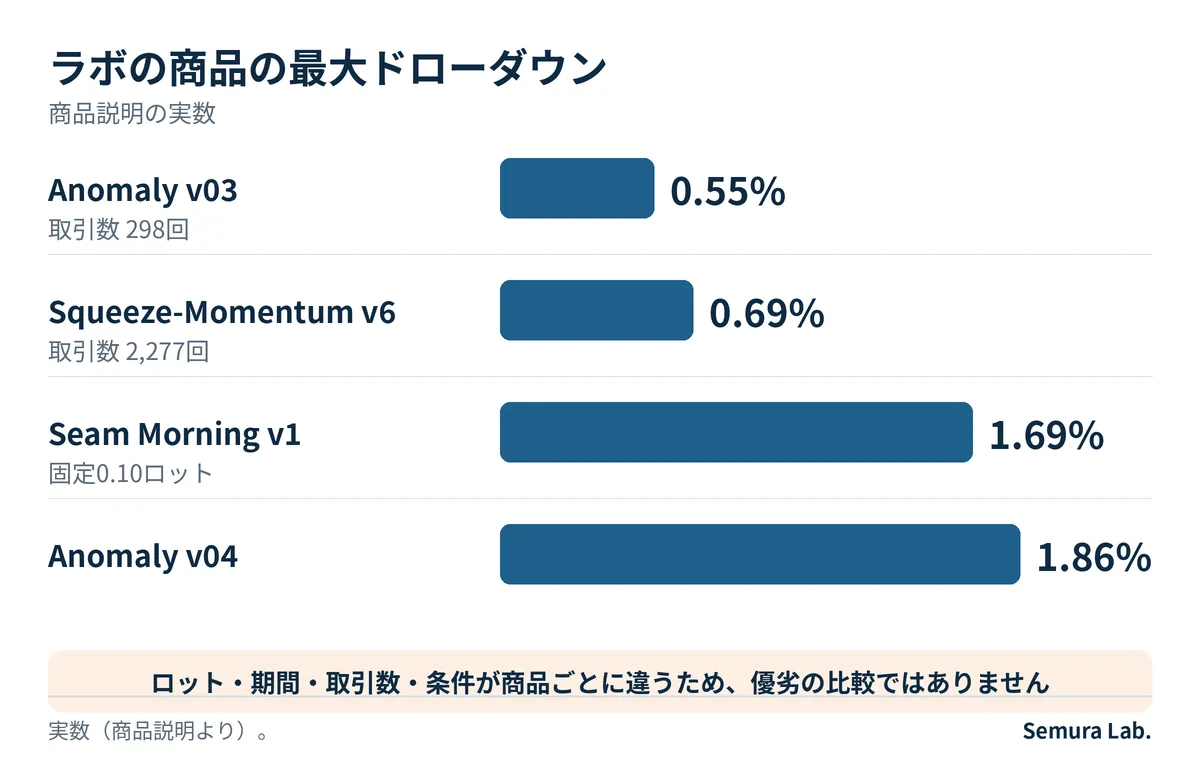
The actual numbers in the product descriptions are: Anomaly v03 0.55%, Squeeze-Momentum v6 0.69%, Seam Morning v1 1.69%, Anomaly v04 1.86%.
Number of trades differs greatly: v03 has 298, v6 has 2,277.
Between the 2,277 trades resulting in 0.69% and the 298 trades resulting in 0.55%, there is a difference in the substantiation of the numbers.
 【Image:fig48_lab_max_dd.png】
These figures simply pulled from the product descriptions.
However, these four cannot be compared side by side.
Lot size, period, number of trades, and conditions differ by product.
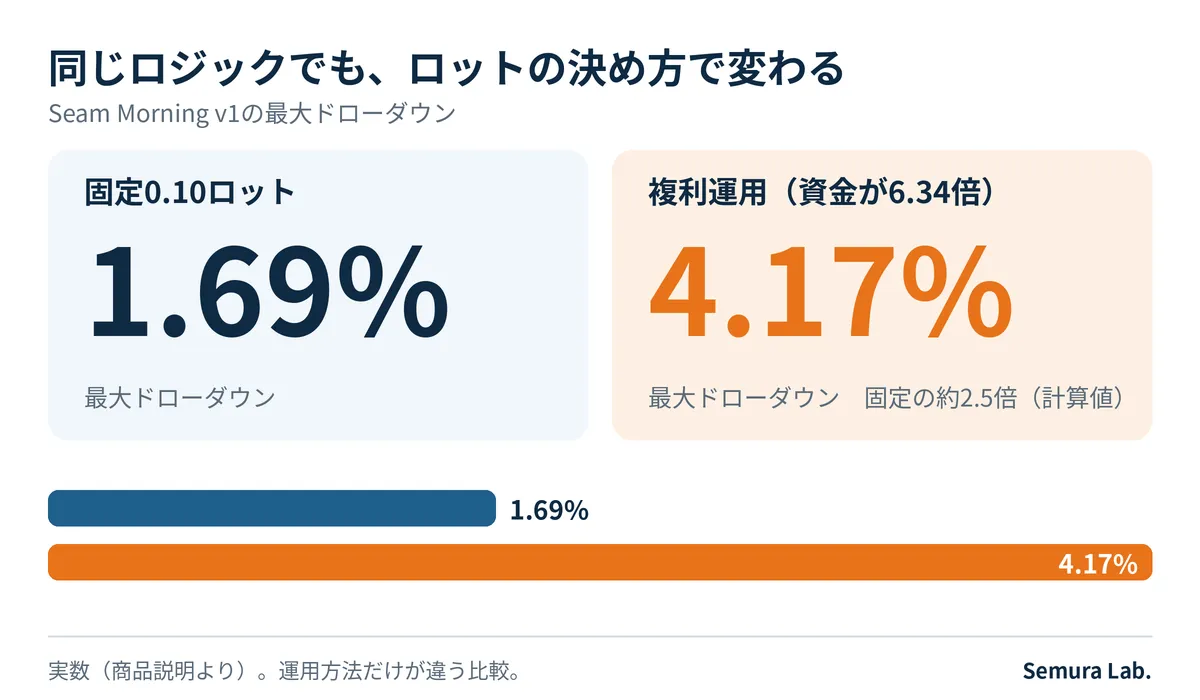
Seam Morning v1 with a fixed 0.10 lot yields 1.69%, and with compounding it grows by 6.34 times, but the maximum DD becomes 4.17%.
Even with the same logic, the DD percentage changes with how the lot is determined.
The more trades there are, the less the maximum DD value is influenced by chance, in other words, a more reliable figure.
 【Image:fig49_seam_fixed_vs_compound.png】
Q8. What should you be careful about when reading the report
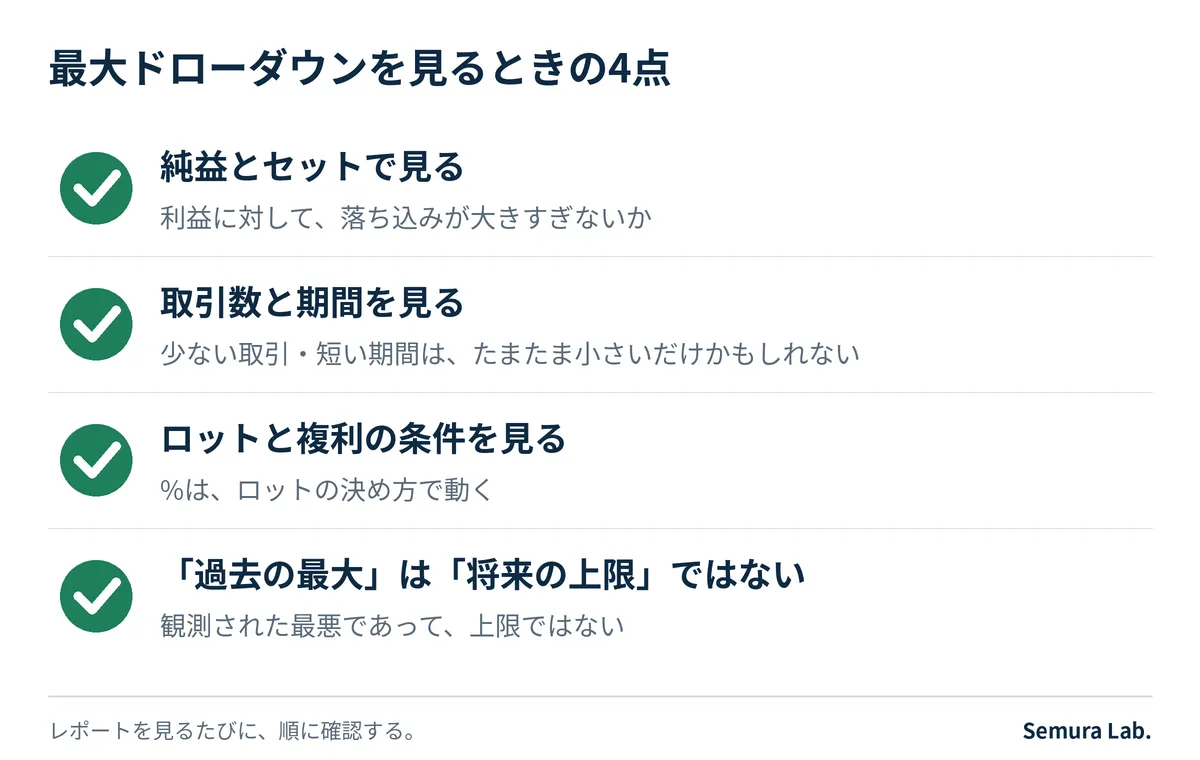
Confirm the following four points.
Balance with net profit.
Is the drawdown too large relative to the profits?
Even if net profit is large, if maximum DD is at a similar level, the operation may feel harsh in practice.
Number of trades and period.
A small number of trades or a short period may look small simply due to scale.
Lot size and compounding conditions.
% changes with the operating design. When comparing, align the conditions.
This is a past maximum, not a future upper bound. It is the observed worst-case, not the worst possible.
Some tester values may not include real-world frictions such as wider spreads or order slippage.
The fourth point also relates to this. If you apply these four checks in order whenever you read a report, you will reduce misinterpretation significantly.
 【Image:fig50_check_points.png】
There is no one fixed answer to “what percentage is safe.”
It varies with account funds, lot size, and the acceptable range. So
Reading the meaning of numbers accurately becomes the prerequisite for judgment.
The ability to read numbers is a basic tool to avoid being swayed by the impressions of profit/loss graphs.
We at Semura Lab. base our approach on showing numbers without embellishment, with their definitions and conditions attached.
If you have any confusion in how to read a report, feel free to reach out at the General Consultation Desk.