
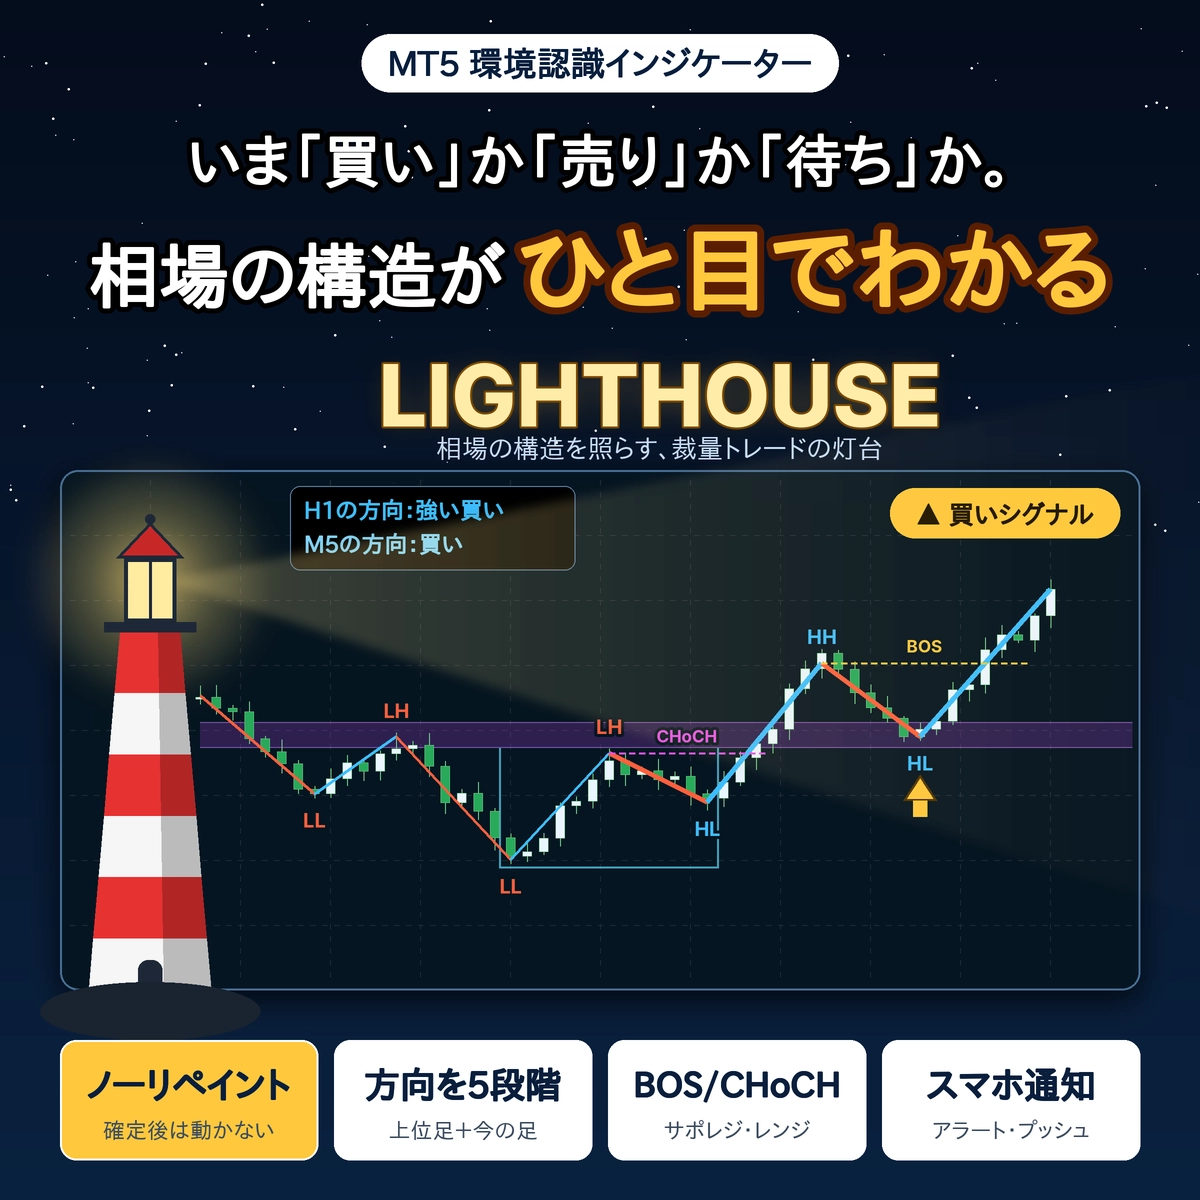
【11/7 Night Pound-Dollar】Moves within the range of 1.34628〜1.33417, ends Friday at 1.335 — Market structure and the latest targets seen on LIGHTHOUSE
LIGHTHOUSE (Light House)
Automated at a glance reading of the chart's "reading".
This is a discretionary trading support indicator that displays on the chart the direction of the higher time frame and the current bar, high/low updates, pullbacks and retracements zones as-is.
1. Latest Chart: Pound-Dollar 1-hour chart (until the close of November 6)
First, view the current pound-dollar on a 1-hour chart with LIGHTHOUSE applied.
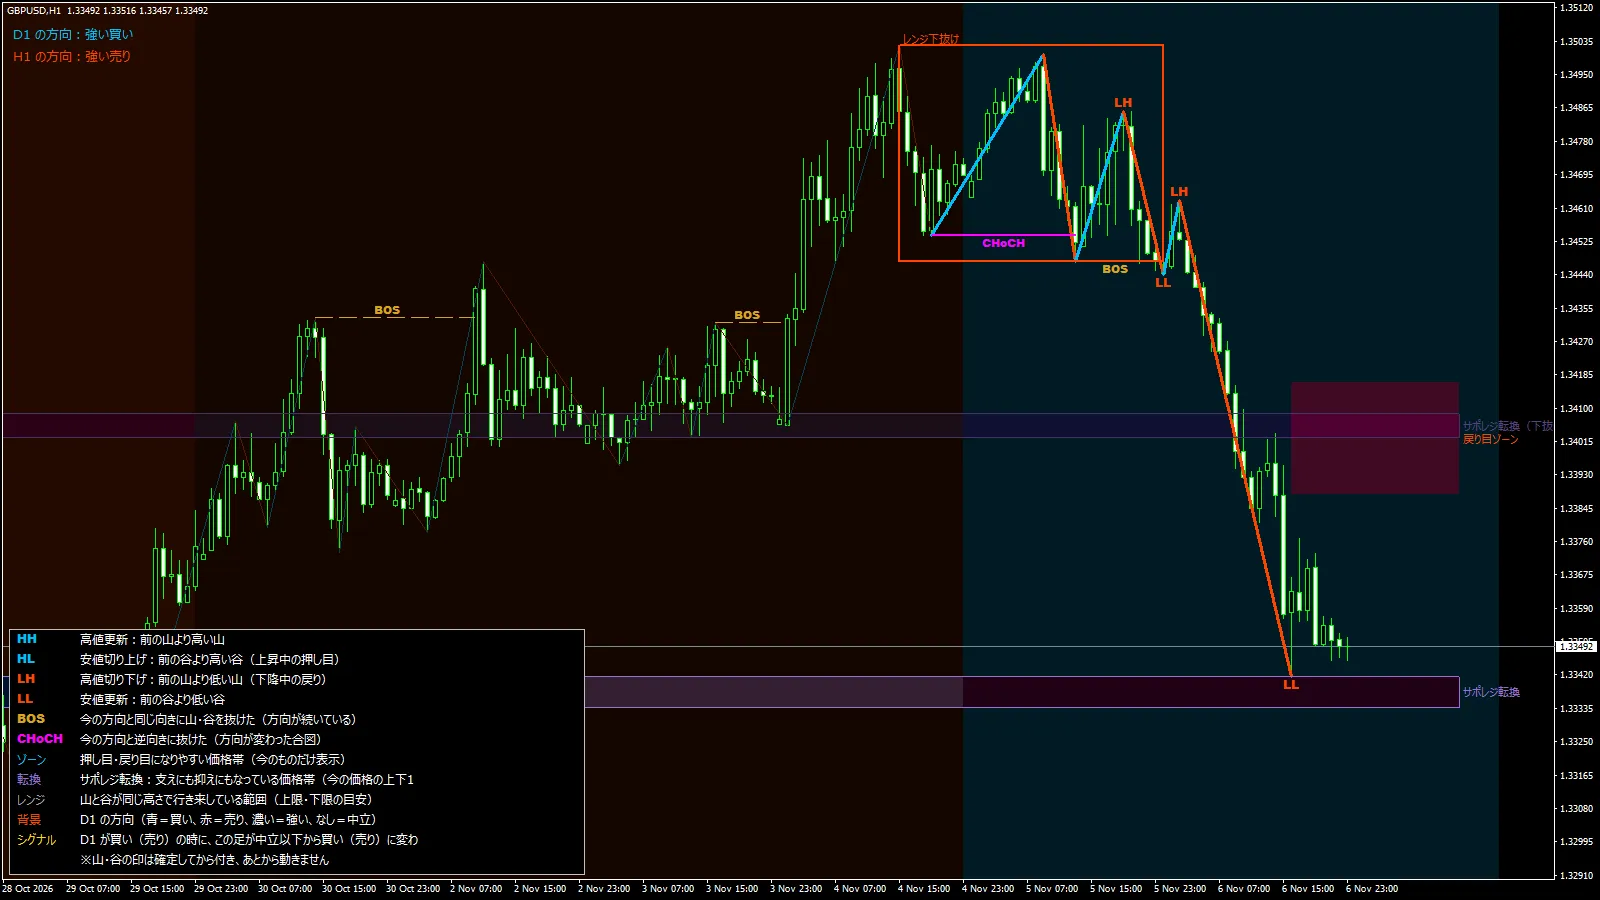
・In the upper left, the higher time frame (daily) shows "strong buy", the 1-hour chart shows "strong sell"
・From the high price area of Day 5LH・LL・BOSdrop while alternating, and at around 16:00 on the 6thLL(around 1.33417) is formed. The right edge is around 1.3349
・There is a return zone (pullback zone) around 1.3388–1.3418Return Zone, immediately below around 1.3333–1.3342 there isSupport/Resistance Reversal Zonedisplayed
Price ranges to watch (based on chart facts)
| 1.34628 | High on the 6th (around 2:00). The day started at 1.34442 |
| 1.33417 | Low on the 6th (around 16:00). LL on the 1-hour chart. The close of the day was 1.33492 |
Other price ranges and near-term targets are conveyed in messages to buyers.
2. Past cases: LIGHTHOUSE signal scenarios
Primarily past cases.They do not predict or guarantee future price movements. When LIGHTHOUSE is on the chart, two scenarios show how the movement looks after a signal.
Case ① November 6 (Fri) early morning to daytime: 5-minute chart
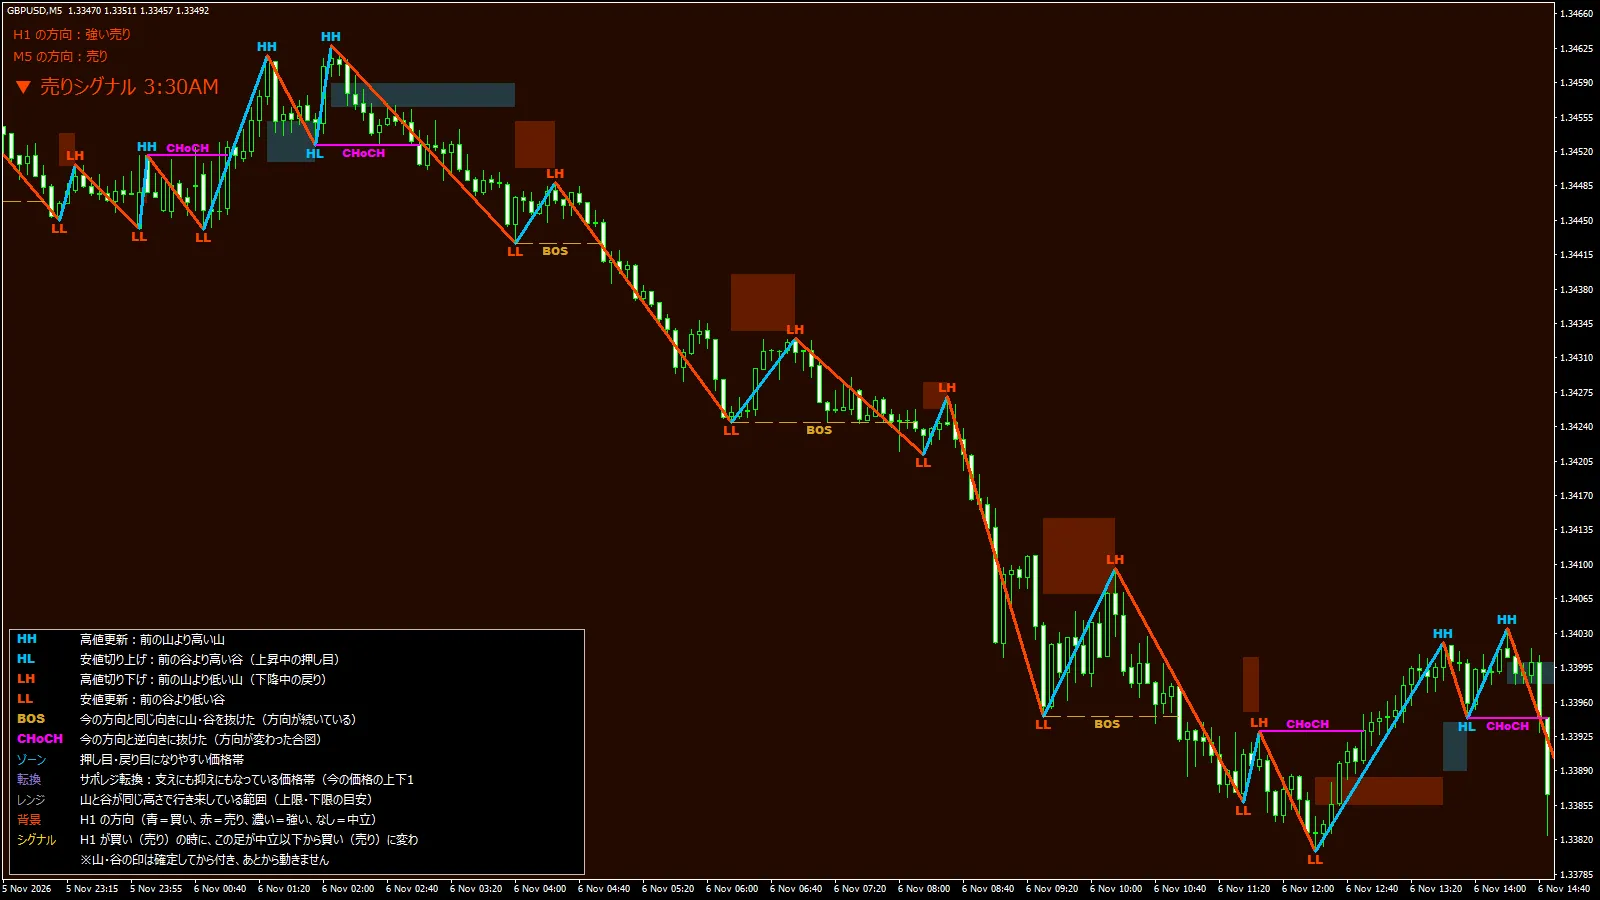
At 4:25 on the 6th (server time), a sell signal appeared. Movement from around 1.3447 followed by a downward trend, reaching around 1.334 by 16:00 on the same day.
LH peaks in the retracementLHappears,LLandBOSappear as the downward trend continues. After that, there were moments of rebound from the low-price zone.
Case ② October 20 (Tue) afternoon: 5-minute chart
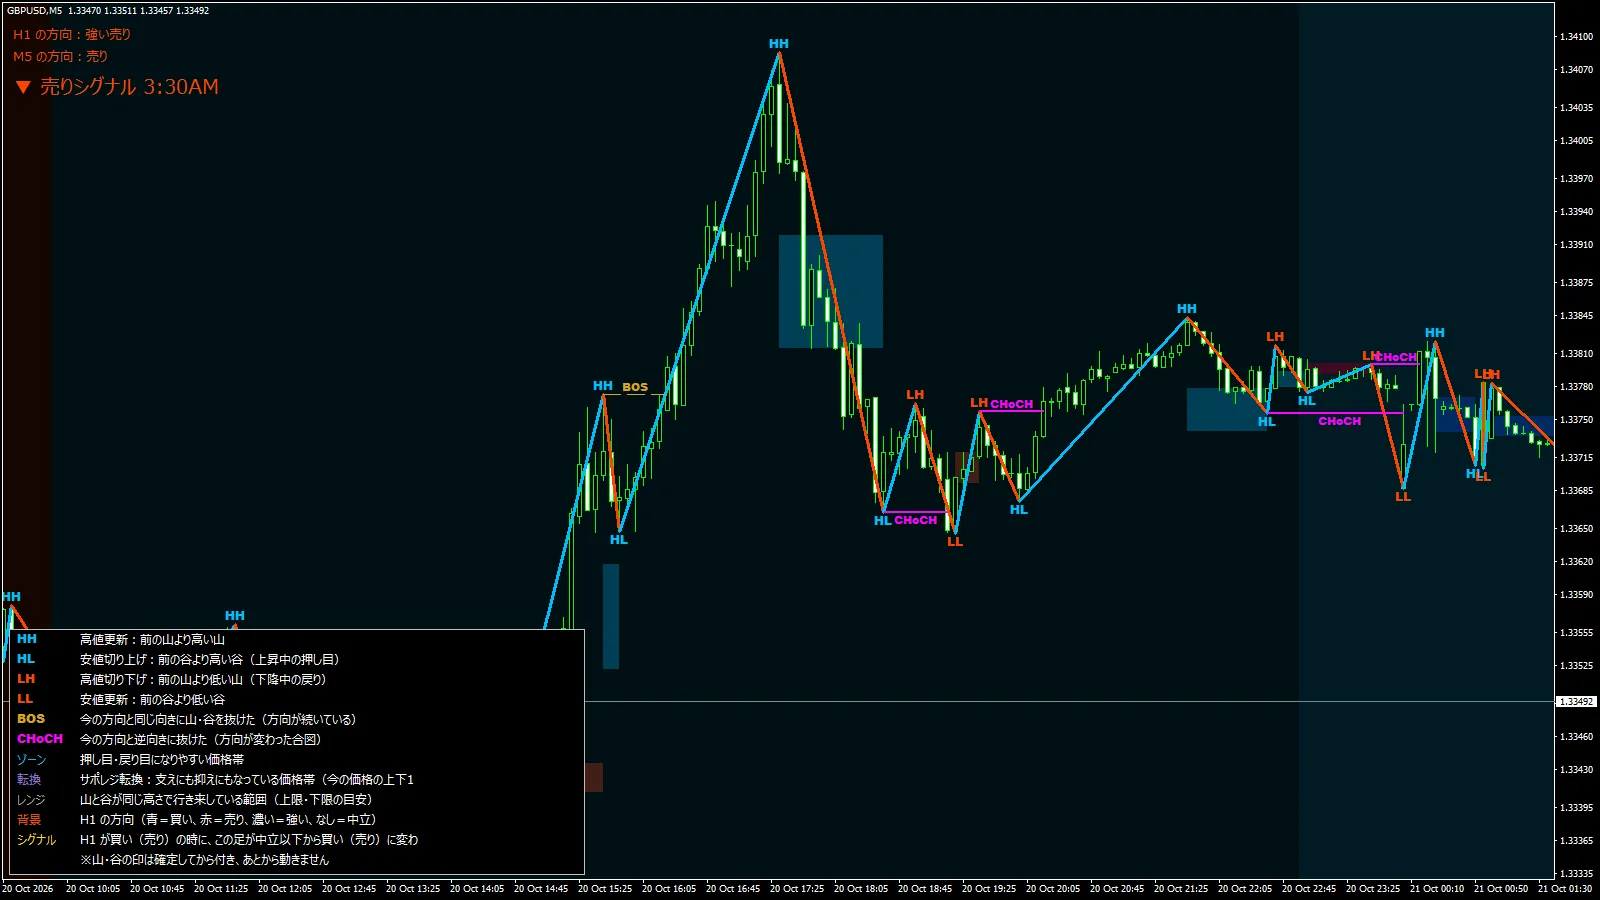
At 15:10 on the 20th (server time), a buy signal appeared. From around 1.3351, by about 17:00 the same day it rose to around 1.340.
PullbackHL(lower highs increasing) appeared,HH(highs updating) continued. There were also moments when price fell from the high zone afterward.
※ The cases are selected to show clear moments. Not all signals will move in the same way. Also, the positions or conditions where signals occur are not detailed here.
What LIGHTHOUSE shows
・Displays the direction of the higher time frame and the current bar in five levels at the top-left of the chart
・Automatically displays the marks HH/HL/LH/LL and the BOS/CHoCH lines
・Displays pullback/retracement zones, support/resistance reversal zones, and range boxes
・Marks for peaks and troughs appear only after they are confirmed; they do not move or disappear later (no repaint)
・The meanings of terms are shown at the bottom-left of the chart, so you can learn as you view
For LIGHTHOUSE purchasers
Daily, detailed price ranges and the near-term targets are delivered via buyer-only messages.
・This article presents past price movements and does not predict or guarantee future movements. Please make investment decisions at your own risk.
・Prices and dates are based on the BigBoss (demo account) MT4 chart (server time). They may vary slightly depending on the broker.
・LIGHTHOUSE is an indicator for market analysis support and does not perform automated trading.