
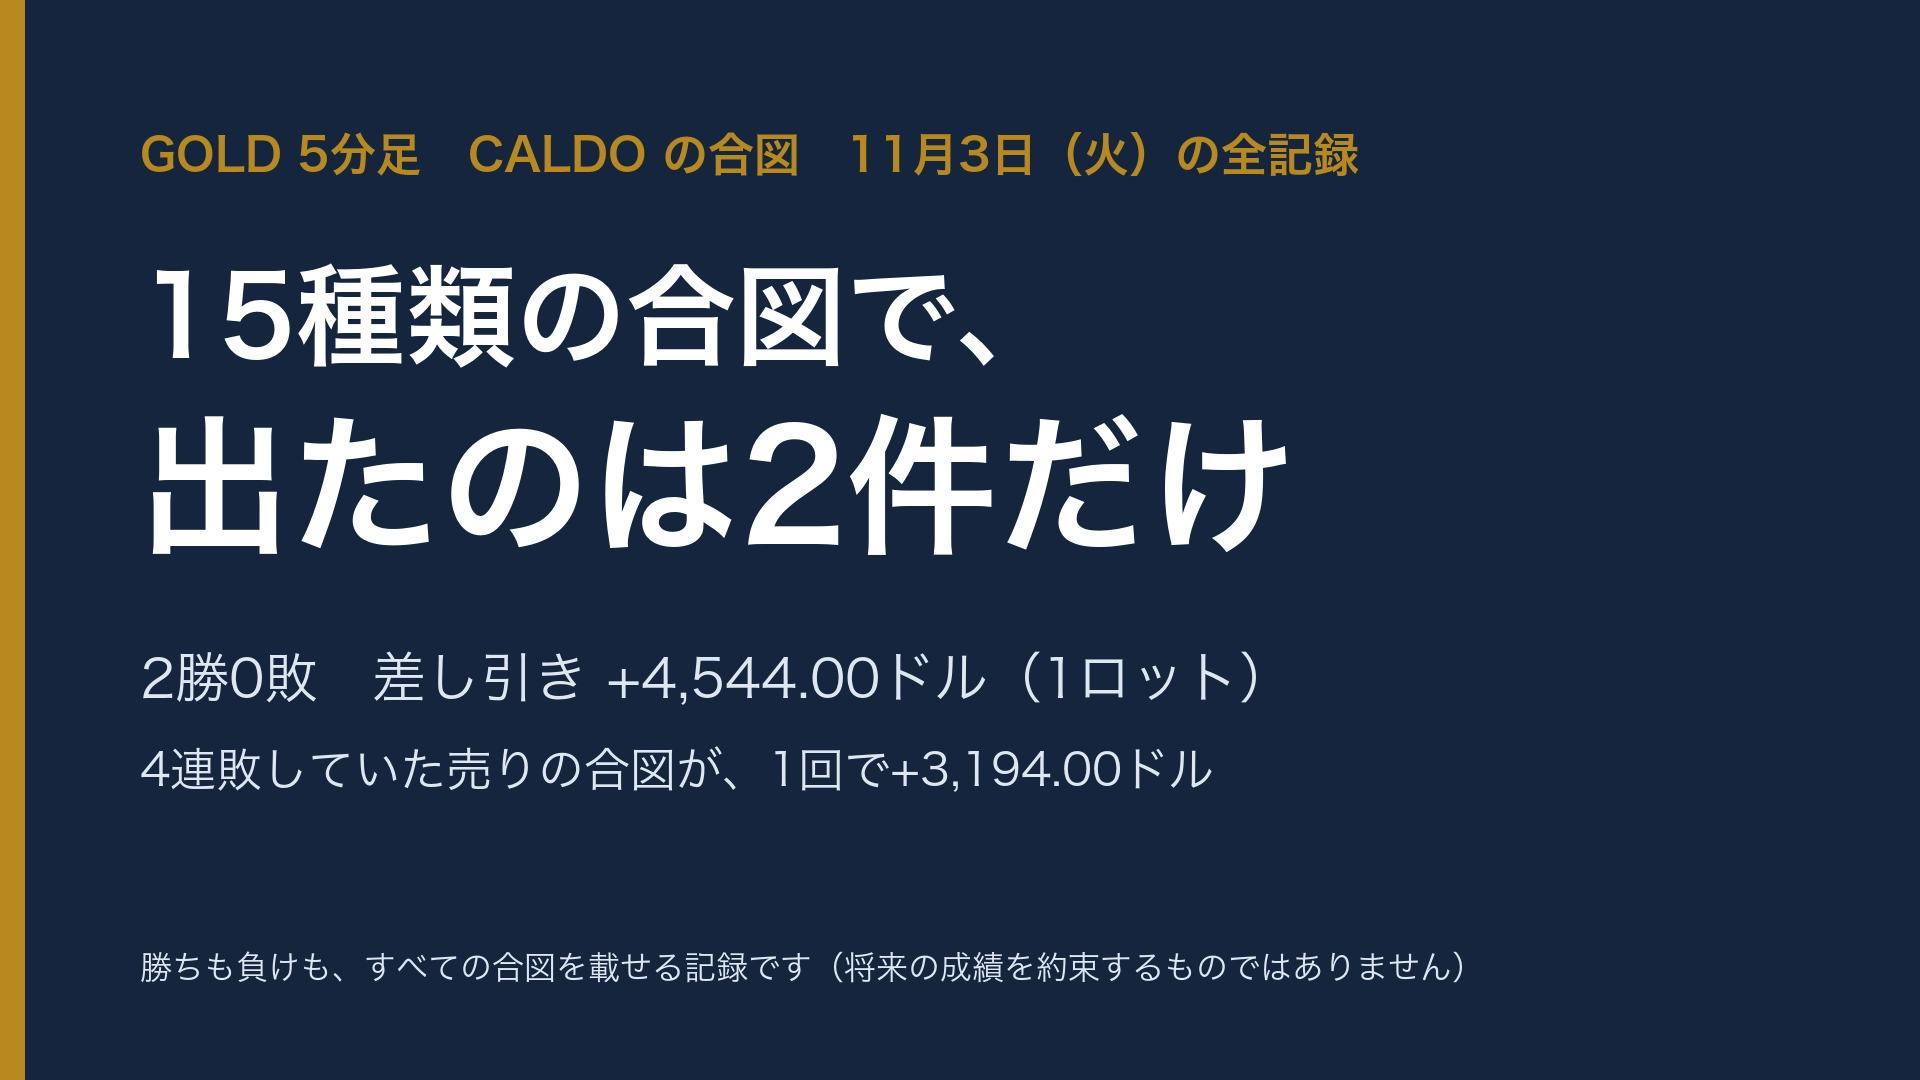
With 15 signals, 2 results emerged. 2 wins, 0 losses, +$4,544.00 | The GOLD 5-minute chart "CALDO" that does not rely on win rate, full record for Tuesday, November 3
Even if you’re shown only the records of profitable days, you can’t be sure what to believe.
Indicator advertisements often display screens from days when it hit nicely. But what I really want to know iswhat happens if you continue, including the days you lose. Therefore, I publish the results of the signals day by day, including both wins and losses.
The GOLD (XAUUSD) 5-minute MT5 indicator I created“CALDO GOLD SIGNAL”has 15 types of signals. The signals that appeared on November 3 (Tuesday) were2. This follows the record of November 2 (3 signals: 2 wins, 1 loss).
November 3 (Tuesday): If you trade according to CALDO’s signals
| Signal | Win/Loss | Win Rate | PF | Profit/Loss (1 lot) |
|---|---|---|---|---|
| 2 signals (sell 2) | 2 wins, 0 losses | 100.0% | No losses (cannot calculate) | +4,544.00 dollars |
Both the morning sell and the sell right after the date change were profitable, netting +4,544.00 dollars (per 1 lot). Since there were no losses, PF (total profits ÷ total losses) cannot be calculated.The result of only 2 signals does not imply a 100% win rate. What matters is the “how it was won” that I’ll describe ahead.
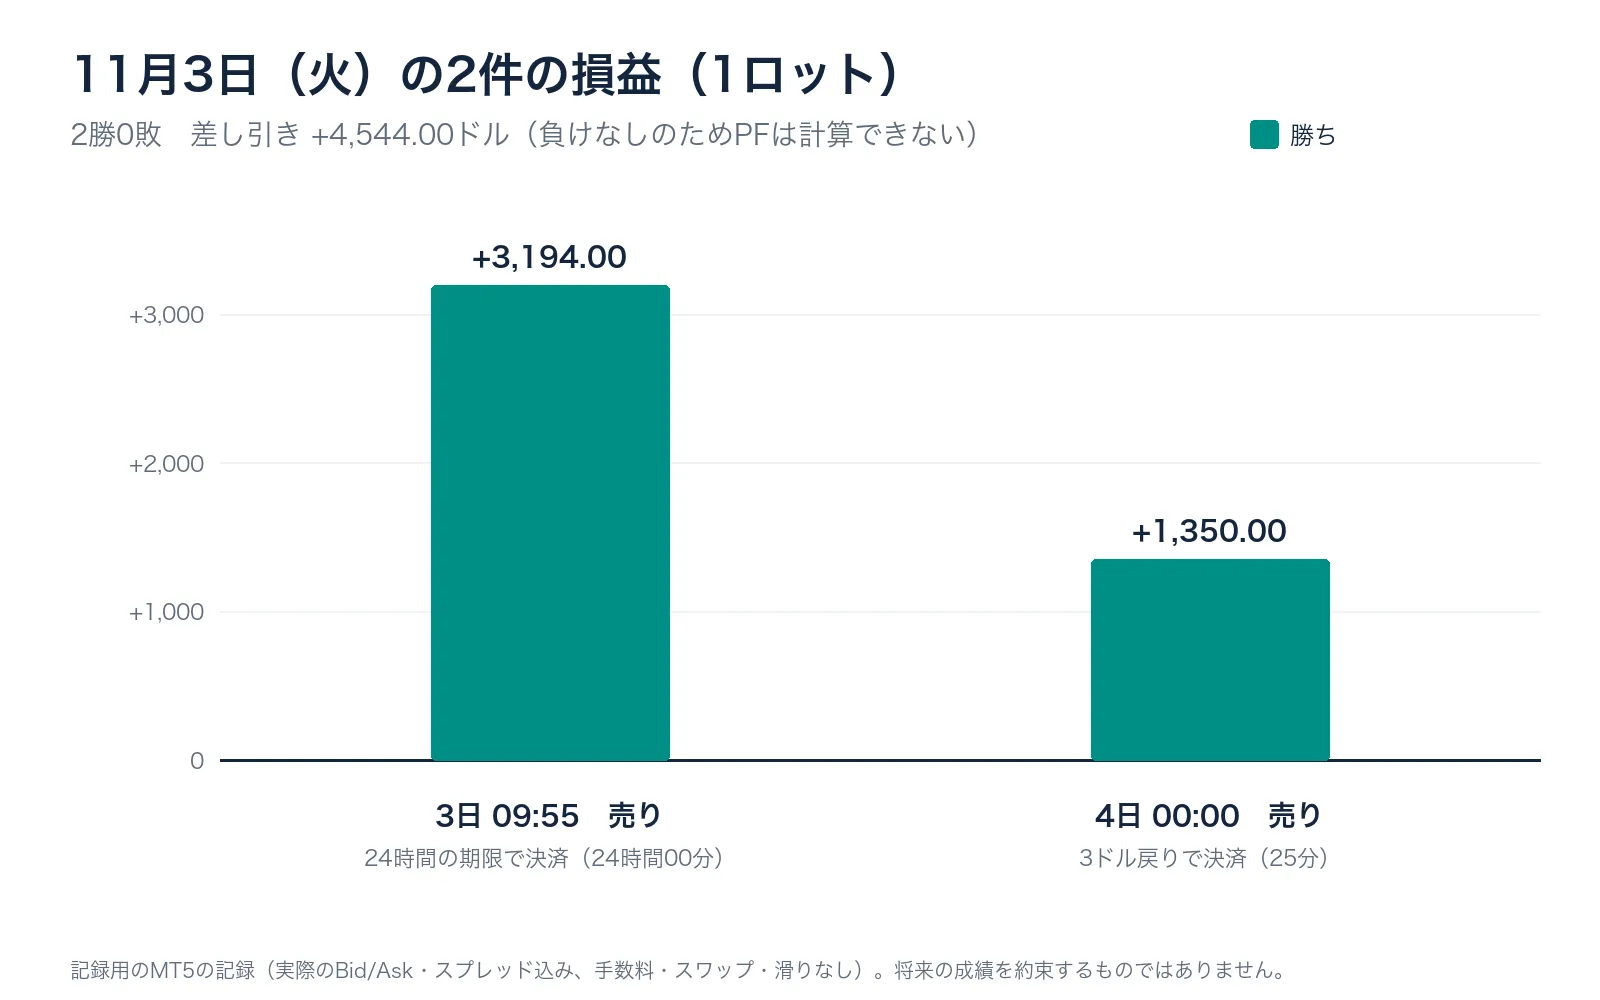
Both signals exited as anticipated, though the exit methods differed
| Entry Time | Direction | Exit Method | Holding Time | Profit/Loss (1 lot) |
|---|---|---|---|---|
| 09:55 | Sell | Exit after 24 hours (did not reach take profit or stop loss targets) | 24 hours 00 minutes | +3,194.00 dollars |
| 4日00:00 | Sell | Moved favorably by $10, then retraced by $3 and exited | 25 minutes | +1,350.00 dollars |
The morning 09:55 sell exited after 24 hours without reaching the take profit (at 120.41 dollars ahead) or the stop loss, finishing at +3,194.00 dollars. The 4:00 after midnight sell chased the move by $10 and exited +$1,350.00 when it retraced by $3. It was held for 25 minutes.
Both exits followed the rules established at entry. There was no mid-course change in judgment.
Three reasons CALDO is “new”
① Even with 15 types, they only fire when conditions align
CALDO has 15 different signals separated by time frame and situation, such as “pullback within an uptrend,” “return to broken support,” “breakout of the Asia TIME band,” “twice-resisted top at the high of the return,” and “a large real body on the hourly chart after.” On this day, 13 of the 15 signals did not appear at all. It’s also part of the rules that signals may go missing for long periods.
② For each signal, the exit method is different
Even with the same “sell,” the exit rules for the two signals on this day were completely different. The morning sell placed the take-profit target 120.41 dollars ahead of entry, with a stop-loss target of 8.72 dollars.A signal that aims to grab large gains when it hits, even after several losses. The evening sell does not set a take-profit target; it chases profit after a 10-dollar move and exits after a 3-dollar retracement.A signal that takes only the extended portion and exits quickly.
③ A research method that records conditions first and then verifies
Before verification, I record the conditions, periods, and criteria for passing, and after subtracting costs such as spreads, I keep all results in a ledger of pass/fail (70 judgments so far). Compared with trades entered at random times, signals that merely looked good are excluded.
Signal quantity is not used to create confidence; instead, signals are categorized by scenario and paired with profits or losses appropriate to that scenario to aim for wins.This is supported by research records and full public performance. This is CALDO’s novelty.
What you need to do, in three steps
1) When a light blue up-arrow (buy) or orange down-arrow (sell) appears, decide whether to enter
2) Place a stop-loss order at the orange dashed line (stop-loss target)
3) When the yellow star appears, exit
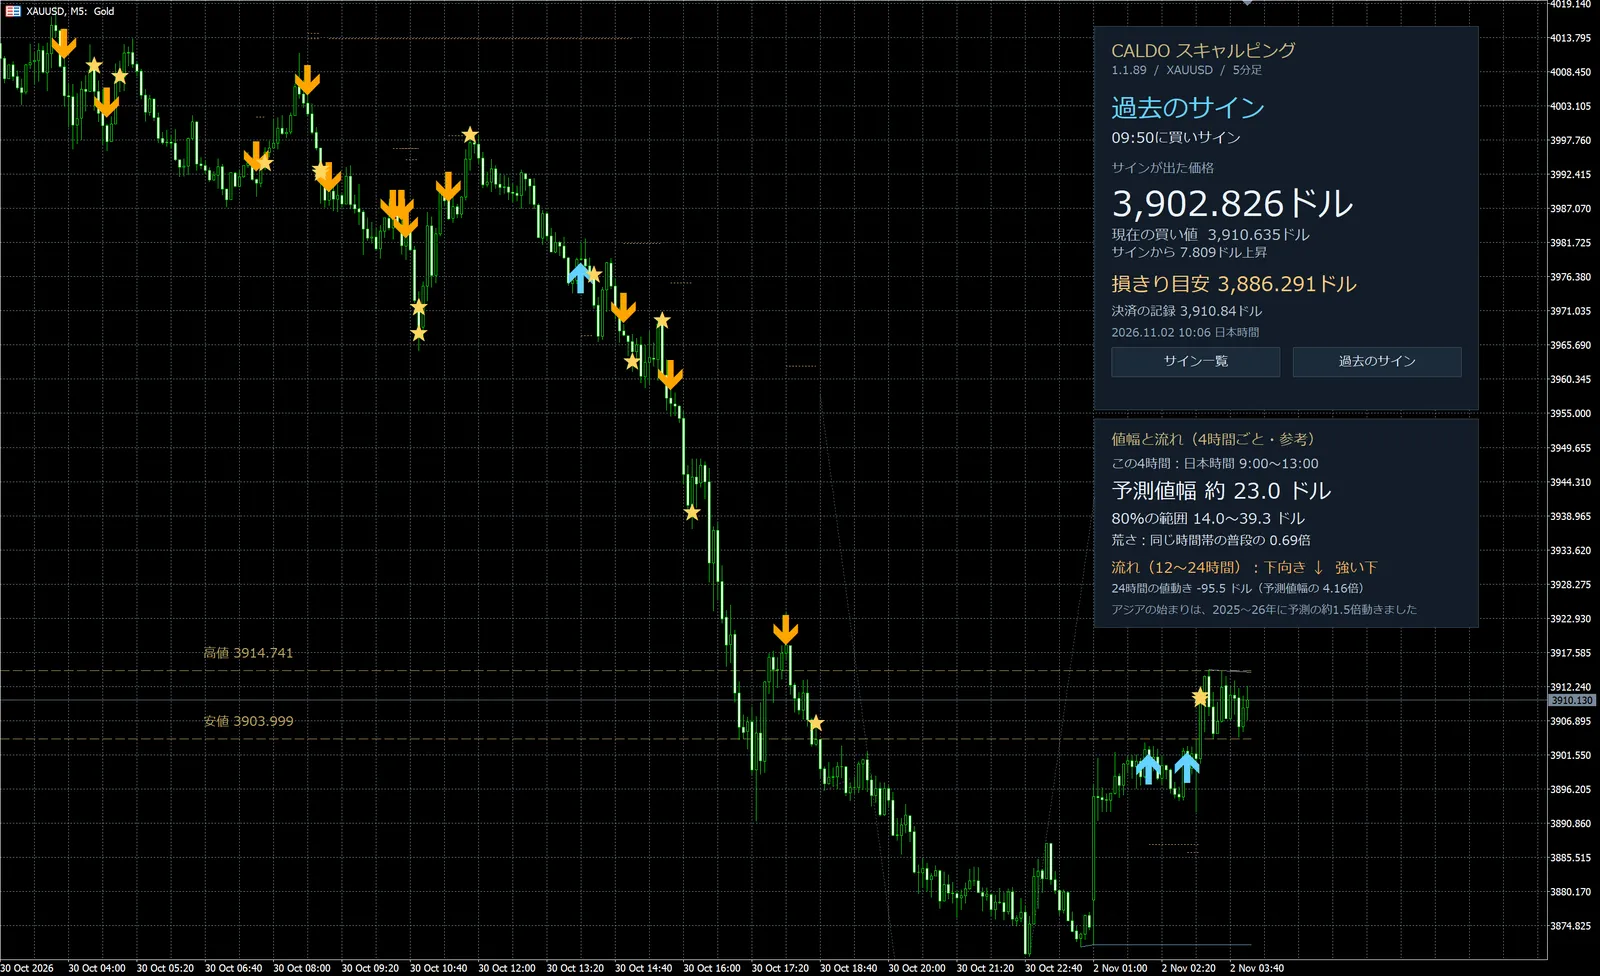
This is CALDO’s actual screen (MT5 on OANDA, XAUUSD 5-minute chart, shown as an example from November 2. It is not the screen used for this article’s records). The right panel displays the signal price, stop-loss target, and exit records in Japanese. The same yellow star appears when exiting due to a 24-hour duration or a 3-dollar retracement.
What you’ll learn next (free viewing)
From here, you will view two signals one by one, with price and targets.
・The morning selland a similar signal had already caused four consecutive stop losses before. This day’s one win balances against those four losses.
・Even among the two winning signals,the distance to the stop-loss targets was 8.72 dollars and 33.96 dollars. How much would have been lost on one lot?
・Swap considerations for a sell held for 24 hours
・Totals (22 signals) from the previous week: PF and win rate
The continuation can be read by signing up for free access.
About this record:This is a record run from the issuer’s MT5 used for record-keeping, running CALDO GOLD SIGNAL 1.1.98 with the same signal content (no orders were placed). A day is defined as 7:00 a.m. to the next morning 6:00 a.m. (the 4th day 0:00 is also the 3rd day). The November 3 data were reconstructed on November 5 by replaying the actual market movement from that brokerage with the same program. Profits and losses include spreads and are calculated on 1 lot (100 ounces); no fees, swaps, or slippage are included. This is the result of “trading according to CALDO’s signals,” and is not the author’s actual trading. A single day’s result does not determine overall quality, nor does it guarantee future performance.