

【AI Rig Gold】Thorough analysis of 45 days of trading performance! Exploring responsiveness to gold market with M1 and M5!
Thank you for always viewing AI Rig.
This time, the Gold-only trading system「AI Rig Gold」 analyzes in detail the 45-day trading performance of M1 (1-minute chart) and M5 (5-minute chart).
Furthermore, in the latter part,「Will the election in the United States change things? The relationship between gold and major currencies!」will be the theme, explaining how political events ripple into the market.
SPECIAL REPORT 01
AI Rig Gold
A thorough analysis of 45-day trading performance!
A thorough analysis of 45-day trading performance!
Period covered: September 23, 2026 – November 6, 2026 (45 days)
We will review the number of trades, win rate, profit factor, and drawdown for both M1 and M5. Not only looking at profit amount, but also focusing on trading characteristics and risk indicators.
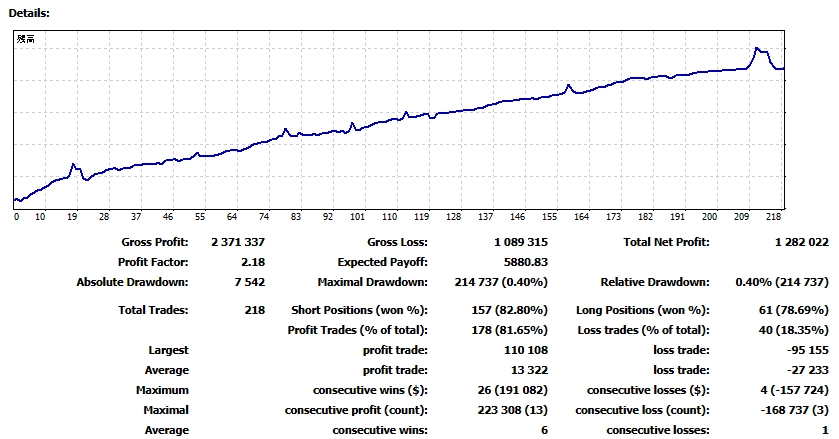
M1|1-minute chart · 218 trades analyzed
Main figures recorded in the 45-day report
Net profit
+1,282,022 yen
218 trades / Win rate 81.65% / PF 2.18
M1 featured more trades among the two timeframes, with 178 wins and 40 losses in 218 trades. The longest winning streak was 26. The profit curve generally rose over the period, but there were also declines in the later part.
Key point|Trading in both SELL and BUY directions
SELL: 157 trades, BUY: 61 trades. SELL accounts for about 72%. In a period where a downward trend was prominent, there were more SELL trades. At the same time, BUY trades also occurred, so it is not a one-directional trading history.
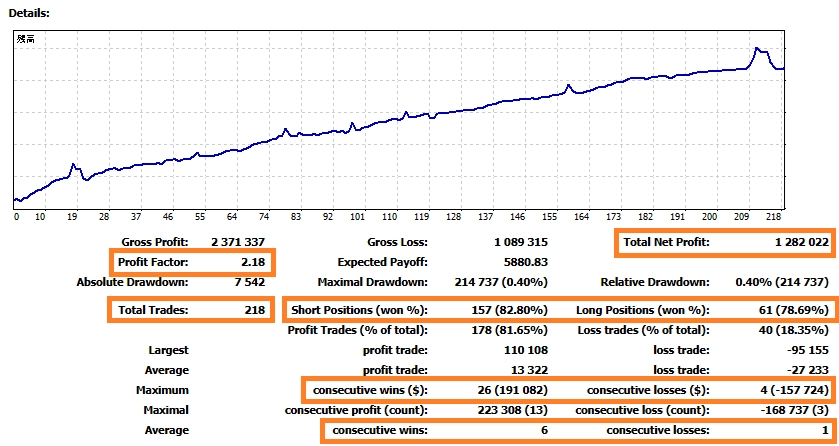
Maximum drawdown was ¥214,737 (0.40%). It is important to review not only win rate but also losing trades, consecutive losses, and drawdown.
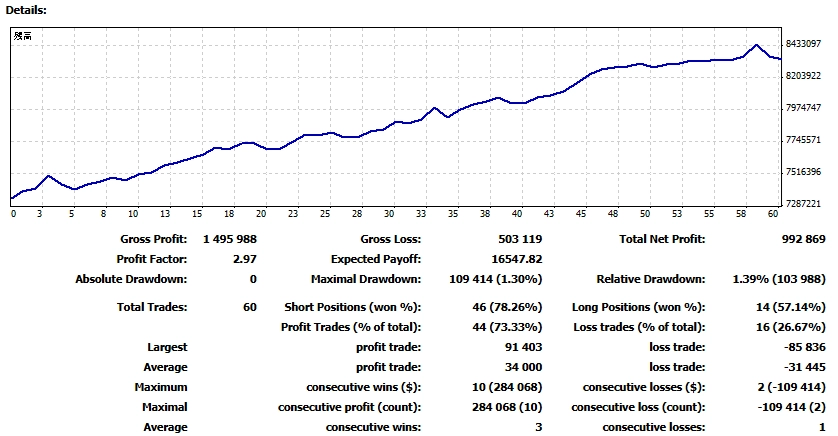
M5|5-minute chart · PF 2.97 trading performance
Main figures recorded in the 45-day report
Net profit
+992,869 yen
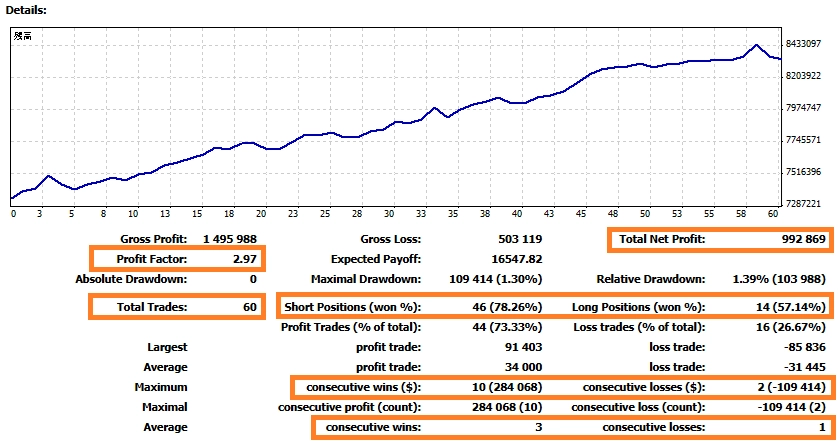
60 trades / Win rate 73.33% / PF 2.97
M5 conducted 60 trades with 44 wins and 16 losses. Fewer trades than M1, but the profit factor reached 2.97. PF is calculated as total profit divided by total loss, indicating that during this period total profit was about 2.97 times total loss.
Key point|Trade count and profit efficiency
SELL 46 trades, BUY 14 trades; again, SELL dominated. Maximum winning streak was 10, maximum losing streak was 2. Maximum drawdown was ¥109,414 (1.30%).
There are differences in trade counts and profit patterns between M1 and M5. Rather than judging one as superior by PF alone, it is important to compare along with trading frequency and the magnitude of losses.
Differences seen between M1 and M5 this time
M1 is characterized by 218 trades and an 81.65% win rate. M5 yielded PF 2.97 with 60 trades.
Common to both is trading mainly in SELL while also engaging in BUY. This is interesting data when considering the relationship between gold movements and trading direction.
YouTube LIVE|Current operation screens also being published
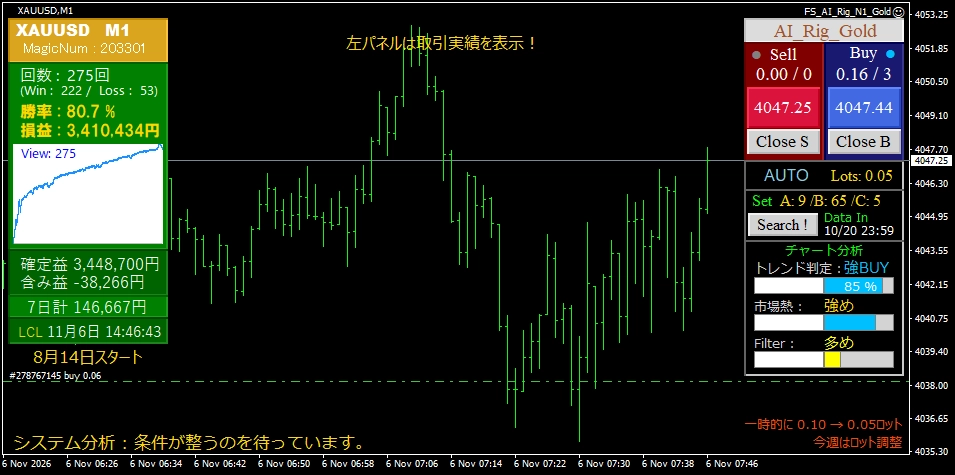
In addition to the 45-day tally, AI Rig Gold has been publishing operation screens on YouTube LIVE since August 14, 2026. You can view actual charts, display of entries/exits, and performance panels. It is a notable feature that you can verify not only past data verification screens but also the operating status at the time of streaming.
M1|LIVE operation screen
M5|LIVE operation screen
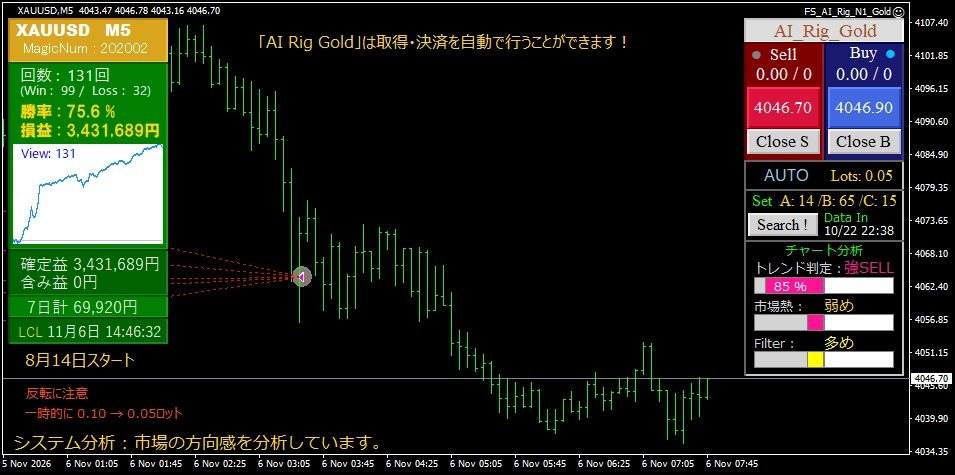
The cumulative profit/loss on the LIVE screen reflects operations since August 14 and differs from the 45-day tally above. Also, depending on market conditions, lot sizes are temporarily adjusted, so direct period-to-period comparisons are not possible.
SPECIAL REPORT 02
Will the election in the United States change things?
The relationship between gold and major currencies!
The relationship between gold and major currencies!
U.S. elections are notable events not only politically but also for financial markets. When results or policy expectations change, effects can spread to interest rates, dollar pricing, stock markets, and gold.
① Expectations for policy move interest rates and the dollar
What markets watch is not only the election results themselves. Fiscal policy, tariffs, taxation, economic growth, and inflation outlook are expected to change in the future. Such expectations can move U.S. Treasury yields and monetary policy forecasts, influencing the dollar market.
② How gold and the U.S. dollar relate
Gold is traded internationally mainly in U.S. dollars. Therefore, a stronger dollar generally burdens the price of dollar-denominated gold, while a weaker dollar tends to support it. However, this relationship does not always hold.
In times of geopolitical tension or market turmoil, both the dollar and gold can be bought simultaneously. Changes in real interest rates and central bank demand for gold also affect price formation.
③ Ripple effects on yen, euro, and other major currencies
If U.S. interest rate expectations change, USDJPY can move through the view of the U.S.-Japan interest rate gap. EURUSD is also influenced by differences in U.S. and European policy and growth outlooks.
Additionally, when converting gold prices to yen, movements in USDJPY affect not only the dollar-priced gold but also yen-denominated calculations. Gold and major currencies appear independent but are linked by shared economic factors.
What matters is not to judge on a single factor.
Before and after elections, expectations may lead the market, and after results are known, markets can move in the opposite direction. Rather than relying solely on news to decide trading direction, it is important to comprehensively monitor interest rates, currency movements, price trends, and volatility.
How to face the changing gold market.
AI Rig Gold is a trading system designed for XAUUSD. It analyzes the market by referencing information from multiple timeframes, not only the current chart, and uses the Search! function to find configuration candidates based on historical data.
Of course, this does not predict election results or future prices. It aims to support decisions using multiple sources of information in response to a changing market.
AI Rig Gold product information
We offer both MT4 and MT5 editions.


We also publish operation status on YouTube LIVE!
If you want to view real-time operation screens, please proceed from the LIVE guide page on Investment Navi.
Actual movements are published on YouTube LIVE!
You can continuously check real-time entries, holdings, and settlements on YouTube LIVE, not just numbers.
▶ Watch YouTube LIVE
The trading results published are past performances recorded under the specified period and environment. They do not guarantee future profits or identical results. Trading involves the risk of losses. Results vary by account conditions, settings, lot size, and market conditions. Market commentary is for general information and does not constitute a recommendation to buy or sell.
AI Rig
Thank you for viewing.
Thank you for viewing.