
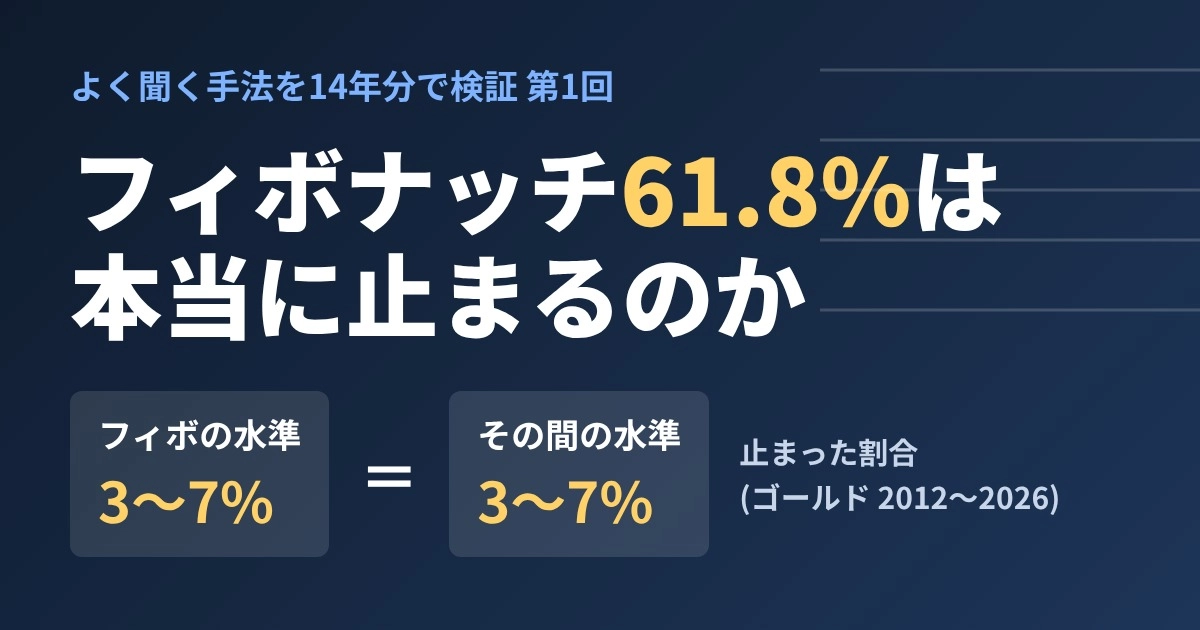
Does the 61.8% Fibonacci level really stop the price? Analyzing 14 years of data
"Fibonacci stops at 61.8%." This is a topic you’ve probably heard at least once in trading books or on social media.
Is it really true? I checked it against about 14 years of Gold price movements (2012 to September 2026).
■ How I researched it
・Collected retracements after up moves (or down moves) on gold on 1-hour, 4-hour, and daily charts
・Counted the proportion where the retracements stopped at Fibonacci levels (38.2% / 50% / 61.8% / 78.6%)
・To compare, I also counted the same way at “levels in between” (45% / 55% / 70% / 85%), which are not Fibonacci
This is the most important part.
If you only look at the example that “stopped at 61.8%,” it seems to have indeed stopped. But if other levels stop about the same, then there isn’t a special force at 61.8%—it’s just that “it stops somewhere.”
■ Results
・Proportion of stops at Fibonacci levels: about 3–7%
・Proportion of stops at the levels in between (45% / 55% / 70% / 85%): likewise about 3–7%
There was almost no difference in how easily price stopped between Fibonacci levels and the levels in between.
I did not find a step where only Fibonacci levels offered rebounds.
■ Why it “appears to work”
Retracements always stop somewhere. When you later draw Fibonacci levels on the place where it stopped, you’ll often find one of the levels nearby (38.2 / 50 / 61.8 / 78.6, four levels).
The reason it appears to work is that “successful hits” stay in memory while “misses” are forgotten. This is the main reason it looks effective.
■ What we’ve learned so far
・There was no special power in the Fibonacci levels themselves to stop price
・If you’re aiming for a rebound with lines, it’s important to compare whether the proportion of stops at that line is actually higher than elsewhere
Next time I’ll share results from investigating the idea that horizontal lines touched repeatedly are stronger, using the same method.
■ Disclaimer
This article shares results from analyzing past data under a set of rules and does not constitute a recommendation to buy or sell.
Past results do not guarantee future outcomes. Please make trading decisions at your own risk.
The verification results for 18 themes, including this article, are summarized in GoGoJyan’s e-book “Verifying Common FX Techniques with 14 Years of Data, Vol. 1.”