
With 15 signals, 3 results appeared. 2 wins, 1 loss · PF 1.79 | GOLD 5-minute chart "CALDO" new construction not relying on win rate, full records for Monday, November 2
When I added the indicators, the chart became full of arrows.
Each signal looked like it had foundation, and I didn’t know which one to follow. If I used all of them, losses would increase; if I chose just one, only that one would incur losses.Having many signals is not reassuring; it is a source of confusion.
The author’s GOLD (XAUUSD) 5-minute MT5 indicator“CALDO GOLD SIGNAL”has 15 types of signals. Yet, on Monday, November 2, the signals that appeared wereonly 3 in one day. This article presents those threewithout leaving any wins or losses behindin the record.
November 2 (Mon), if you trade according to CALDO’s signals
| Signal | Win/Loss | Win rate | PF | Profit/Loss (1 lot) |
|---|---|---|---|---|
| 3 signals (2 buys, 1 sell) | 2 wins, 1 loss | 66.7% | 1.79 | +747.00 USD |
With 3 signals—buys in the morning and a sell and a buy at night—the result was 2 wins and 1 loss. Compared to the total of +1,698.00 USD from the two winning trades, the losing trade was −951.00 USD. Net +747.00 USD (per 1 lot), and the PF (sum of profits ÷ sum of losses) was 1.79.
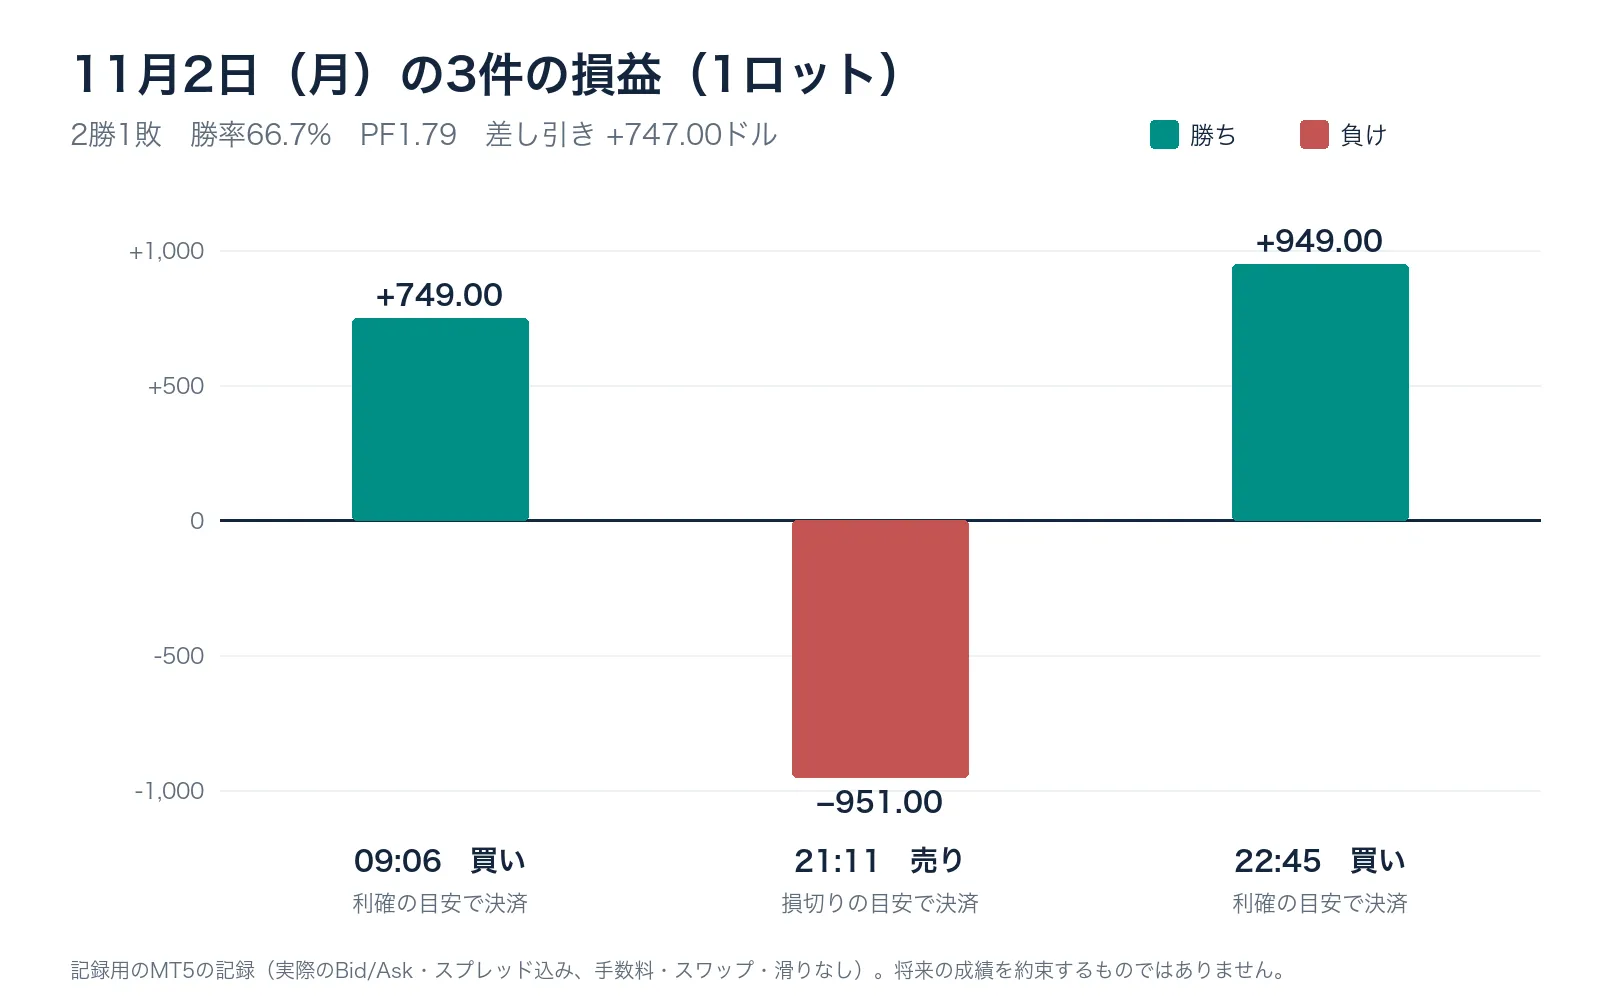
All three ended according to the pre-set targets
| Time | Direction | Method of settlement | Profit/Loss (1 lot) |
|---|---|---|---|
| 09:06 | Buy | Reached the take-profit target | +749.00 USD |
| 21:11 | Sell | Reached the stop-loss target | −951.00 USD |
| 22:45 | Buy | Reached the take-profit target | +949.00 USD |
Both winning buys reached the take-profit target and were settled. The losing sell reached the stop-loss target at −951.00 USD.All three ended exactly as the targets shown on the screen at entry. There was no moment of hesitation in between.
Three reasons CALDO can be considered “new”
① Even with 15 kinds available, they only appear when conditions are met
CALDO has 15 different signals categorized by time and scenario, such as “pullback in an uptrend,” “rebound to broken support,” “breakout of the Asian session band,” and “a second stop at the high after a pullback.” They do not appear merely because shapes resemble each other; they appear only when conditions and additional checks are passed. On this day, out of 15 types,13 kinds appeared not at all. There are long periods when nothing appears, which is also part of the rules.
② For each signal, the take-profit and stop-loss placement differ
Rather than applying one rule to all signals, the profit/loss shapes are adjusted by scenario. For the morning buy, the take-profit target was 7.40 dollars from the entry, and the stop-loss target was 14.80 dollars.A signal that aims to win by taking profits close is used. For the night sell, the take-profit target is 65.95 dollars ahead, and the stop-loss target is 9.25 dollars.Even if the number of losses is high, signals that win big when they hit exist. In the previous week (Oct 26–30), another signal of the “big take” type yielded +12,357.00 USD with a win rate of 47.1% and PF 2.25.
③ A research approach where you record the conditions first and then verify
Before verification, you record the conditions, timeframe, and acceptance criteria, and you keep both wins and losses in a ledger after deducting costs like spread. (There have been 65 judgments to date.) Compared with trades entered at random times, signals that looked good by chance are discarded.
Do not try to reassure yourself with the number of signals; instead, use signals divided by scenario and pursue wins with profit/loss shapes suited to each scenario.This is supported by research records and full disclosure of results. This is CALDO’s novelty.
What you need to do is only three things
① Decide whether to enter when the light blue up arrow (buy) and orange down arrow (sell) appear
② Place a stop-loss order at the orange dotted line (stop-loss target)
③ When the yellow star appears, settle the position
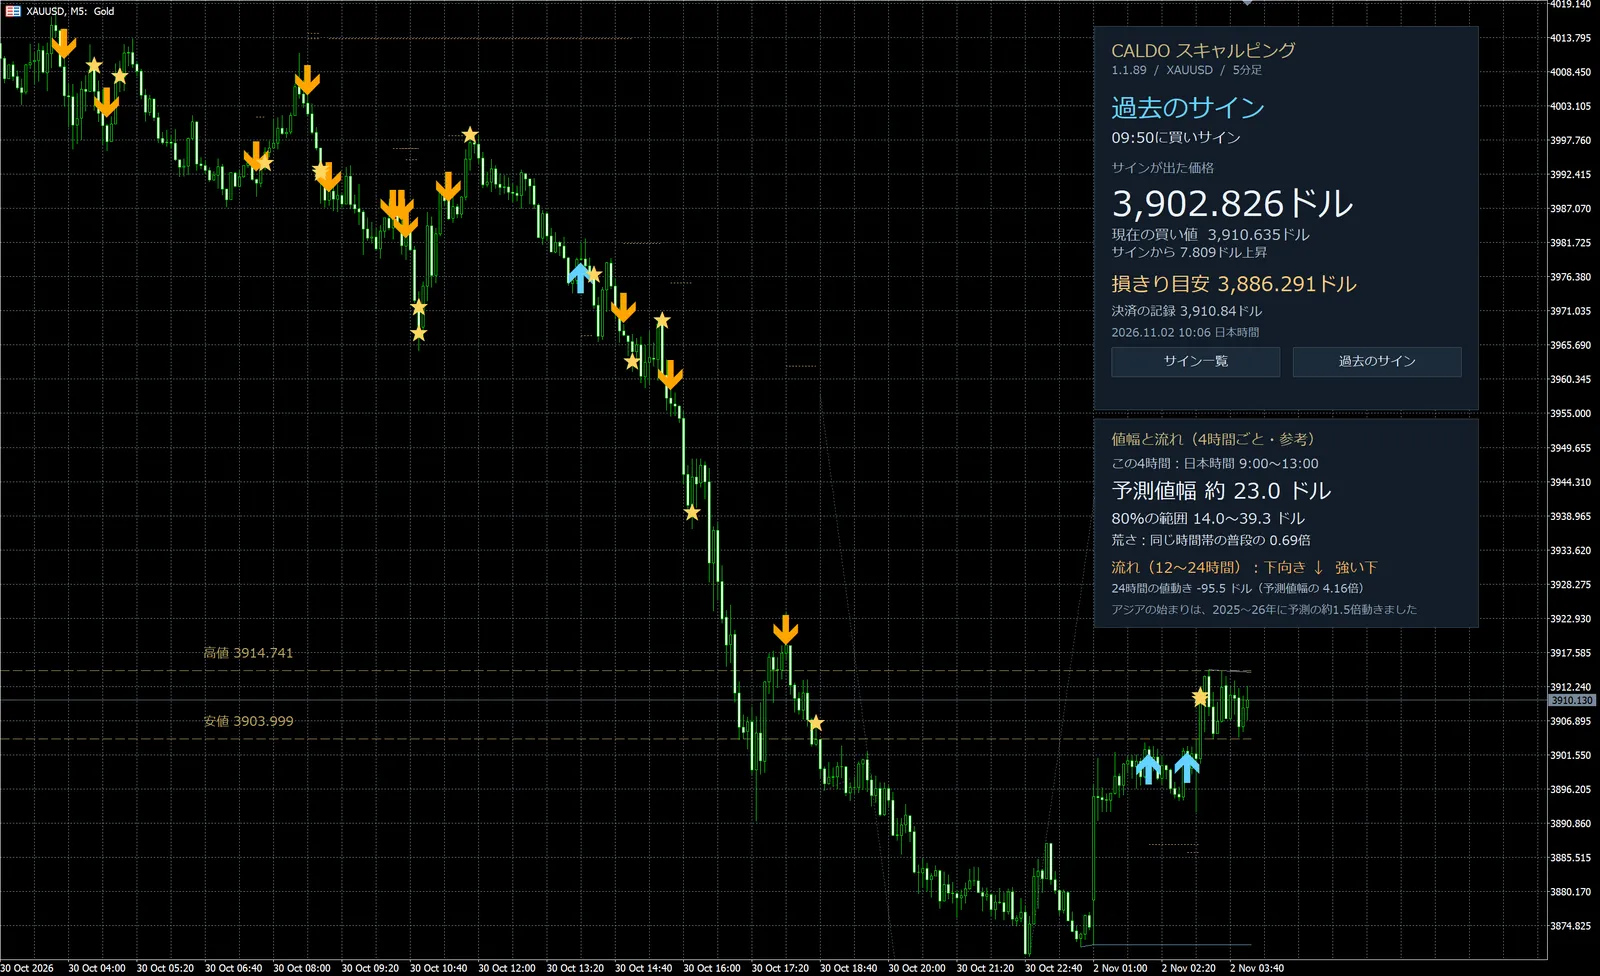
This is CALDO’s actual screen (OANDA MT5, XAUUSD 5-minute chart, a display example captured on November 2. It is not the screenshot for this article's records). The right panel shows the signal price, stop-loss target, and settlement records in Japanese.
The three trades of the day were settled within 47 minutes to 1 hour 25 minutes after entry. All were settled within the same day; there was no carryover.
What can be learned going forward (Registration required, free)
From here, you will see each of the 3 signals one by one, with price and targets.
• Buy in the 9 o’clock hour in the morning and buy in the 22 o’clock hour at night. Where you entered and how long it took to reach the take-profit target
• Whether the 21:11 sell reaches the stop-loss target.If the distance to the stop-loss is 9.25 dollars, how much would you lose per 1 lot
• Which signals did not appear among the 15 types on that day and why
• The totals (20 signals) from the previous week: PF and win rate
The continuation is available by signing up for access (free).
About this record:The record was produced by running a recording version of CALDO GOLD SIGNAL 1.1.98 with the same signal contents on the MT5 of a securities company I use for recording (no orders were placed). A day is defined from 7:00 a.m. to 6:00 a.m. Japan time. The November 2 data were recreated on November 5 by replaying the actual price history of that broker with the same program. P/L is calculated including the spread, for 1 lot (100 ounces), with no fees, swaps, or slippage. These are the results of trading exactly as CALDO signals indicated, not the author’s actual trades. A single day’s results do not determine overall performance and do not promise future results.