

Why the "gap" between higher timeframe and lower timeframe becomes a chance ~ How to find pullbacks and retracements with Breaks
The higher timeframe is rising, the lower timeframe is falling. Which one should you trust?
In the previous article, I introduced the idea of judging breaks of highs and lows by closes rather than wicks. This is a continuation of that discussion.
When you view the market across multiple timeframes, you often encounter situations like this: the 4-hour chart is in an uptrend, but the 15-minute chart shows a downtrend. Should you buy or sell, and your hands hesitate.
In fact, this misalignment between higher and lower timeframes is precisely the entry point for seeking pullback buys and retracement sells. In this article, I’ll organize that thinking using close breaks (Breaks).
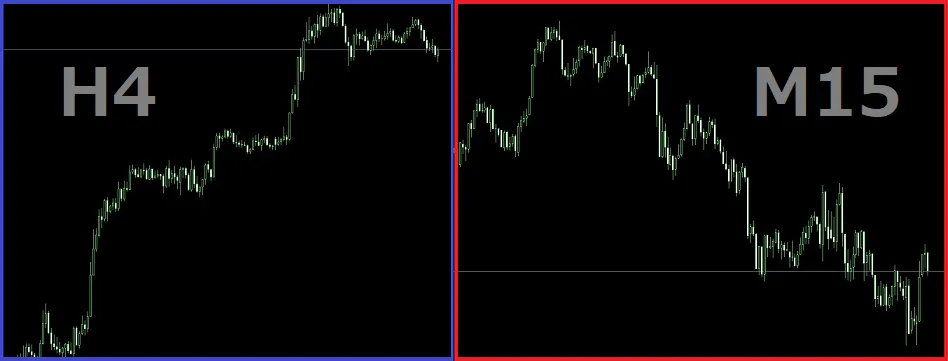
A pullback on the higher timeframe can look like a downward trend on the lower timeframe
Pullbacks and retracements on higher timeframes appear as a single trend when viewed from a lower timeframe. Therefore, it is natural, not abnormal, for the directions to be misaligned between higher and lower timeframes.
Even in an uptrend on the 4-hour chart, price does not rise in a straight line. It goes up, then down, then up again in waves. When you magnify the downward portion on the 15-minute chart, it can look like a pronounced downtrend with lower troughs being broken.
In other words, when the higher timeframe is rising and the lower timeframe is falling, it may be in the middle of forming a pullback on the higher timeframe. The question is when that pullback ends.
The opportunity is the moment the lower timeframe returns to the direction of the higher timeframe
The rule of thumb for judging the end of the pullback is the exact timing when a Break (close break) in the same direction as the higher timeframe is confirmed on the lower timeframe. The flow for an upmove is as follows (the downflow is the exact reverse):
- The higher timeframe is in an uptrend.
- The lower timeframe shows a downtrend (i.e., the pullback on the higher timeframe is underway).
- In the lower timeframe, a Break that closes above the most recent high is confirmed.
- The downward move on the lower timeframe collapses, signaling a return to the upside on the higher timeframe.
What matters here is that the higher and lower timeframes are not moving in the same direction from the start. When both are rising, you’re already at risk of chasing after the move at the top. By first diverging and then aligning, you can target pullbacks at relatively lower levels.
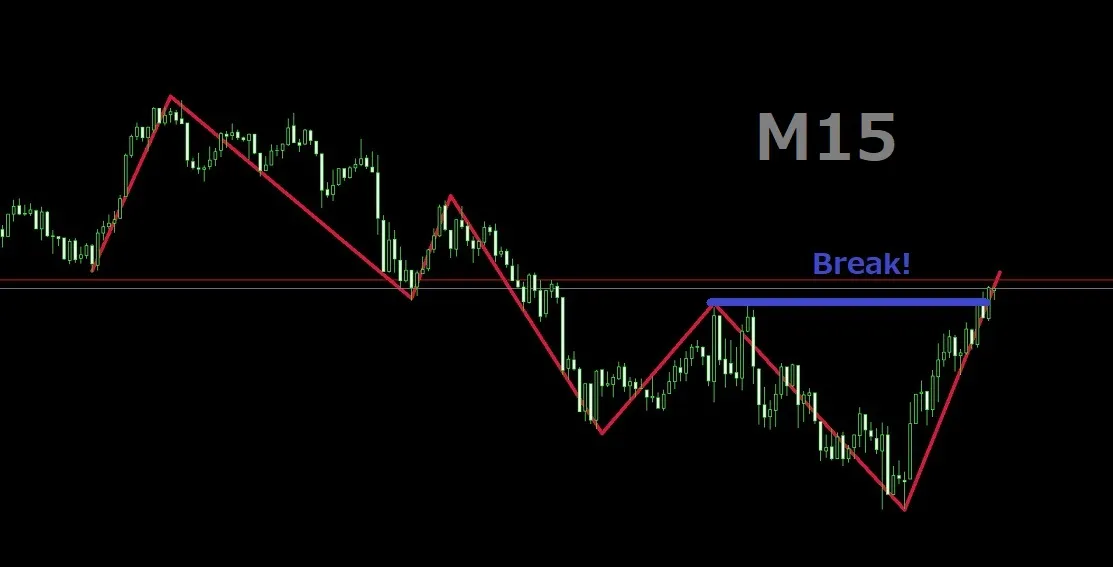
Break without jumping on immediately
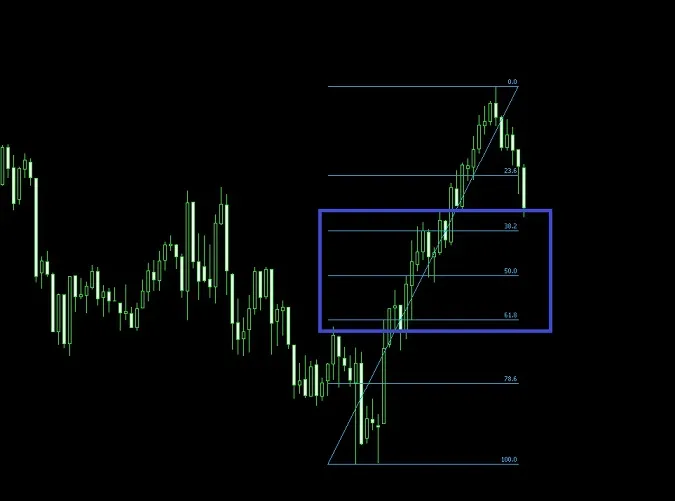
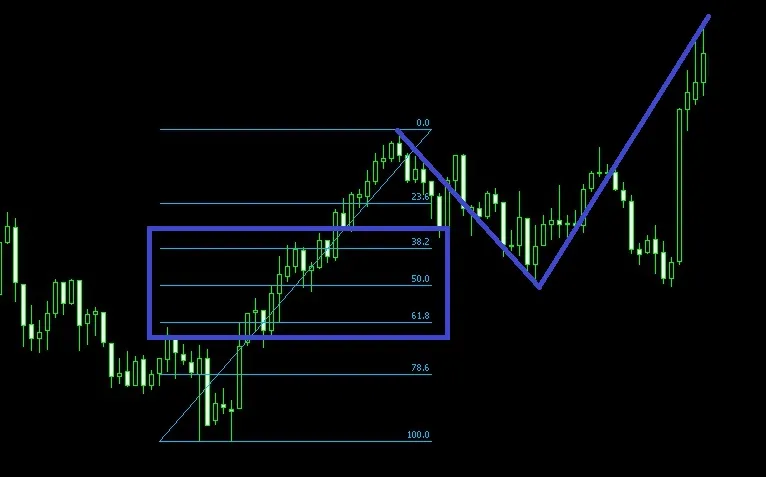
Once a Break is confirmed, it is advisable to wait for a retrace before entering. The Break bar has often moved a lot already, and entering here can widen your stop loss.
Fibonacci can be used as a retrace guide. For an upmove, apply Fibonacci from the low just before Break to the current high.
Retracement depth varies each time. Rather than fixating on a single level, view multiple levels as candidates to better handle missed entries or overly deep retracements.
Visuals with Close Break Pro
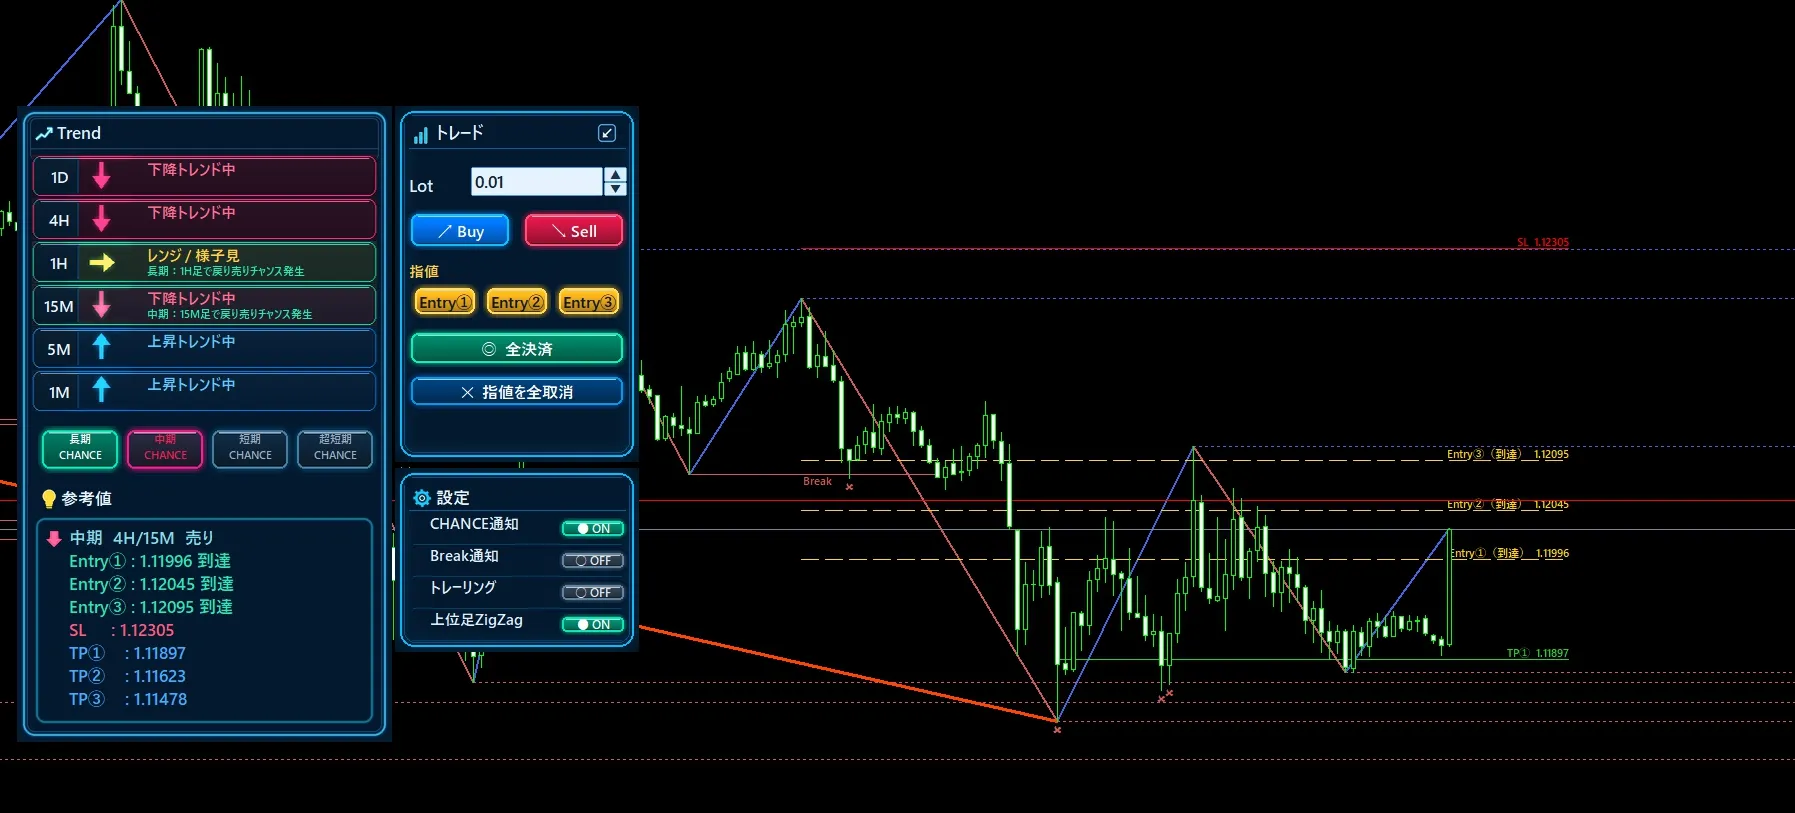
Up to this point, you can see the flow of “searching for the moment of alignment after misalignment and waiting for the retrace” on a chart with the MT4/MT5 EA Close Break Pro. You make trading decisions and place orders yourself, while Close Break Pro helps organize the situation and manage settlements.
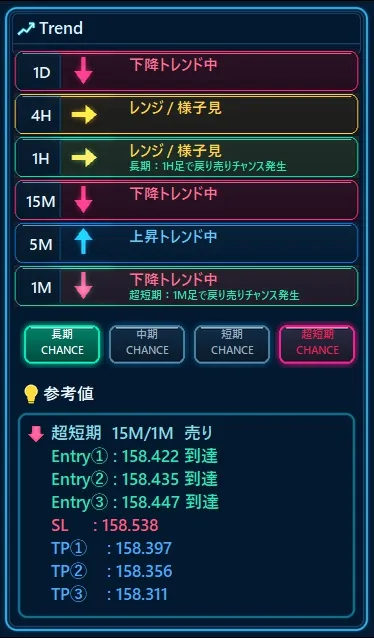
Status panel:1D・4H・1H・15M・5M・1M timeframes are displayed at a glance as whether they are in a trend (↑↓) or range (-).
CHANCE display:Indicates when the higher and lower timeframe combinations meet the chance criteria. There are four combination types.
Entry・SL・TP guidance:When CHANCE occurs, price targets based on Fibonacci are displayed on the chart.
Higher timeframe ZigZag display:Allows overlaying the higher timeframe waves onto the same chart.
Stepwise trailing:When ON, as TP is reached, SL is progressively raised to protect profits while letting gains run.
cautions for use
CHANCE is a signal that conditions are met, not a guarantee of profit.
- You cannot beat the higher timeframe reversal:What you thought was a pullback may instead be the start of a higher timeframe trend reversal. Always place a stop loss.
- Retrace may not occur:After a Break, sometimes price continues higher without retracing. If you didn’t enter, it’s fine to pass.
- Choose combinations on your own timeframe:If you cannot view the chart frequently during the day, choose longer-term or mid-term for decision-making; if you want quick decisions, choose short-term or ultra-short-term.
- First verify on a demo or tester:It’s recommended to try how it appears for your instruments and timeframes before using it live.
Summary
When higher and lower timeframes diverge, it is not a moment of confusion but a moment to look for pullbacks and retracements.
- Pullbacks and retracements on the higher timeframe appear as opposing trends on the lower timeframe.
- When a Break in the same direction as the higher timeframe is confirmed on the lower timeframe, it signals that the pullback/retracement is ending.
- After a Break, do not jump in; wait for retracement using Fibonacci as guidance.
This flow can be seen in the panel and chart display of Close Break Pro. There are MT4 and MT5 versions, with a user manual (PDF). A 3-day trial is also available to test the software before purchasing.
▶ Close Break Pro (MT5 version) here
▶ Close Break Pro (MT4 version) here

▶ Previous article “Which to believe, the wick break or the body break?”
※This article does not endorse any specific trading. Investment decisions should be made at your own risk.
Marcy's factory ― Build tools for traders.