

[Thorough Analysis] AI Rig Gold | 1 Month Performance M1・M5 | Aggregation period: October 5, 2026 to November 4, 2026 (31 days)
AI Rig Gold: Thorough analysis of 31 days of trading data!
This data is not a backtest!
A genuine, live trading track record being streamed on YouTube!
This time, we will read the trading results of the gold-dedicated trading system “AI Rig Gold” in detail from the numbers.
AI Rig Gold conducts YouTube LIVE streams in four timeframes: M1, M5, M15, and M30. From those, this time we focus on the higher-volume trading intervalsM1 (1-minute) and M5 (5-minute).
Win rate, profit factor, trade direction, win streaks and losing streaks, drawdown, and current LIVE operation. Let’s review not only the good numbers but also the losses.

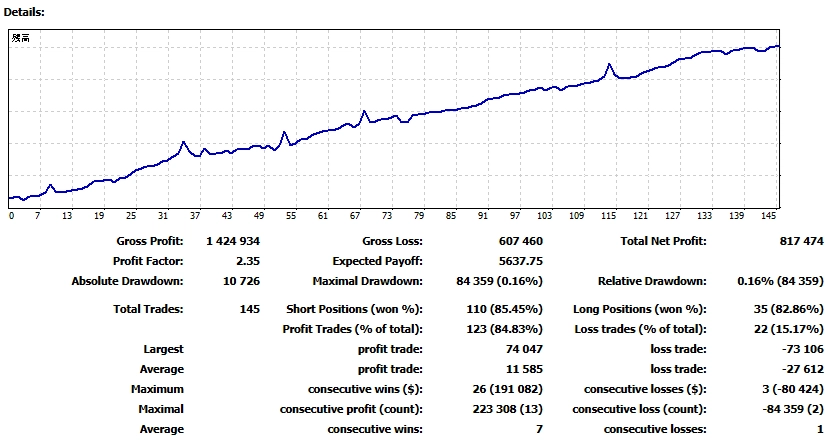
First, what draws attention is,the 145 trading instances. Of these, 123 were profitable trades, with a win rate of 84.83%.
Profit factor (PF) is 2.35. This indicator is total profit divided by total loss, meaning in this aggregation total profit was 2.35 times total loss.
The profit/loss trend graph shows fluctuations mid-way but overall trends upward.
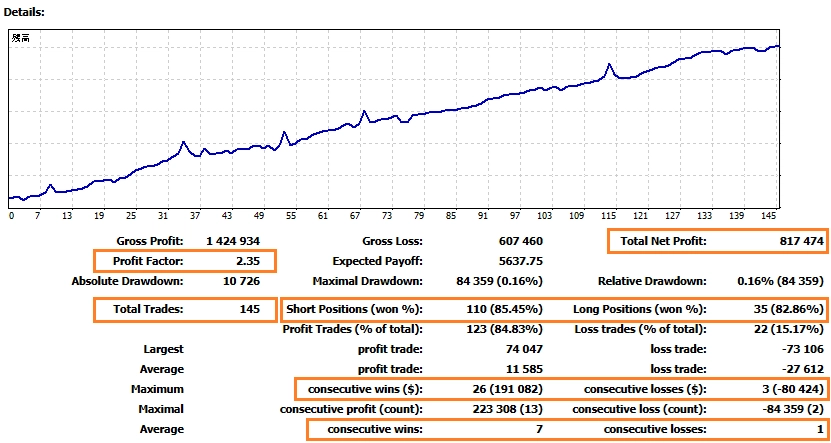
Of the total 145 trades, SELL occurred 110 times and BUY 35 times. SELL trades were about 3.1 times the BUY trades.
On the other hand, it wasn’t that all trades were SELL-only. BUY also occurred 35 times, with win rates of 85.45% for SELL and 82.86% for BUY.In this aggregation, both directions exceed 80% win rate.
Not limited to one-direction results, it is also notable that there are results for both BUY and SELL directions.
Let’s look at the price movement of XAUUSD during the aggregation period. In the following H1 chart, the overall downward trend is visible.
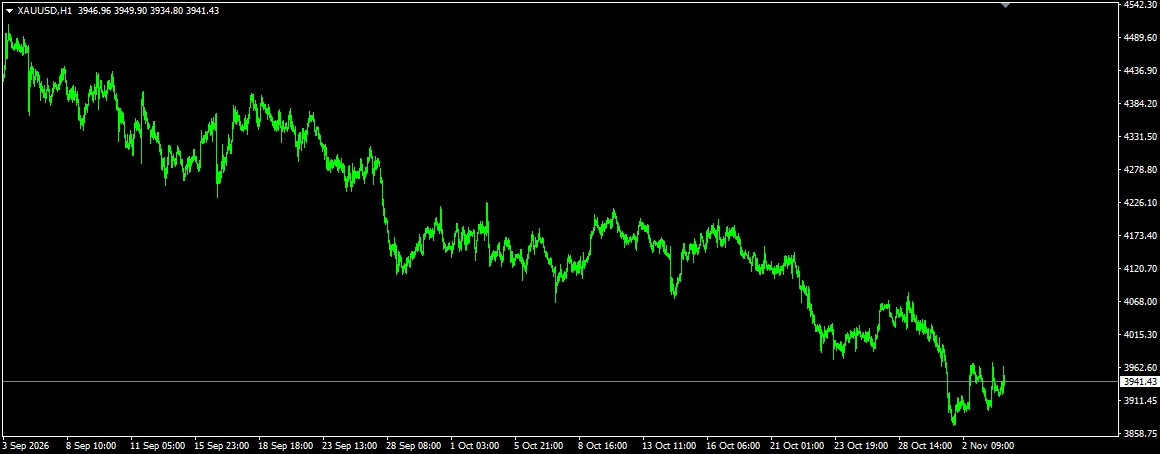
In a downward-trending market environment, SELL trades occurred more frequently.
We cannot conclude market adaptability solely from the distribution of trade counts, butcorrelating market direction with actual buy/sell breakdownis important for understanding the trading results.
The maximum winning streak was 26 trades. Conversely, the maximum losing streak was 3 trades.
The maximum drawdown was 84,359 yen (0.16%). The average profitable trade was 11,585 yen, and the average losing trade was 27,612 yen.
Even with a high win rate, a single loss can exceed the average profit of winning trades. It is necessary to evaluate not only win rate but also the balance of profits and losses.
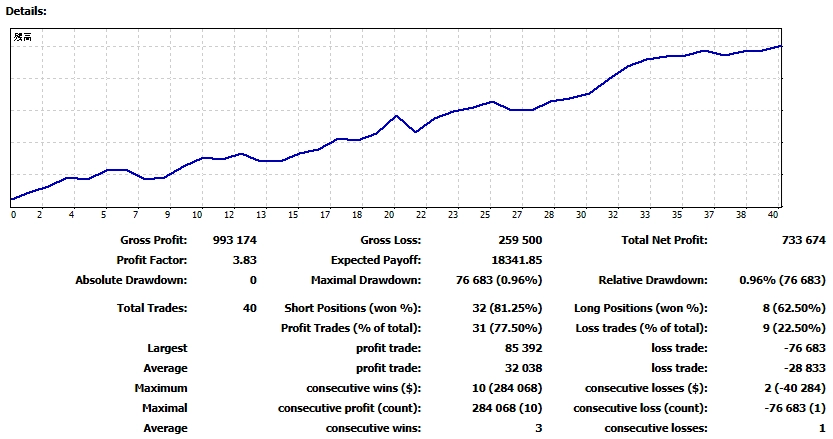
M5 trades are 40 in total. Compared with M1's 145, it is fewer, but the aggregation yieldsPF 3.83 as a result.
Win rate is 77.50%. It is lower than M1’s 84.83%, but PF exceeds M1’s 2.35.
This is where the comparison becomes interesting.A high win rate does not necessarily coincide with a superior ratio of profits to losses.
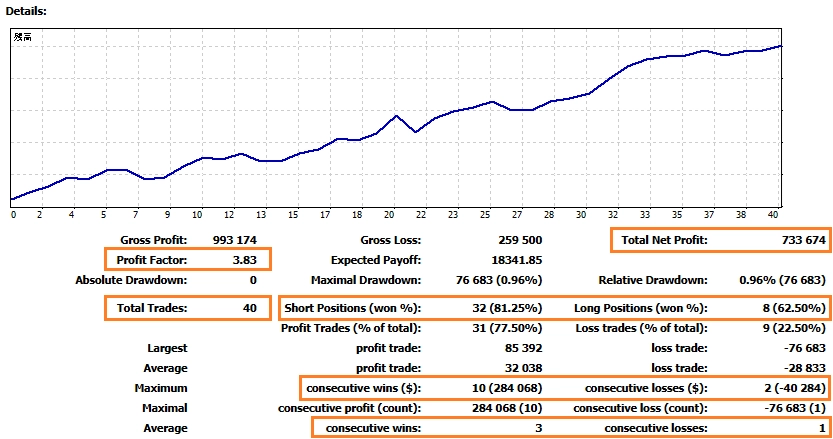
SELL 32 times, BUY 8 times. SELL remains more frequent here as well.
SELL win rate is 81.25%, BUY is 62.50%. As with M1, both directions are observed, but since BUY trades are only 8, the number of trades must be considered when evaluating win rate.
Maximum winning streak is 10, maximum losing streak is 2. Maximum drawdown was 76,683 yen (0.96%). Given the 40-trade aggregation, please note this may not repeat in future markets.
M1 emphasizes the number of trades and win rate; M5 highlights PF. The aim is not to declare one timeframe superior, but to understand the characteristics per timeframe.
| Indicator | M1 | M5 |
|---|---|---|
| Net profit | 817,474 yen | 733,674 yen |
| Number of trades | 145 | 40 |
| Win rate | 84.83% | 77.50% |
| PF | 2.35 | 3.83 |
| Max winning streak | 26 | 10 |
| Max losing streak | 3 | 2 |
From here, apart from the 31-day aggregation report,we will introduce the operation screen being published on YouTube LIVE since August 14, 2026.
In addition to the current trading status, the left side of the screen shows a profit/loss trend graph since the operation began. Please pay attention to both the numbers and the graphs.
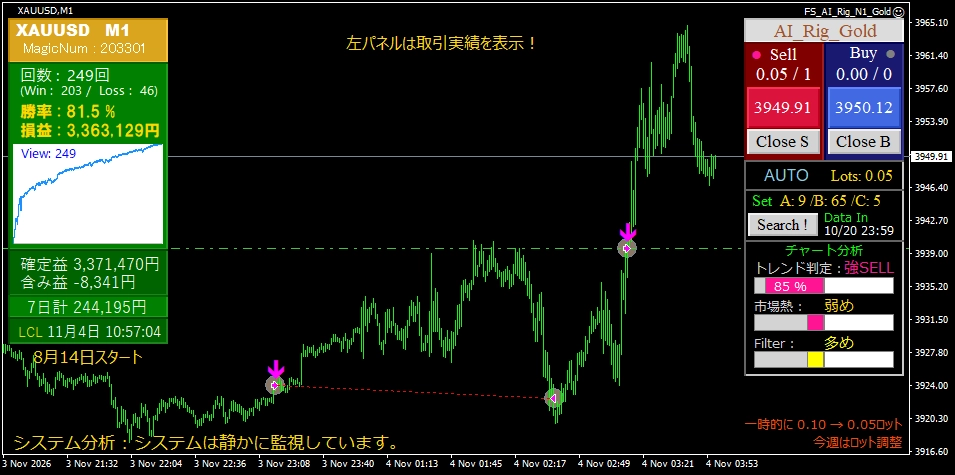
M1 cumulative profit and loss shows +3,363,129 yen. Realized P/L 3,371,470 yen, unrealized P/L −8,341 yen. The P/L trend graph is upward overall, including fluctuations mid-way.
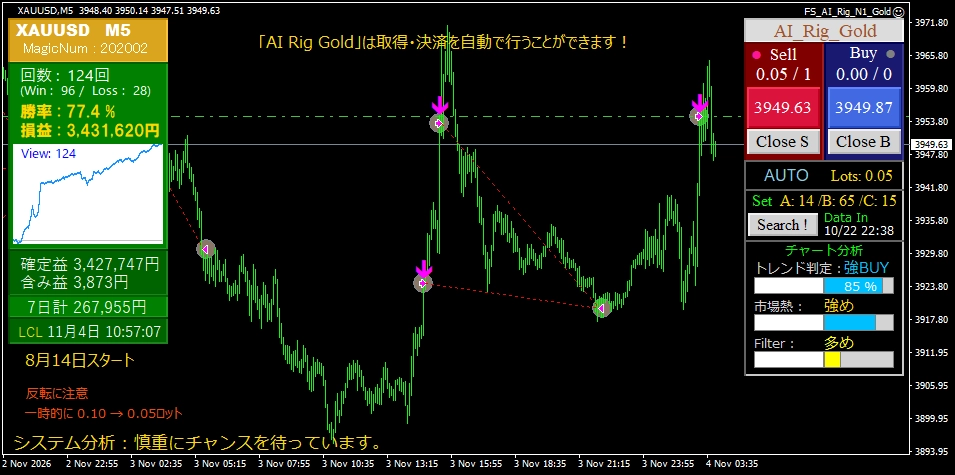
M5 cumulative profit and loss shows +3,431,620 yen. Realized P/L 3,427,747 yen, unrealized P/L +3,873 yen. This too shows an overall upward trend in the P/L graph.
As shown on the LIVE screen, due to current market conditions, the lot size has temporarily been reduced from 0.10 to 0.05. Operating conditions are not fixed and are adjusted with risk in mind.
The appeal of LIVE streaming is that you can see charts and trading status in real time.
However, LIVE streams do not guarantee that all settings and trading conditions remain unchanged. The numbers shown are the results at the time of filming and do not indicate future performance.

AI Rig Gold is a trading system designed to analyze gold price movements. It analyzes trend direction and market conditions to support entry, position management, and settlement. While the current performance cannot prove the effectiveness of each feature individually, please pay attention to the design philosophy as well.

In addition to XAUUSD-specific design, there is analysis of historical data with Search!, a second engine that can operate when needed, and trading styles that are discretionary, semi-automatic, and fully automatic. For details on functions and trading cautions, please check the product page.
In addition to the AI Rig Gold described here, we offer Core_iX, which can be used across a wide range of currency pairs.
You can choose from MT4 or MT5 versions to suit your environment.





In conclusion
The 31-day result shows distinct characteristics for M1 and M5, respectively.
Win rate, PF, number of trades, buy/sell directions, and profit trend. If you interpret the numbers one by one, you can gain a more concrete understanding of AI Rig Gold’s operation examples.
Note: The figures shown are past results displayed in the respective aggregation reports and LIVE screens. Results may change depending on aggregation period, operating conditions, account funds, lot sizes, and market conditions. Past performance does not guarantee future profits, and trading involves the risk of losses.