

[Indicator Report Card Episode 8] A report card for tools that measure momentum — comparing Momentum, ROC, PPO, and TSI to choose
“What’s the difference between momentum and ROC? They look quite similar.”
“I hear about PPO, TSI, but I don’t know which one to start with.”
These kinds of voices often reach us at the Indicator Institute.
Many people think that if the name is different, the contents are different too, and that one of them must be the correct choice. But essentially, all of them are tools to measure “how much the current price has moved compared to a little earlier,” and the difference lies only in “what you compare against” and “how smoothly you smooth it.”
In this article, we line up four indicators—Momentum, ROC, PPO, and TSI—like a report card and compare them, aiming to help you say, “I would start with this one.”
About this series (Indicator Report Card)
This is a serial that compares indicators, which have been explained one by one, side by side by purpose.
Please refer to the standard indicators 30 lessons and classic custom indicators 70 lessons for each explanation.
1. The lineup of this time and the yardstick for comparison
The lineup this time consists of the following four.
- Momentum: A straightforward momentum tool that compares the current price with a price a certain number of bars ago. The MT4 standard center is 100.
- ROC (Rate of Change): The same comparison expressed as “how many percent” moved. Centered at 0 (varies by implementation).
- PPO (Percentage Price Oscillator): The difference between the short-term and long-term moving averages expressed as a percentage. A percentage version of MACD.
- TSI (True Strength Index): A line that smooths price movements twice to show whether movement is biased toward up or down.
Think of momentum as the car’s speedometer at this very moment. Momentum is the needle movement right now. ROC reinterprets the same needle in percent terms. PPO is the average speed over a somewhat longer period. TSI smooths even more, like a fuel economy display that reduces wobble.
Note that Momentum and ROC have almost the same shape, differing only in the center (100 vs 0) depending on implementation.
The yardsticks for comparison are fourfold.
- Responsiveness: “How quickly the signal changes after a change in price.”
- Fewer whips: “Less whips due to noise.”
- Readability: “How easy it is to read the line on the chart.”
- Beginner-friendliness: “Like the first bike.” It’s more highly rated when included in the standard menu.
Responsiveness and whips are like a seesaw: the faster you are, the more sensitive to small swings; the smoother you smooth, the slower you respond.
Only Momentum is in the standard menu (Insert → Indicators → Oscillators → Momentum). ROC, PPO, and TSI are custom indicators not in the standard menu.
2. Each report card
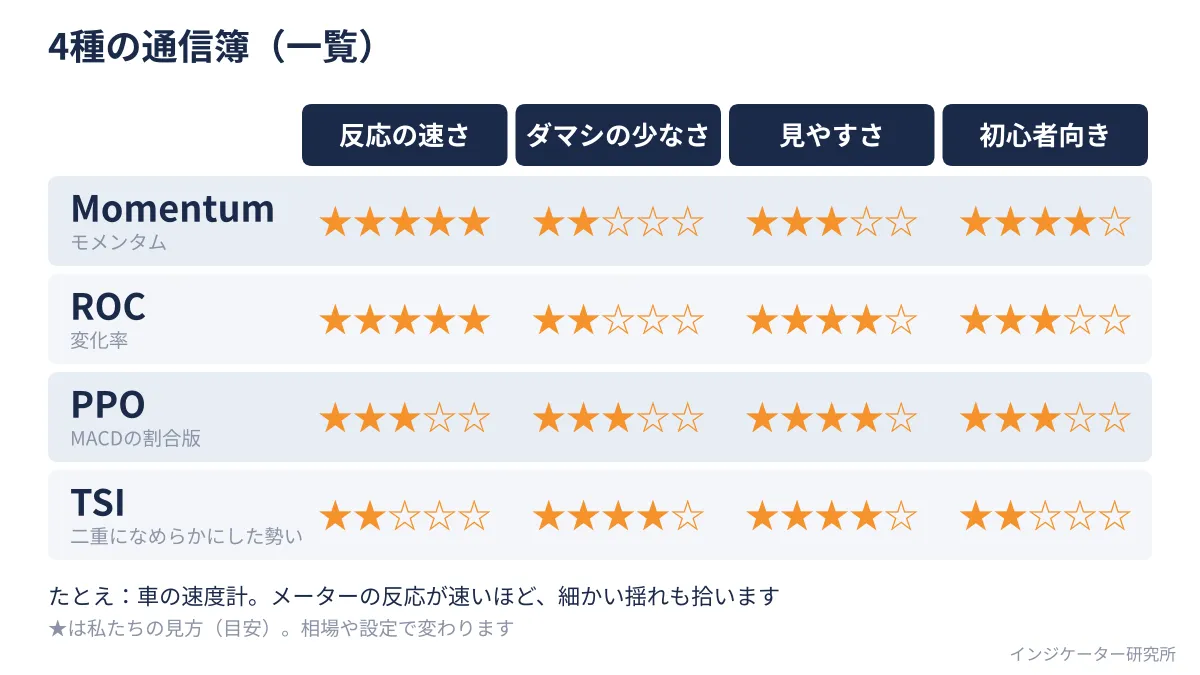
Evaluation is our view (a guideline) at the Indicator Institute and can vary with market conditions and settings.
Momentum report card
- In a word: “A responsive, straightforward speedometer that moves with the needle.”
- Strengths: Fast reaction, quickly shows acceleration and deceleration. Included in the standard menu with a single setting for period.
- Weaknesses: The needle can whipsaw with small price fluctuations, causing the line to look jagged. Center is 100, so it may take getting used to.
- ★ Evaluation (guideline): Responsiveness ★5 / Falses ★2 / Readability ★3 / Beginner-friendly ★4
ROC report card
- In a word: “Presents Momentum in percent—a twin with the same face.”
- Strengths: Very reactive. Centered at 0, so you can intuitively read it as “positive up, negative down.”
- Weaknesses: Can be jagged. Not in the standard menu and may look different depending on the distributor.
- ★ Evaluation (guideline): Responsiveness ★5 / Falses ★2 / Readability ★4 / Beginner-friendly ★3
PPO report card
- In a word: “The difference of moving averages in percent—a calm, mid-weight tool.”
- Strengths: Since it’s based on moving averages, the line is smoother than Momentum. Easy for those familiar with MACD. Being a percentage makes cross-asset comparisons easier.
- Weaknesses: Because it averages, the reaction is slower than Momentum. Not in the standard menu; the presence of a signal line depends on the implementation.
- ★ Evaluation (guideline): Responsiveness ★3 / Falses ★3 / Readability ★4 / Beginner-friendly ★3
TSI report card
- In a word: “A fuel economy display that shows a gentle, broad trend.”
- Strengths: Very smooth line that is less swayed by small fluctuations. Easy to read large trends’ strength and weakness.
- Weaknesses: Among the four, it is the slowest to react. In fast moves, the line lags as it smooths. Not in the standard menu; calculations can differ by distributor.
- ★ Evaluation (guideline): Responsiveness ★2 / Falses ★4 / Readability ★4 / Beginner-friendly ★2
To use ROC, PPO, or TSI, place the obtained file (.mq4 or .ex4) into File → Open Data Folder → MQL4 → Indicators, restart MT4 (or refresh the navigator), and pick from “Custom.” Do not use files with unclear sources due to virus or tampering concerns. Default values differ by distributor; these numbers are common reference values, so please check your parameter screen.
The list of evaluations is shown in Figure A.
3. How you see them when lined up on the same chart
Now, let’s line them up on synthetic data created by random numbers. It’s an uptrend, a downtrend, and a range, not real market data. The periods are Momentum 14, PPO 12 and 26, TSI 25 and 13. Momentum and ROC have the same shape, so they’re treated as one.
As shown in Figure B, in an uptrend, all lines stay above the center line. However, the momentum line hits ahead of price highs. In this fictional data, around 20 bars before the price peak, all three lines tilt downward. This shows “price is still rising, but momentum is weakening.”
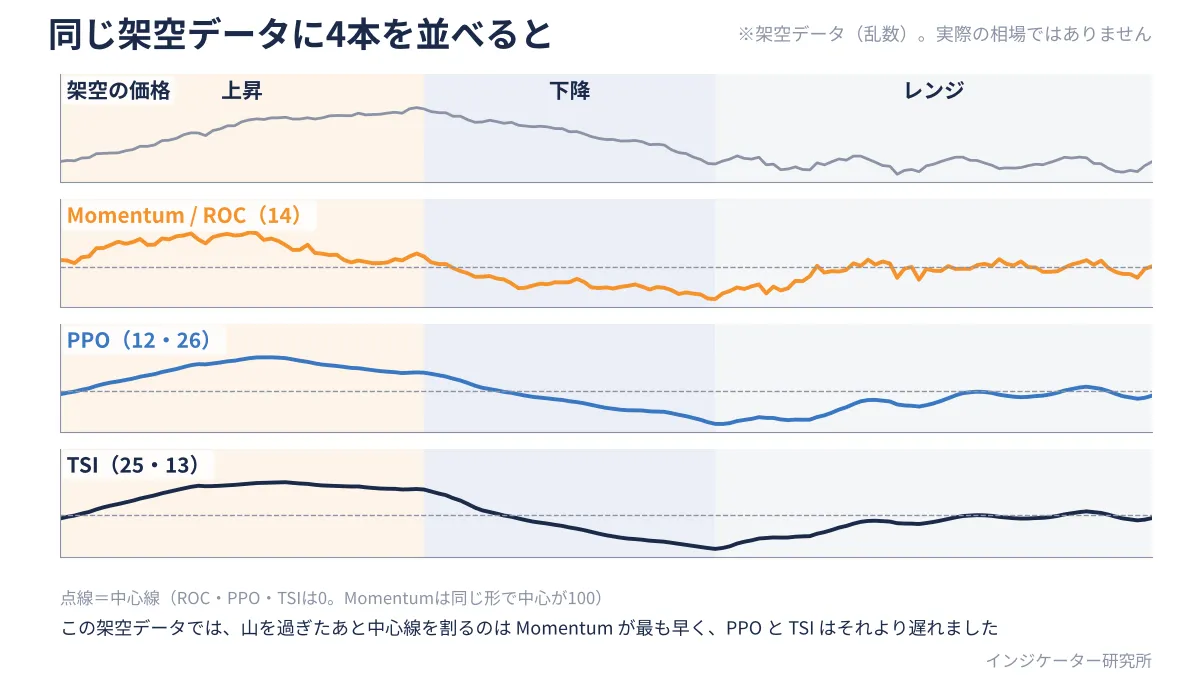
However, momentum weakening and price reversal are not the same. In this example, price continued rising near the top of the peak.
In downtrends, after the peak, there was a difference before crossing the center line: Momentum (ROC) about 5 bars, PPO and TSI about 12 bars. Readiness is not about “the turn before it happens,” but about “how quickly it reflects after a turn.”
In the latter 40 bars of the range, Momentum (ROC) crossed the center line 10 times, while PPO and TSI did so 2 times.
This is just one example with a single synthetic dataset; changing data or periods may change the appearance. We believe you should choose according to the setting and situation.
4. Favorable and unfavorable situations
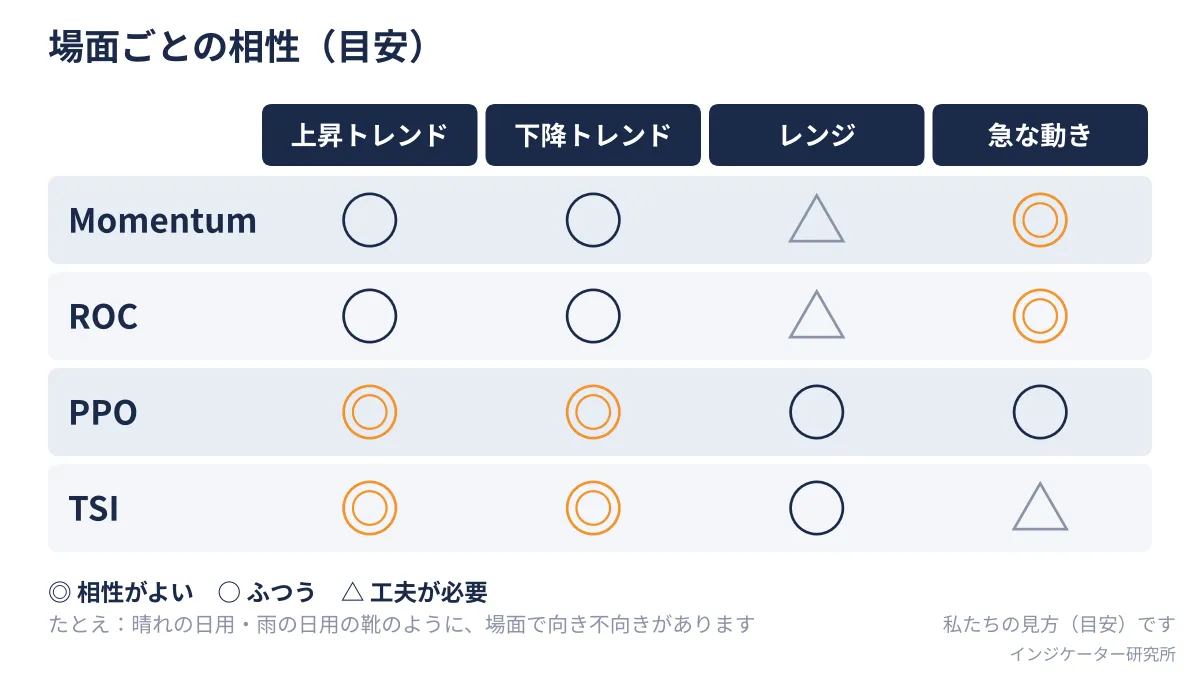
We summarize the compatibility by scenario in Figure C, which is also our guideline.
- Up/Down trends: PPO and TSI smoothly reflect strength of the move, so they feel favorable. Momentum and ROC show changes sooner but fluctuate more.
- Range: All lines hover near the center line. In particular Momentum and ROC cross the center line more frequently, requiring discretionary handling.
- Sharp moves: Momentum and ROC react fastest. TSI lags due to smoothing. However, it can return to the previous state soon after, so fast does not always mean correct.
5. Guidance by objective
From here, the answer to “which one should I use?” is given. This is not a single recommended indicator, but a guideline for you.
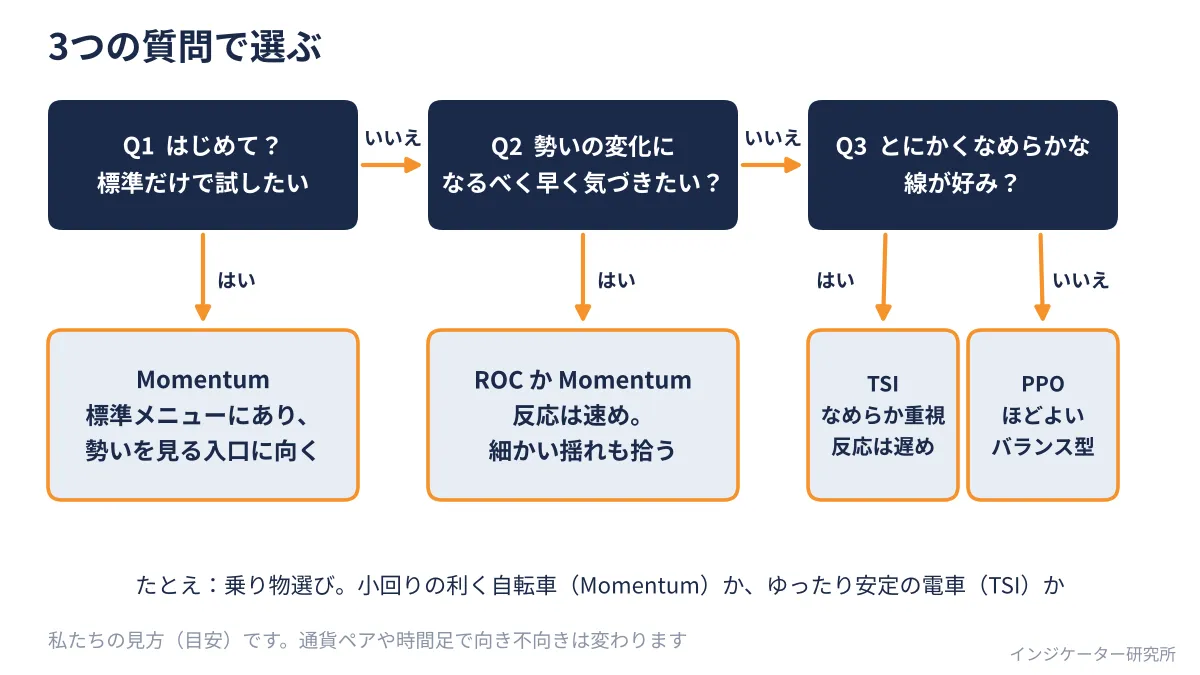
Case 1: You want momentum with only the standard menu
- Recommended combo: Momentum (with the period changed from the default 14)
- Reason: No file installation required; it serves as an entry point to see whether momentum has increased or weakened.
- Caution: It tends to be jagged, so avoid overreacting to every up-down in the line. Focus on whether the center line (100) is above or below and whether the direction has changed significantly.
Case 2: You want to quickly notice changes in momentum
- Recommended combo: ROC, or Momentum
- Reason: Both react quickly and show momentum weakening early. If you want it centered at 0 in percent terms, ROC is better
- Caution: The faster it is, the more false signals you’ll get. It’s prudent to view it alongside longer timeframe trends and moving averages.
Case 3: You want to see a large trend with a smooth line
- Recommended combo: TSI, or PPO
- Reason: They smooth the line, making it easy to read large trends. Especially TSI which is very smooth; PPO is accessible for those familiar with MACD
- Caution: As a result, the reaction is slower. You can treat it as a “confirming” tool.
The flow for choosing is summarized in Figure D. Answer the three questions in order to find the one that matches your goal.
6. Example how to combine
- Line up Momentum and TSI: Use Momentum for the current momentum, and TSI for the larger trend.
- Combine moving averages with Momentum (or ROC): MA indicates the trend direction, momentum shows its strength. Since the roles differ, this helps offset weaknesses.
- Look for divergence between price and momentum: When price makes a new high but the momentum line cannot surpass the previous peak, this is generally called a divergence. Many use it as a sign of weakening momentum, but it does not guarantee a reversal.
7. Precautions when using the report cards
- Whipsaws in ranges: All lines oscillate around the center line. Crossing the center line does not automatically indicate a reversal; treat cautiously.
- Evaluations are guidelines: ★ marks reflect our view; there are no hard numeric backing. Ranks can change with market conditions and settings.
- Do not over-tune settings: Constantly changing the period after failed attempts leads to chasing a line that fits the past. Keep a stable setting for a while.
What you can start today
- Remove Momentum from the standard menu and examine, on past charts, what happened after momentum weakened in three spots.
- Install one of ROC, PPO, or TSI you’re interested in, and compare which one changes direction first against Momentum.
- Answer the three questions in Figure D to decide which one matches your objective, and watch it for a while with that single line.
Summary
The four indicators that measure momentum are tools to show how much the current price moved compared with the near past. The differences lie in what you compare to and how smoothly you smooth it. In these report cards, we see the trade-off: faster reactions pick up finer fluctuations, while smoother lines show less fluctuation but react later.
To be honest about weaknesses: momentum lines only reflect current strength; they do not predict the future. Even if momentum weakens, prices can continue rising. The ★ rating is merely our guideline.
This article introduces general usage and does not guarantee profits. Actual trading should be done in a demo account or similar, based on your own judgment.
Next time is Episode 9, the report card of the MACD family. We’ll compare MACD, OsMA, Zero Lag MACD, and PPO.
We at the Indicator Institute will continue to arrange indicators by purpose and explain them clearly for easy comparison.