

[Indication Report Card Episode 6] RSI Family's Report Card ─ Comparing RSI, Stochastic RSI, Connors RSI, and CMO to choose
“There are so many RSI friends, I don’t know which is which.”
“I heard that Stochastic RSI is more sensitive and better; should I replace RSI with it?”
Voices like these often reach our ‘Indicator Research Institute.’
Many people think that anything with the name RSI is a superior version of RSI. But in essence, they are all tools that quantify which side—up or down—is currently prevailing. The difference is only how sensitively they are processed.
In this article, we compare four indicators—RSI, Stochastic RSI, Connors RSI, and CMO—side by side like a report card. By the end, the goal is to be able to say, “For my purpose, start with this one.”
About this series (Indicator Report Card)
This is a series that arranges and compares indicators that we have previously explained one by one, by purpose.
For each, please refer to the standard indicators 30 episodes and the classic custom indicators 70 episodes.
1. Current lineup and the yardstick for comparison
The current lineup consists of the following four:
- RSI (Relative Strength Index): a line that compares the most recent up moves and down moves and converts them into a 0–100 number. The most basic form
- Stochastic RSI: a line that repositions RSI values to indicate where within recent highs and lows they lie. The exact calculation details depend on the implementation
- Connors RSI: a line that averages three numbers (short-period RSI, number of consecutive up days and down days, and the rank of up/down magnitudes)
- CMO: a line formed from the difference between up moves and down moves, with a scale centered at 0 and ranging to ±100. Materials are similar to RSI
RSI can be likened to a tug-of-war. It expresses which side is dominating in the range of 0–100. Stochastic RSI re-evaluates the dominance by where it sits within the recent high and low, which can swing from end to end. Connors RSI is the average score from three judges, and CMO uses a scale that zeros the draw.
The yardsticks for comparison are four:
- Responsiveness: For example, when the signal changes, how quickly does the price react
- False signals: For example, a weather vane that doesn’t tilt with small breezes; how resistant to small fluctuations the line is
- Readability: For example, how easy it is to read the map lines; smoothness and clear up/down movements
- Beginner-friendliness: For example, how approachable it is like a first bicycle; ease of use
Responsiveness and avoidance of false signals are a seesaw relationship: speeding it up tends to increase false signals.
In MT4’s standard menu (Insert → Indicators → Oscillators → Relative Strength Index), RSI is the only one listed. The other three are custom indicators not in the standard menu.
2. Each report card
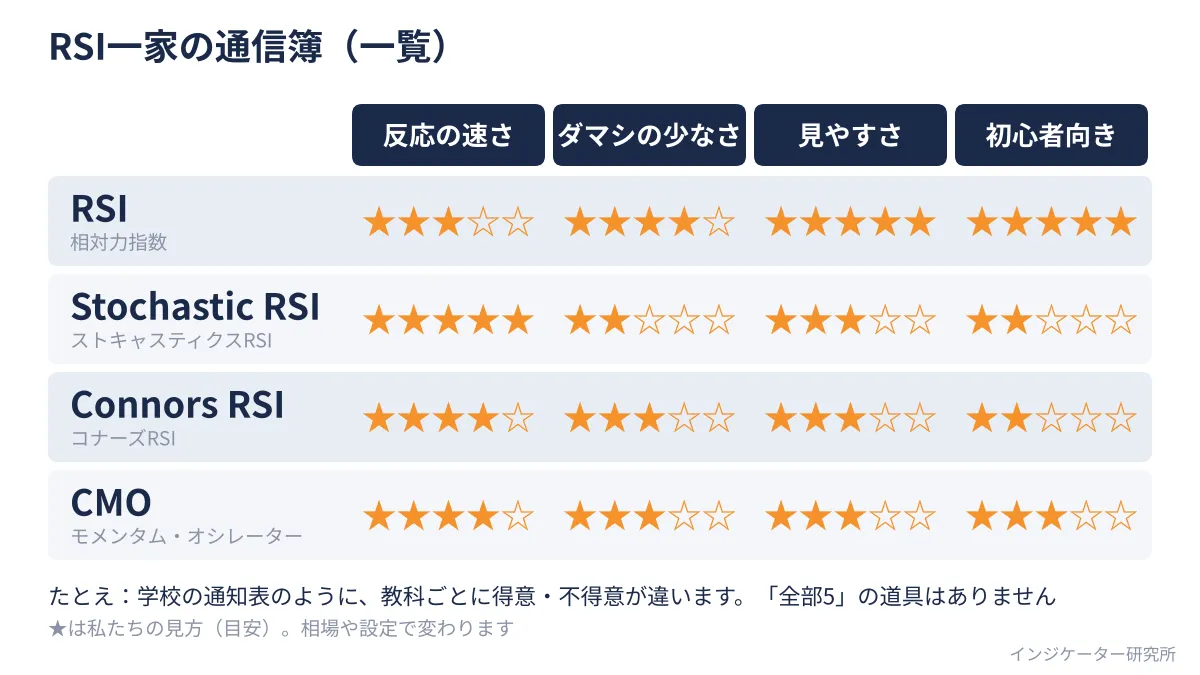
The evaluations are our own view (a guide) at the Indicator Research Institute. They are qualitative assessments based on how the lines are constructed and can vary with market conditions and settings.
RSI report card
- In short: “A basic, unremarkable thermometer.”
- Strengths: Smooth and easy to read highs and lows. Included in standard menu with extensive explanations
- Weaknesses: When there are strong upward or downward trends, it tends to cling near 70 or 30
- ★ Rating (approximate): Responsiveness ★3 / False signals ★4 / Readability ★5 / Beginner-friendly ★5
Stochastic RSI report card
- In short: “A high-performance mic with higher sensitivity, detecting even small sounds.”
- Strengths: Among the four, the fastest to react, good for timing pullbacks and rebounds
- Weaknesses: Frequently sticks at 0 or 100, lines wander jaggedly; signals are numerous and can be confusing. Common reference points are 20 and 80, though some distributions place 0–1 on the scale
- ★ Rating (approximate): Responsiveness ★5 / False signals ★2 / Readability ★3 / Beginner-friendly ★2
Connors RSI report card
- In short: “A sprinter looking for overreaches by three judges.”
- Strengths: Easy to spot sudden surges or declines; seems well-suited to contrarian thinking
- Weaknesses: Three components make it harder to intuitively understand why a value is what it is; lines can swing widely and may not suit riding a trend. Common references are around 10 and 90, but this varies by implementation
- ★ Rating (approximate): Responsiveness ★4 / False signals ★3 / Readability ★3 / Beginner-friendly ★2
CMO report card
- In short: “A RSI cousin that uses zero as a baseline.”
- Strengths: Easy to gauge direction of momentum by whether it’s above or below zero. Feels a bit quicker than RSI
- Weaknesses: Not included in standard menu and with fewer explanations. Similar to RSI, so there isn’t much new when placed side by side. A common reference is around ±50
- ★ Rating (approximate): Responsiveness ★4 / False signals ★3 / Readability ★3 / Beginner-friendly ★3
The three indicators not in the standard menu can be obtained by placing the downloaded files (.mq4 or .ex4) into “File → Open Data Folder → MQL4 → Indicators” and restarting MT4 (or refreshing Navigator), then selecting from “Custom.” There are many distributors, and some may contain viruses or tampered files. Do not use files with unclear origins. Check the initial values and appearance on your indicator’s parameter screen, as they vary by distributor.
The list of evaluations is shown in Figure A.
3. How it looks when lined up on the same market
Now, let’s overlay the four on a synthetic data series created with random numbers. It is not actual market data. The period values commonly seen are RSI14, Stochastic RSI 14/14, Connors RSI 3/2/100, and CMO14, with CMO scaled to 0–100 for easy comparison.
As Figure B shows, the first noticeable difference is the magnitude of movement. RSI and CMO move smoothly by a few points, while Stochastic RSI and Connors RSI can leap by tens of points from one bar to the next, producing jagged lines.
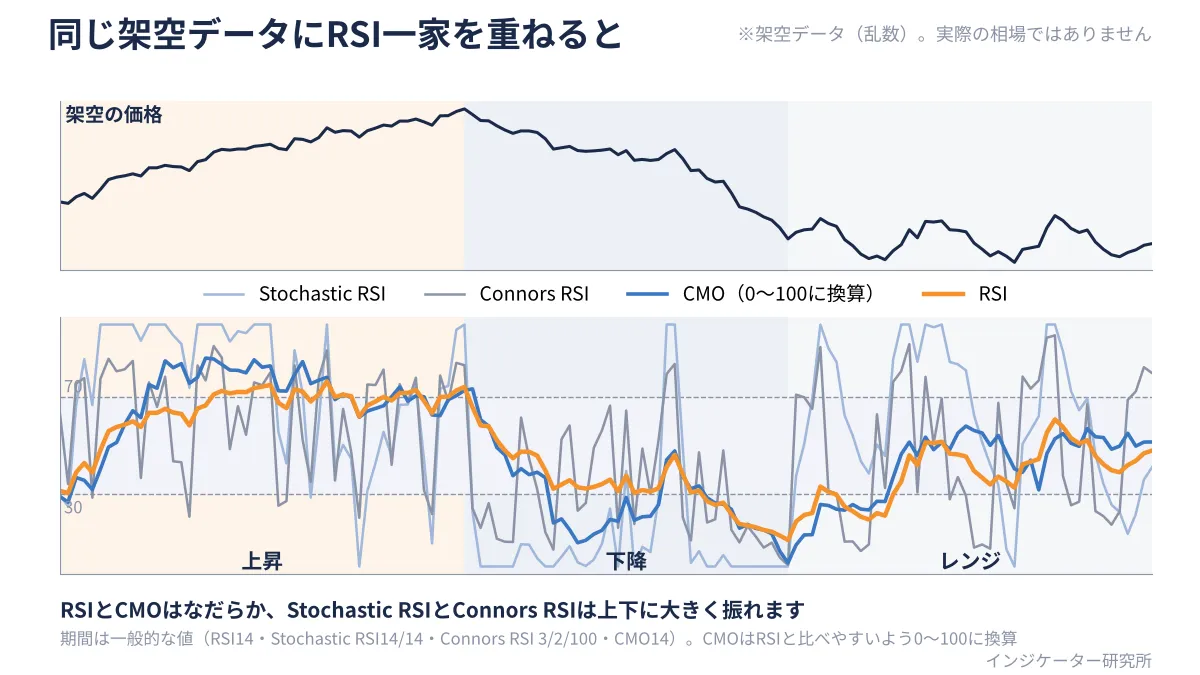
In rising phases, RSI repeatedly sits near 70. Even in overbought zones, prices continue to rise. Stochastic RSI also lingers near the upper edge. This shows that “being high does not guarantee a reversal.”
In the phase where it peaks and turns to decline, Stochastic RSI and Connors RSI drop below 50 in almost a single line. CMO takes about four bars, RSI about five. Yet the faster two lines sometimes bounce back strongly during declines. Fast does not equal correct.
In the later range, RSI stays around the middle and does not reach 70. Stochastic RSI oscillates between the edges; following all signals can become busy. However, this is just one example on synthetic data.
4. Favorable and unfavorable situations
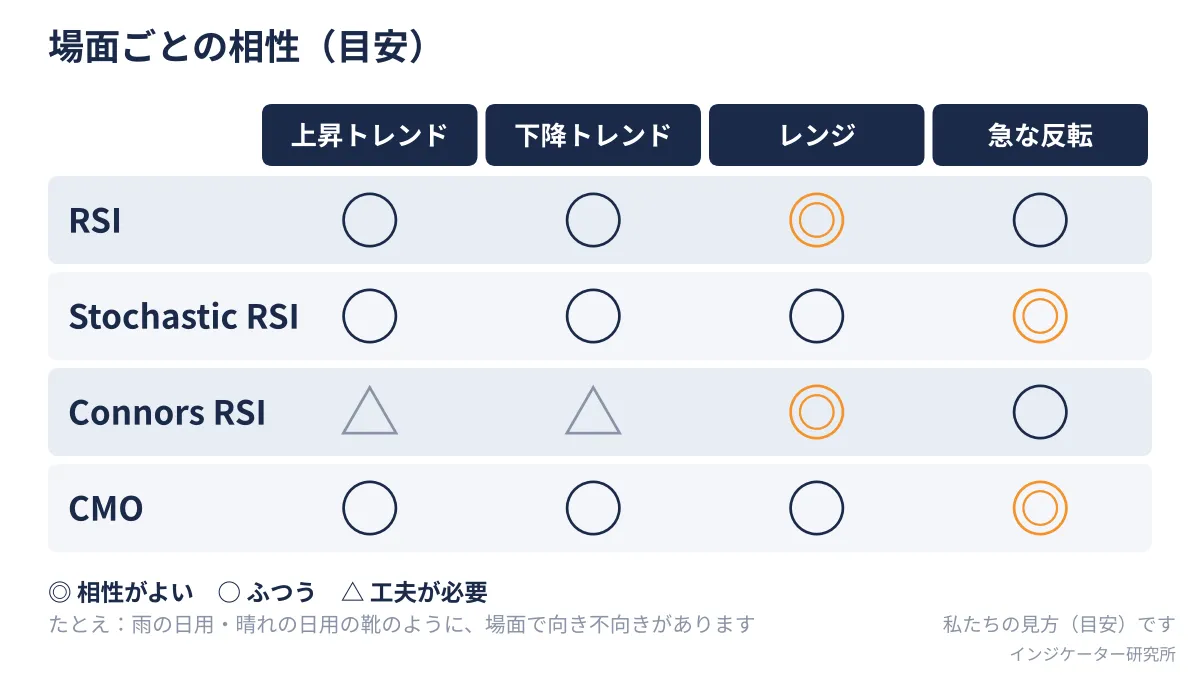
A summary of compatibility by situation is shown in Figure C. This is also our view (guide).
- Up/down trends: RSI, Stochastic RSI, and CMO are considered “neutral.” RSI requires caution for sticking near the extreme. Connors RSI leans toward contrarian behavior, so some creativity is needed. It’s safer to confirm direction with a moving average or another tool
- Range: RSI and Connors RSI make it easier to see rebounds from oversold/overbought conditions, so they pair well. Stochastic RSI and CMO yield more signals
- Sharp reversals: Stochastic RSI and CMO respond quickly. However, after changing direction, they may revert, so fast does not necessarily mean correct
5. Use-case guidance by objective
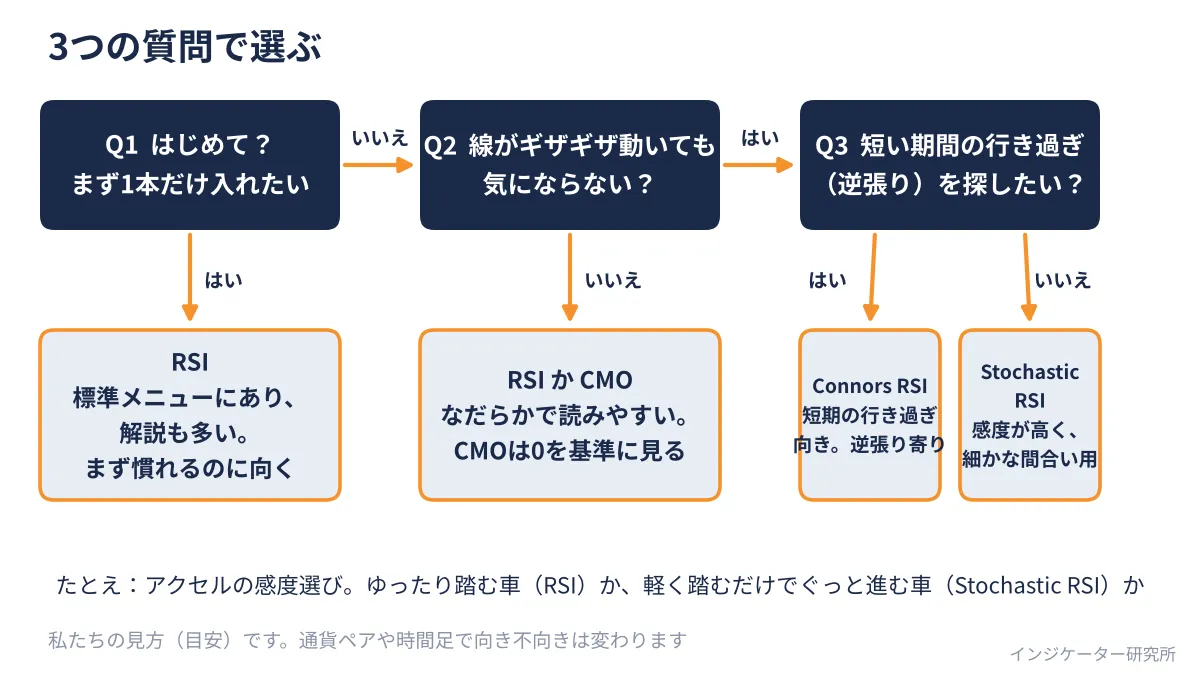
Here’s the answer to “Which one should I use?” It’s not about recommending a single best, but offering guidance by purpose.
Case 1: You want to pick your first one
- Recommended pair: RSI as one indicator (period commonly seen is 14). If you prefer a zero-based baseline, CMO is also an option
- Reason: Both are smooth and have relatively few false signals. RSI is in the standard menu
- Notes: 70 and 30 are not “reversal signals,” but indicators of being overextended; in strong trends they can stick. Since CMO is similar to RSI, it’s safer to start with RSI
Case 2: You want to find short-term overreaches
- Recommended pair: Connors RSI
- Reason: It blends short-term RSI and other measures to catch sudden overreaches more easily
- Notes: A contrarian tool. Against a strong trend, it can produce continued misreads. Define stop-loss in advance
Case 3: You want to see finer timing
- Recommended pair: Stochastic RSI. Use it with a tool that determines direction
- Reason: It reacts quickly, capturing small pullbacks and rebounds
- Notes: The line tends to cling to edges and produces more signals. Some use it as a “timing-check” tool
The flow for choosing is summarized in Figure D. Answer three questions in order.
6. Examples of how to combine
- RSI and moving averages: Use moving averages to assess the overall direction, and rely on RSI to spot overbought/oversold conditions. They complement each other
- Stochastic RSI and a longer RSI: Use the longer RSI to gauge overall momentum and Stochastic RSI for finer timing
- Connors RSI and trend on higher time frames: Look for short-term overbought/oversold while confirming that you are not opposing higher-time-frame direction
7. Cautions when using the report card
- In periods of strong trends, any line tends to hug the extremes. Do not assume a signal reversal simply because it hits the edge
- Interpretations are guides: ★ marks reflect our view; there are no hard numbers backing them. Ranks can change with market conditions and settings
- Avoid excessive parameter changes: Adjusting periods each time you fail leads to “past-fit” settings. Look at the same settings for a while
- Same name can differ: Different distributors may have different calculation details and scales. If the screen looks different, check the parameter screen calmly
What you can start today
- Show only RSI for one period and examine the subsequent moves in about five places on a past chart when RSI is above 70 or below 30
- Compare RSI and Stochastic RSI side-by-side to see how their moves differ in the same situation
- Answer the three questions in Figure D, decide the one that fits your purpose, and study it with that line for a while
Summary
The RSI family is all about “how strong the up or down move is,” and the differences lie in how sensitively they are processed. The more sensitive, the faster the reaction, but with more false signals—a seesaw relationship. No line is perfect; choose according to your objective.
To be frank about weaknesses: all lines are calculated from past prices and do not predict the future. “Overbought/oversold” and the star ratings are guidance only.
This article introduces general usage and does not guarantee profits. Actual trading should be practiced in a demo account or similar and based on your own judgment.
Next time is Episode 7, a report card for the overbought/oversold group. We will compare Stochastic, Williams %R, SMI, and CCI.
At the Indicator Research Institute, we will continue to compare indicators by purpose, arranging and clarifying them for easy understanding.