
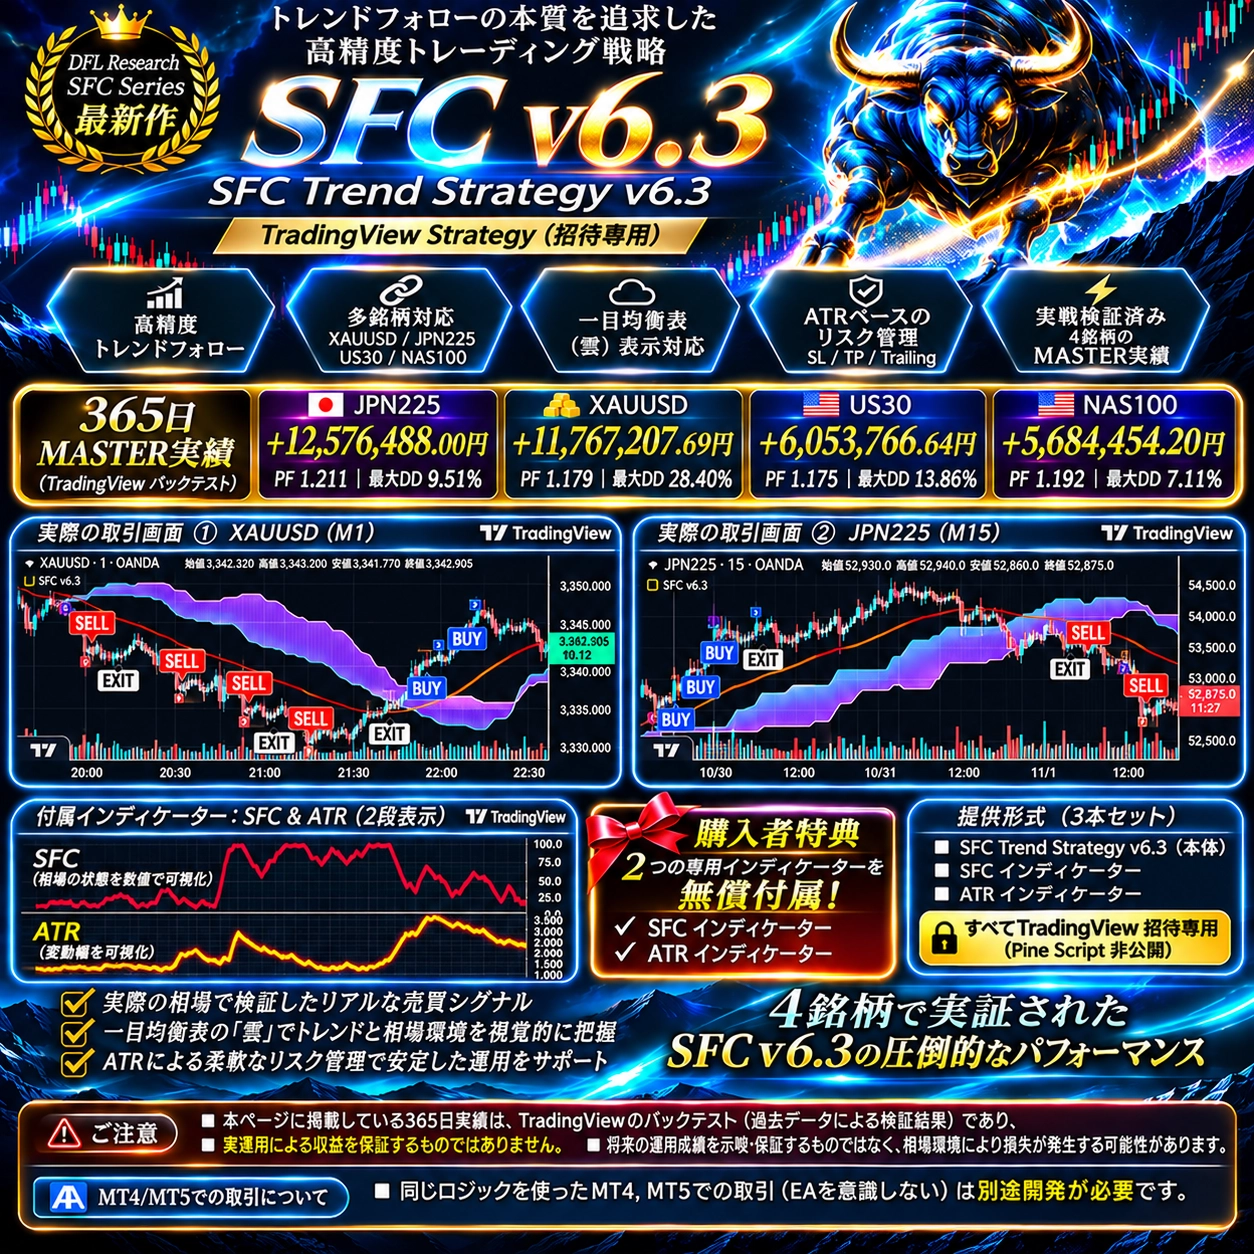
【TradingView対応】4銘柄・365日バックテスト公開! SFC Trend Strategy v6.3 販売開始
<Introduction>
★Standalone SFC Trend Determination × ATR Trailing:
From entry to EXIT, strategized!
To TradingView users.
DFL(Discdream Finance Labs.)developedSFC Trend Strategy v6.3is now available for sale on GoGoJungle!
This product is a TradingView-only buying/selling strategy that combines a unique SFC trend detection with ATR-based profit management.
It doesn’t just display BUY/SELL signals; it can be tested as one integrated strategy from entry, take profit, stop loss, to trailing stop.
Backtesting has been performed on four instruments: XAUUSD, Nikkei 225, US30, NAS100 for 365 days.
We will introduce the verification results and actual TradingView charts.
① SFC Trend Strategy v6.3 — 5 Features
FEATURE 1|Standalone SFC Trend Determination
Determines market trend using a proprietary SFC logic. Builds a trading strategy based on the trend.
FEATURE 2|Visualize BUY・SELL・EXIT
From entry to exit, you can verify the behavior of the trading strategy on TradingView charts.
FEATURE 3|ATR Trailing Included
Adopts a trailing stop considering the magnitude of price movement. Manages positions by combining with TP (take profit) and SL (stop loss).
FEATURE 4|Verifiable with Strategy Tester
Supports TradingView Strategy Tester. Using historical data, you can verify number of trades, win rate, net P/L, and profit factor.
FEATURE 5|Two indicators included free of charge
In addition to the strategy itself, it comes with SFC Indicator and ATR Indicator. You can verify trends and ATR on the chart.
② 【Verification Result Published】4 Instruments × 365-Day Backtest
For SFC Trend Strategy v6.3, backtests for four instruments (XAUUSD, Nikkei 225, US30, NAS100) were conducted on TradingView for 365 days.
All four instruments showed positive net profit during the testing period!
365-Day Backtest Results
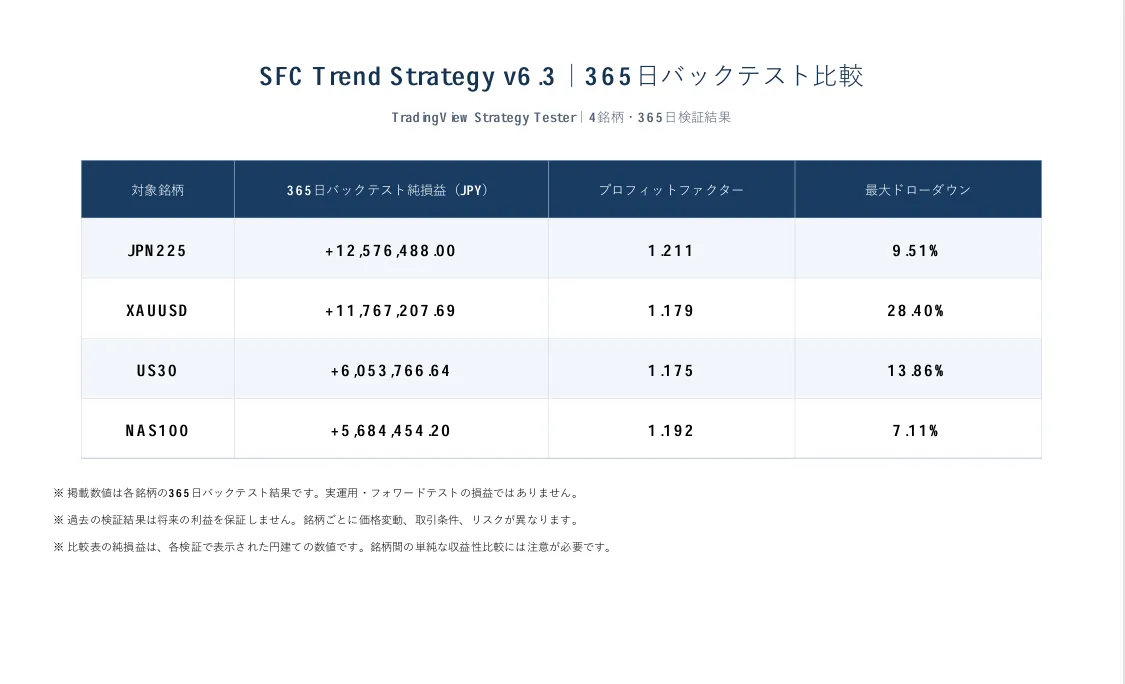
PF (Profit Factor) means total profit divided by total loss, and max DD indicates the maximum drawdown of assets during the verification period.
※Important: The above results are based on historical data backtests and do not guarantee actual trading profits.
Net profit depends on TradingView verification conditions. Initial capital, order size, trading costs, etc., can affect results, and they do not guarantee future profits.
③ See the actual TradingView charts!
We’ll show how SFC Trend Strategy v6.3 operates on real charts.
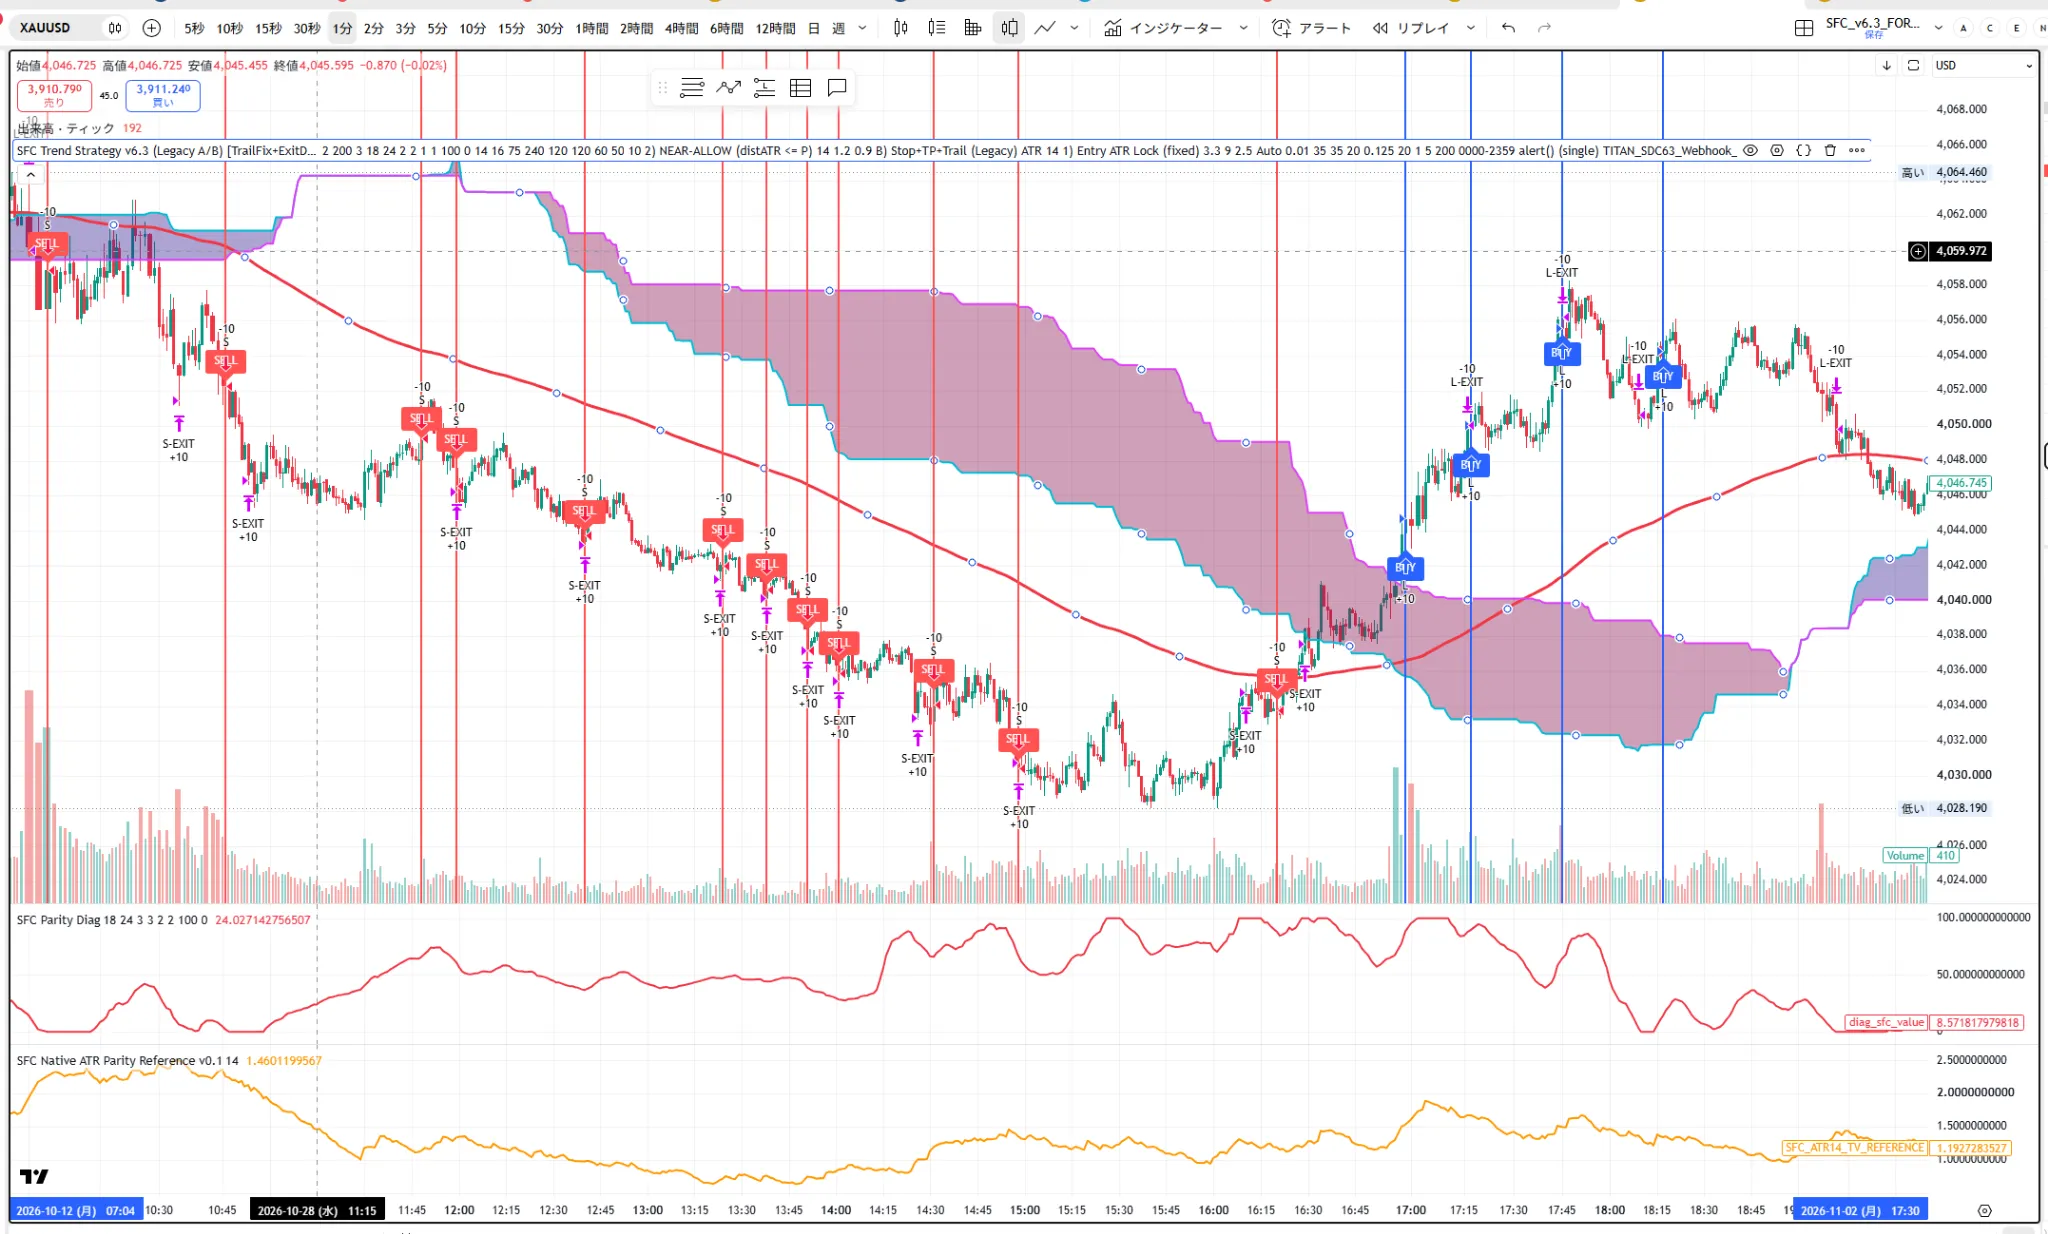
■ XAUUSD (Gold) M1 — 1-minute chart
You can see BUY/SELL signals based on the proprietary SFC trend determination and the trading actions from entry to EXIT on TradingView.
■ Nikkei 225 (JPN225) M15 — 15-minute chart
The 15-minute chart of Nikkei 225 also demonstrates trend determination and trade management by SFC Trend Strategy v6.3.
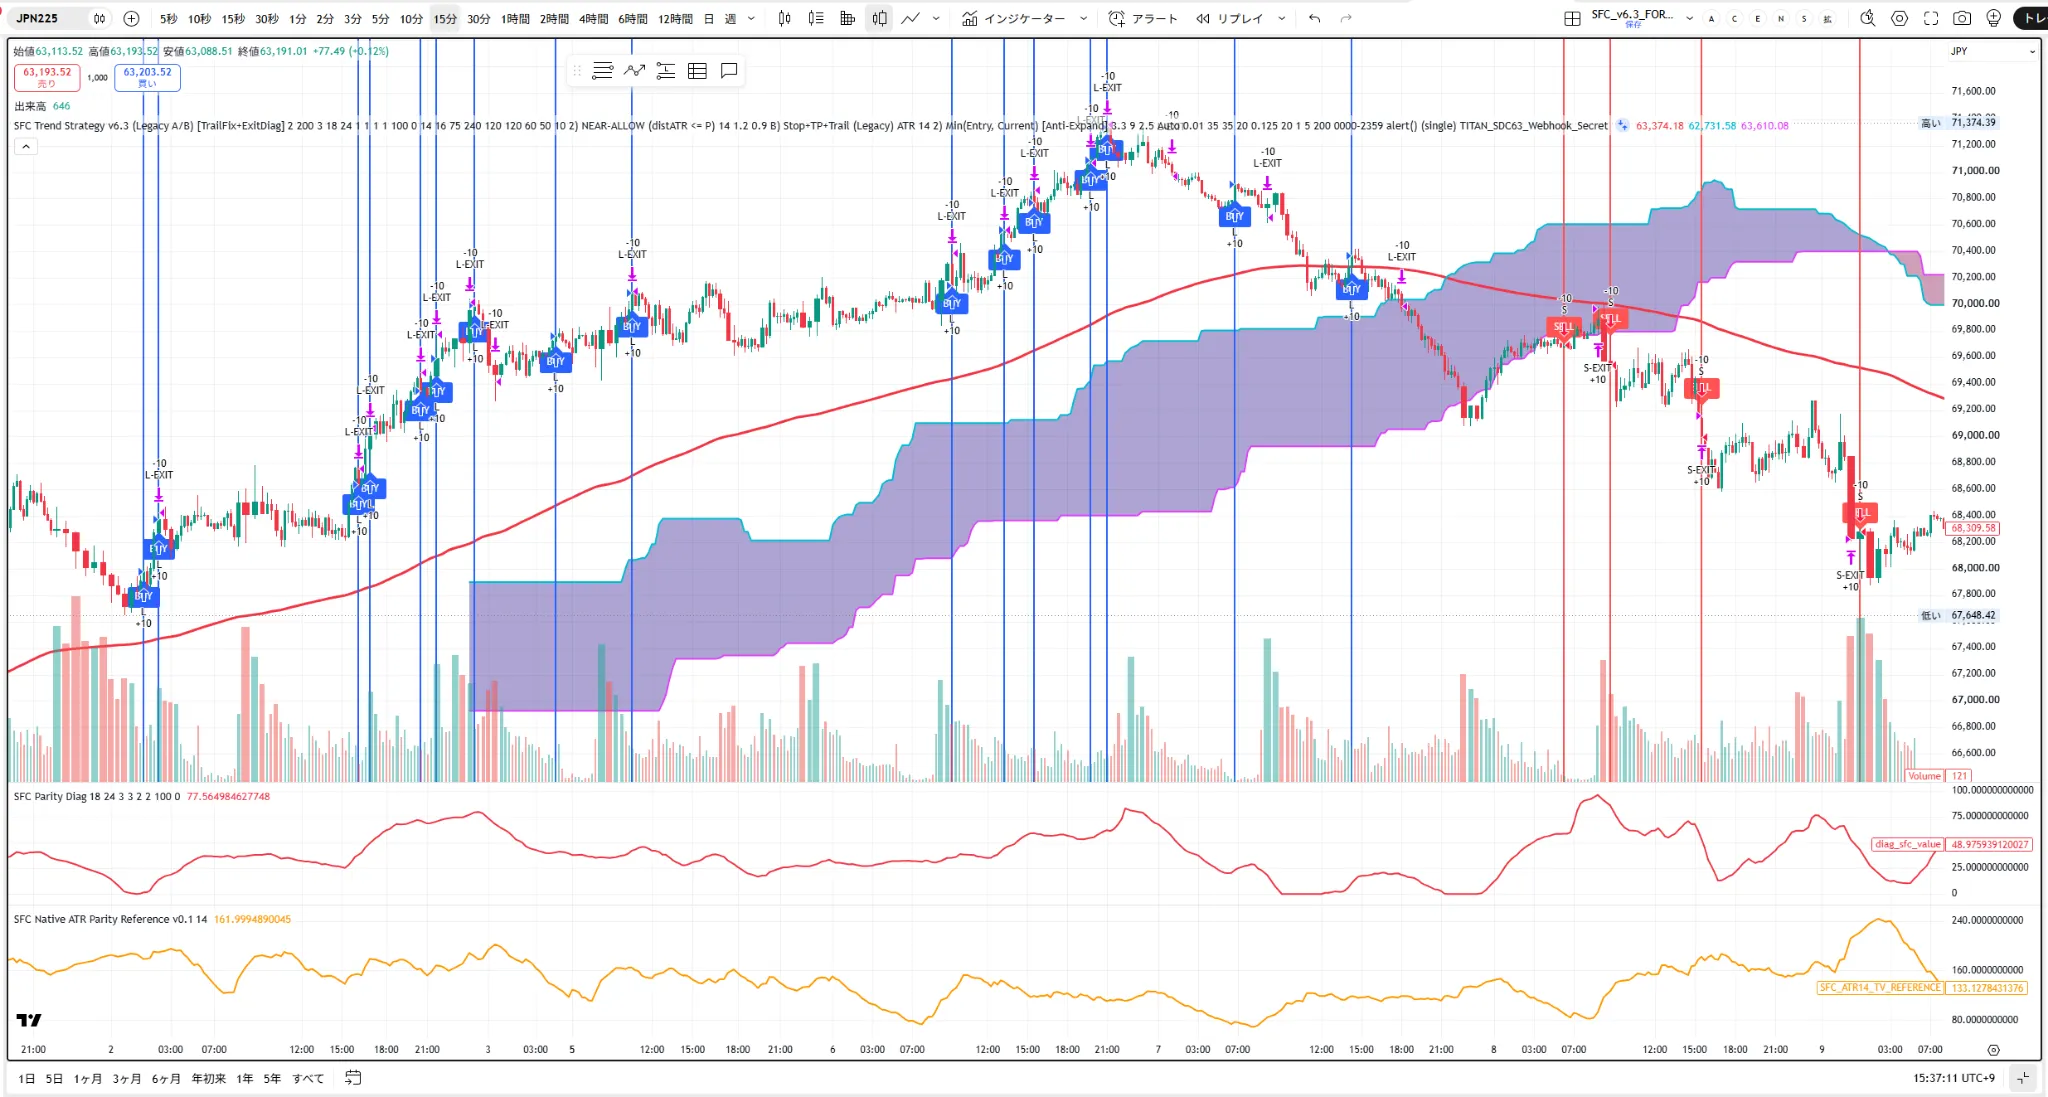
Not only the entry but also the exit can be verified as one Strategy, which is a feature of SFC v6.3.
④ SFC Trend Strategy v6.3 — Product Composition
TradingView Strategy core + 2 indicators included as a set!
This product includes three items:
SFC Trend Strategy v6.3:TradingView Strategy with proprietary SFC trend detection and ATR trailing
SFC Indicator:Analytical tool to confirm trend conditions on the chart
ATR Indicator:Tool to check price movement using ATR
All are provided via TradingView’s Invite-only approach. The Pine Script source code is not disclosed.
※ This product is for TradingView only. EA for MT4/MT5 is not included.
⑤ 【On Sale】 SFC Trend Strategy v6.3
Standalone SFC Trend Determination × ATR Trailing
Sale Price: 59,800 yen
Supported Platform: TradingView
Includes: SFC・ATR Indicator two
Would you like to verify the entry-to-exit as a single trading strategy on TradingView?
▼ For product details, backtest 자료, and purchase, click here
https://www.gogojungle.co.jp/tools/indicators/89588
DFL / Discdream Finance Labs.
At DFL, we emphasize the basis of trading decisions, the consistency of entry and exit, and verifiable Evidence.
We will continue to introduce ways to use SFC Trend Strategy v6.3 and case studies.
Note on Risk
This product does not guarantee profit or investment results. Backtesting is a simulation based on historical data, and actual trading results may differ due to factors such as spreads, slippage, and market conditions. There is a risk of principal loss in investing.