

[Thorough Analysis] AI Rig Gold|M1・M5 1-Month Track Record | Aggregation Period: 2026-10-05 to 2026-11-04 (31 days)
AI Rig Gold, Thorough Analysis of 31 Days of Trading Data!
This data is not a backtest!
Truly genuine! A trading record being streamed on YouTube!
This time, we will read the trading results of the gold-specialized trading system “AI Rig Gold” in detail from the numbers.
AI Rig Gold conducts YouTube LIVE broadcasts on four timeframes: M1, M5, M15, and M30. From these, this time we will focus on the ones with many tradesM1 (1-minute) and M5 (5-minute).
Win rate, profit factor, trade direction, win streaks and loss streaks, drawdown, and current LIVE operation. Not only the good numbers but also the losses will be reviewed.

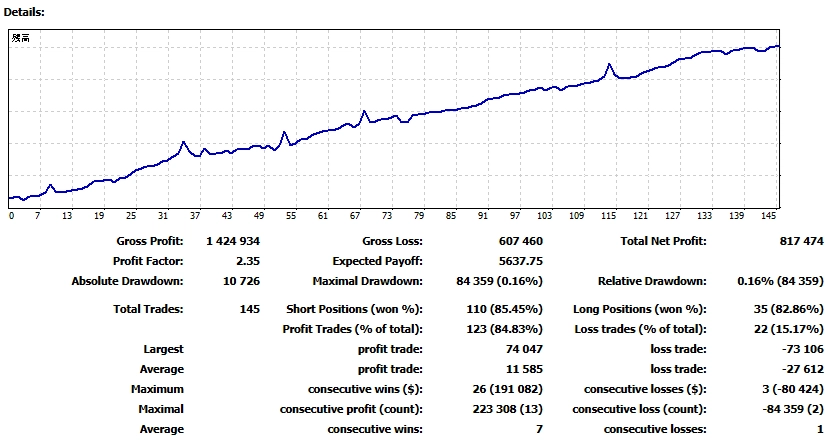
First, what stands out is,the number of trades, 145of which 123 were profitable, giving a win rate of 84.83%.
Profit Factor (PF) is 2.35. This metric is total profit divided by total loss, and in this aggregation total profit was 2.35 times total loss.
The profit/loss trend graph shows fluctuations along the way, but overall it is upward.
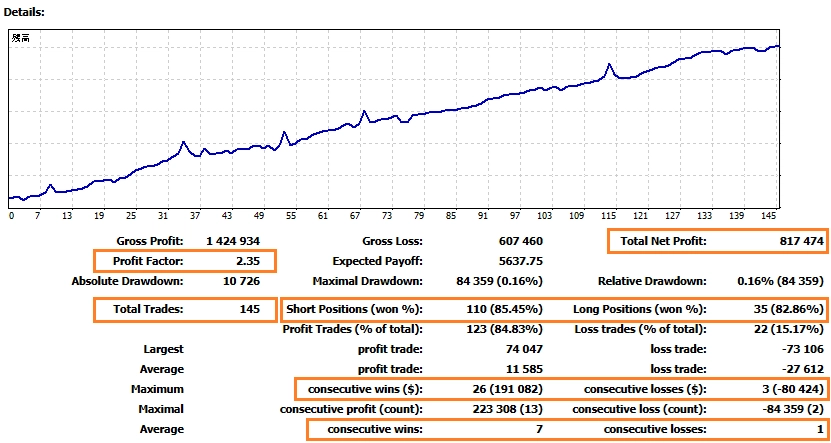
Of the 145 total trades, SELL occurred 110 times and BUY 35 times. SELL trades were about 3.1 times more frequent than BUY trades.
On the other hand, it wasn’t only SELL. BUY was also done 35 times, with win rates of 85.45% for SELL and 82.86% for BUY.In this aggregation, both directions exceed 80% win rate.
It is notable that results are seen for both BUY and SELL directions, not just one direction.
Let's look at the price movements of XAUUSD during this aggregation period. In the following H1 chart, there is a general downward trend.
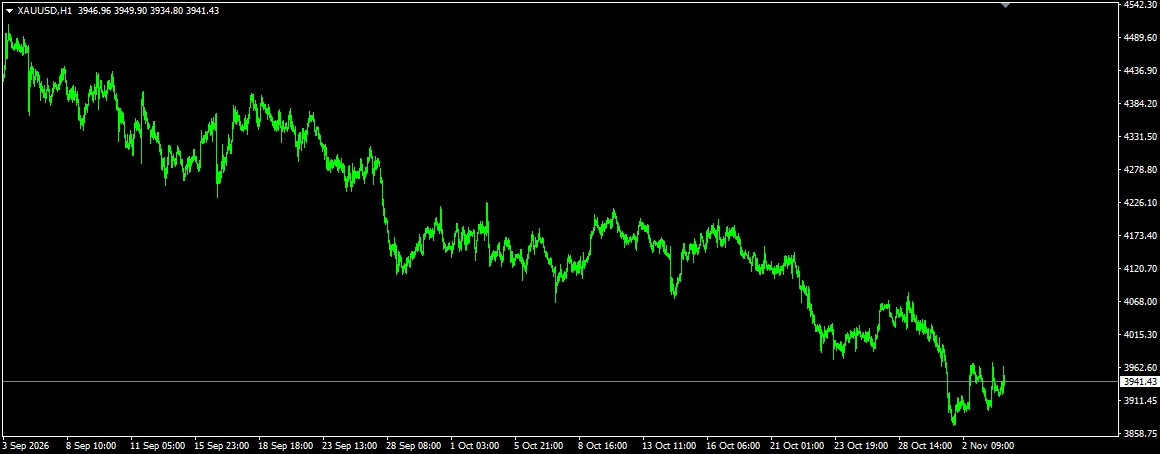
In a down-trending market environment, SELL trades were more frequent.
The existence of a trade number bias alone cannot determine market adaptability, butcomparing the market direction with the actual buy/sell breakdownis important for understanding the trading results.
The maximum win streak is 26, while the maximum loss streak is 3.
The maximum drawdown is 84,359 yen (0.16%). The average winning trade was 11,585 yen, and the average losing trade was 27,612 yen.
Even with a high win rate, a single loss can exceed the average profit of winning trades. It is necessary to evaluate both win rate and the balance of profits and losses.
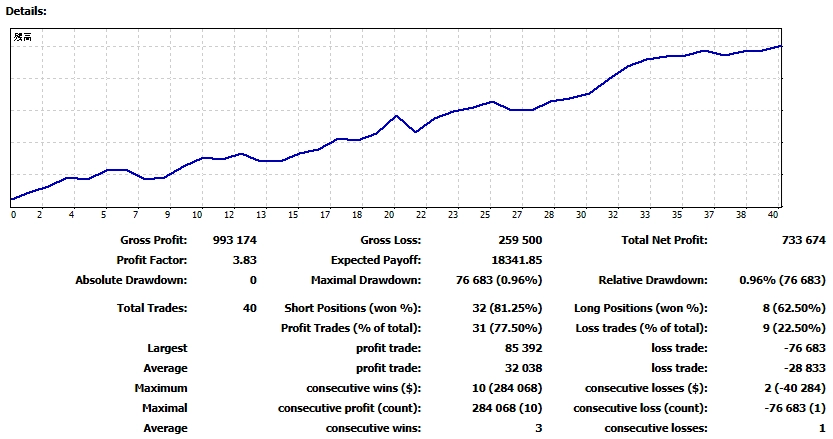
M5 trades total 40; compared with M1’s 145, they are fewer, but this aggregation yieldsPF 3.83.
Win rate is 77.50%. It is lower than M1’s 84.83%, but PF surpasses M1’s 2.35.
This is where the comparison becomes interesting.A higher win rate does not necessarily mean a better ratio of profits to losses.
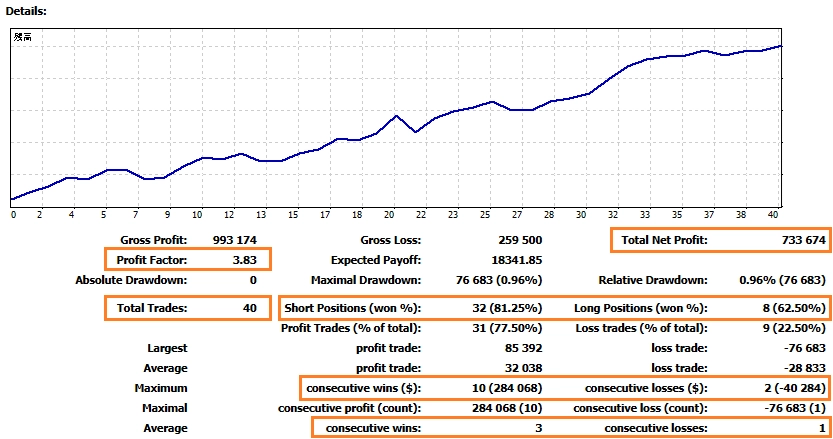
SELL 32 times, BUY 8 times. Here too, SELL is more frequent.
Sell win rate is 81.25%, Buy is 62.50%. As with M1, both directions are observed, but because BUY trades are only 8, the trade count should be considered when evaluating win rate.
Maximum win streak is 10, maximum loss streak is 2. Maximum drawdown was 76,683 yen (0.96%). Keep in mind this is based on 40 trades, and future market conditions may not yield the same results.
M1 shows trade count and win rate, while M5 highlights PF. The goal is not to declare one better than the other, but to interpret the characteristics by timeframe.
| Indicator | M1 | M5 |
|---|---|---|
| Net profit | 817,474 yen | 733,674 yen |
| Trade count | 145 trades | 40 trades |
| Win rate | 84.83% | 77.50% |
| PF | 2.35 | 3.83 |
| Max win streak | 26 | 10 |
| Max loss streak | 3 | 2 |
From here, in addition to the 31-day aggregation report,we will introduce the operation screen that has been publicly streamed on YouTube LIVE since August 14, 2026.
Not only the current trading status, but on the left side of the screen is a profit/loss trend graph since the start of the operation. Please pay attention to both the numbers and the graph.
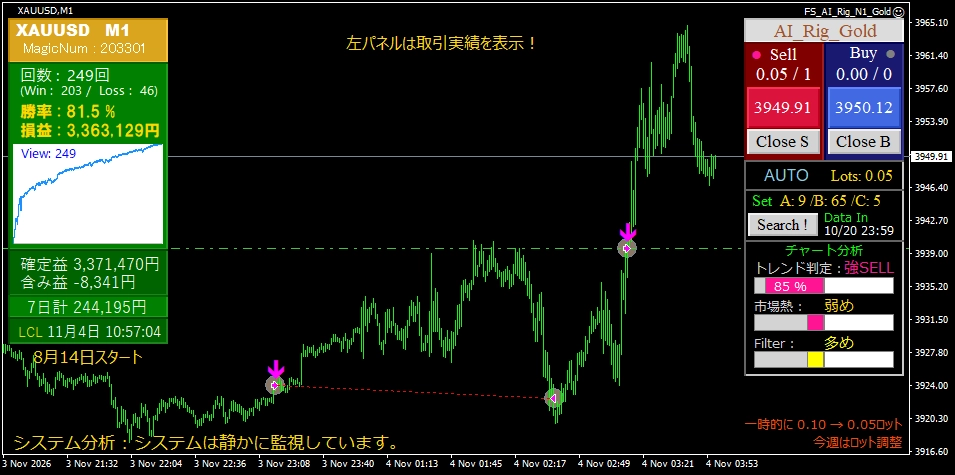
The cumulative profit/loss display for M1 is +3,363,129 yen. Realized P/L 3,371,470 yen, Unrealized P/L −8,341 yen. The profit/loss trend graph overall rises despite intermediate fluctuations.
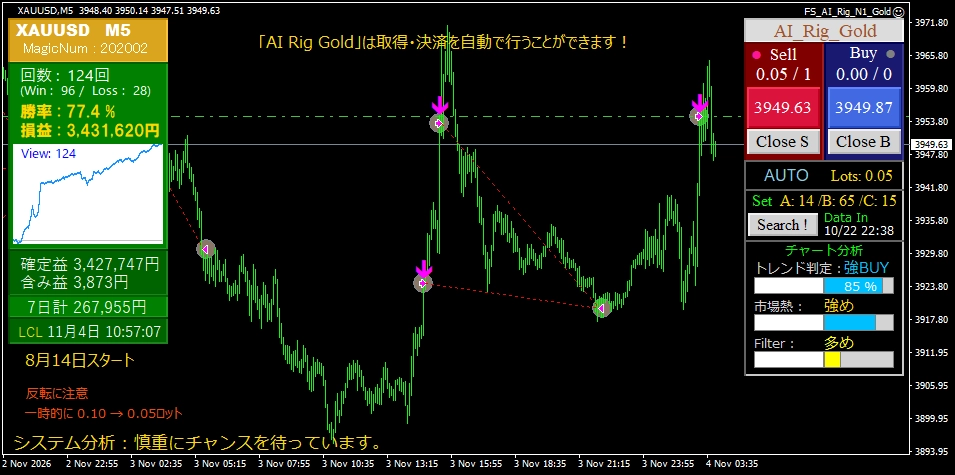
The cumulative P/L display for M5 is +3,431,620 yen. Realized P/L 3,427,747 yen, Unrealized P/L +3,873 yen. The profit/loss trend graph also shows an overall upward movement.
As shown on the LIVE screen, given current market conditions, the lot size has been temporarily reduced from 0.10 to 0.05. Operating conditions are not fixed and are adjusted considering risk.
The魅力 of LIVE streaming is that you can view the real-time chart and trading status.
However, LIVE streaming does not guarantee that all settings and trading conditions remain unchanged. The numbers published reflect results at the time of filming and do not indicate future performance.

AI Rig Gold is a trading system designed to target gold price movements. It analyzes trend direction and market state, supporting entry, position management, and exit. Although this performance alone cannot prove the effectiveness of each feature individually, please also pay attention to the design philosophy.

In addition to XAUUSD-specific design, there is past-data analysis with Search!, a second engine that can operate as needed, and trading styles including discretionary, semi-automatic, and fully automatic. Please check the product page for detailed features and operating cautions.
Besides AI Rig Gold introduced here, we also offer Core_iX, usable for a wide range of currency pairs.
Each is available in MT4 and MT5 editions, allowing you to choose according to your environment.





In conclusion
The results of this 31-day period show different characteristics for M1 and M5.
Win rate, PF, trade count, buy/sell directions, and profit trend. By interpreting the numbers one by one, I hope you gain a more concrete understanding of the operation example of AI Rig Gold.
※The published figures are past results shown in each aggregation report and LIVE screen. Results may vary depending on the aggregation period, operating conditions, account funds, lot size, and market environment. Past performance does not guarantee future profits, and there is a risk of loss in trading.