
【11/4 Night EURUSD】Moves in a range of 1.11743〜1.12058, ends Tuesday at 1.119, Structure of the market and the latest targets seen on LIGHTHOUSE
LIGHTHOUSE (LightHouse)
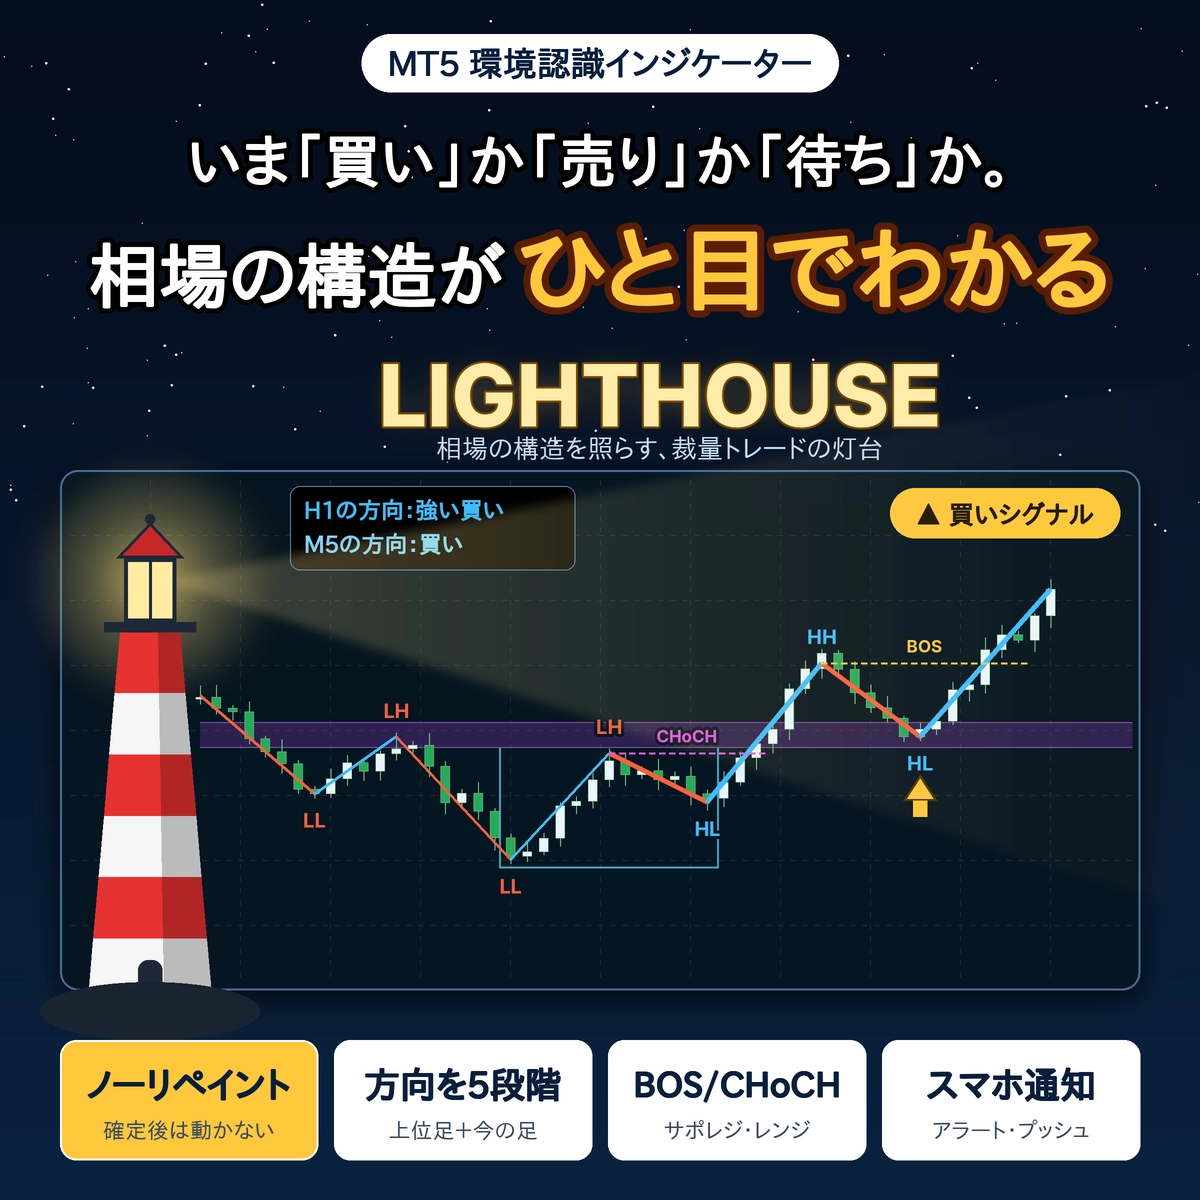
Automatically display the chart’s "readings" at a glance.
A discretionary trading support indicator that shows the direction of the higher time frame and the current bar, updates of highs and lows, and zones of pullbacks and retracements right on the chart.
1. Latest Chart: EURUSD 1-hour chart (until the close on November 3)
First, look at the current EURUSD on a 1-hour chart with LIGHTHOUSE installed.

・In the upper left, the higher time frame (daily) is shown as "strong sell," and the 1-hour is "neutral."
・The high on November 2 isHH, the peak in the 9 o’clock hour on November 3 isLH, and the subsequent trough isHL・LLis attached
・Below the price,Support/Resistance reversal zone (blue band), around the price arePullback zonesdisplayed
Price ranges that tend to be watched (based on chart facts)
| 1.12058 | High of the day (9 o’clock hour). The close for that day is 1.11912 |
| 1.11743 | Low of the day (14 o’clock hour) |
Other price levels and the most likely targets in the near term are conveyed in purchaser-friendly messages.
2. Past Examples: LIGHTHOUSE Signal Scenarios
Generally based on past cases.It does not predict or guarantee future price movements. When you add LIGHTHOUSE to the chart, we illustrate how the subsequent price action looks in two scenarios.
Case 1: Monday, October 26: 5-minute chart
At 6:30 on the 26th (server time), a sell signal appeared. From around 1.122, the price moved downward in a bearish wave (red line), and by around 16:00 on the same day it had fallen to around 1.118.
The pullbacks in between showLH (lower highs),BOS (break of lows) continuing in an upward direction.
Case 2: Friday, October 16: 5-minute chart
At 4:40 on the 16th, a buy signal appeared. From around 1.121, by around 13:00 the same day it rose to the upper 1.126s.
In the pullback valley,HL appeared,HH andBOS appeared, continuing the upward momentum on the chart.
What LIGHTHOUSE reveals
・Direction of the higher time frame and the current bar displayed on the chart’s top-left in five levels
・Auto display of HH/HL/LH/LL marks and BOS・CHoCH lines
・Pullback + retracement zones, support/resistance reversal zones, and range boxes
・Marks for peaks and troughs appear only after confirmation and do not move or disappear later (no repaint)
・Explanations of term meanings shown at the bottom-left of the chart to help you learn as you look
To those who purchase LIGHTHOUSE
We deliver daily granular price ranges and near-term targets via purchaser-only messages.
・This article introduces past price movements and does not predict or guarantee future movements. Please make investment decisions at your own risk.
・Prices and dates are based on B〇〇〇 demo account) MT4 chart (server time). They may vary slightly by broker.
・LIGHTHOUSE is an indicator intended to assist with market analysis and does not perform automatic trading.