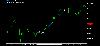

5M is practice that only looks at "timing"
The fastest way to show results: Practice #6
5M is a practice that only looks at "timing"
Hello. This is THE DAYTRADE.
Let’s organize the practice so far.
- #3: On a 4-hour chart, decide whether the trend is up or down
- #4: Draw one horizontal line at the swing low or pullback high
- #5: On the 1-hour chart, narrow the entry to one place
This time, we’re finally on the 5-minute chart.
But there is only one thing to do on the 5-minute chart.
“Look at timing”.
Deciding the “direction” on the 5-minute chart leads to confusion
The 5-minute chart is a time frame with fine movements.
Prices go up and down repeatedly in short intervals.
Therefore, if you try to decide only from the 5-minute chart that it will go up or down, you’ll quickly become lost.
It rose until just now, then suddenly fell.
When you expect it to go down, it goes up again.
With every shift, your feelings swing, you enter without a clear plan, and exit without clarity.
This is because the 5-minute chart is seeking“direction,” “entry point,” and “timing” all at once.
The direction has already been decided on the 4-hour chart.
The entry location has already been decided on the 1-hour chart.
So on the 5-minute chart,timing onlyis enough.
Looking at the 5-minute chart starts from the location
There is one most important rule in this practice.
Until you reach the “entry location” decided on the 1-hour chart, do not look at the 5-minute chart.
If you look at the 5-minute chart before you’ve reached the location, you’ll be drawn to the finer movements and want to enter.
But that is not the place to enter.
The pullback on the 1-hour chart is targeted on the 5-minute chart.
Since we view by lowering the time frame in order, the 5-minute chart’s turn comes last.
Waiting on the 5-minute chart is a “N wave”
Once you reach the location, open the 5-minute chart.
What I’m waiting for there isthe N wave.
An N wave is a price movement shaped like the letter “N.”
In an up move, it goes up, a little down, then up again. In a down move, the opposite.
I count waves only as three: Wave 1, Wave 2, Wave 3.
- Wave 1: The first movement where the flow begins to change (e.g., the price that was falling moves above a pullback high)
- Wave 2: The subsequent pullback
- Wave 3: The part where it then extends higher
On the 1-hour chart pullback, when this shape appears on the 5-minute chart and the end of the pullback is confirmed, that is the timing.
Conversely,If an N wave hasn’t formed, even if you reach the location, you do not enter.
Wait until the pattern forms.
How to practice on the 5-minute chart focusing only on timing
This time as well, we won’t actually enter. It’s practice to find timing.
① On the 4-hour chart, determine the trend and the line, and on the 1-hour chart, decide the entry location
This is the same as practice #3 to #5. If you cannot decide the location, end by “waiting” here.
② Until the location arrives, don’t open the 5-minute chart
If you must check something, just look at the 1-hour chart.
③ When the location arrives, open the 5-minute chart and wait for the N wave
Only check whether the 1st, 2nd, and 3rd wave shapes appear and whether the pullback end can be confirmed.
④ Mark the point where you think, “Enter here.”
Actually entry is not made; just mark it on the chart and jot a brief note explaining why you think so.
⑤ Later, review how the price moved after that mark
Did the price move in the direction of the trend, or did it reverse quickly?
If it moved in the opposite direction, reassess using the 4-hour and 1-hour judgments. It’s important not to blame only the 5-minute chart.
If you’re confused on the 5-minute chart, go back to the higher time frame
If you’re unsure while looking at the 5-minute chart, it’s usually not a problem with the 5-minute chart itself.
- First, is the 4-hour trend correct?
- Is the location on the 1-hour chart truly a pullback (retrace)?
I think that a move right after entry is caused by a mismatch between the higher-timeframe direction and your entry
The 5-minute chart is the final finishing touch.
The foundation always lies in the higher time frame.
What to do today
- On the 4-hour chart, identify the trend and on the 1-hour chart decide the entry location
- Until reaching the location, do not open the 5-minute chart
- When you reach the location, open the 5-minute chart and wait for the N wave (1 wave, 2 waves, 3 waves)
- Mark where you think you would enter, and note a reason in one line
- Later, review how the price moved after that mark
Summary
- If you seek both direction and location on the 5-minute chart, you’ll get lost
- Direction is on the 4-hour, location on the 1-hour. The 5-minute chart is only timing
- Looking at the 5-minute chart is after you reach the location on the 1-hour chart
- Waiting is for the N wave. If the pattern isn’t formed, you don’t enter
- If you’re confused on the 5-minute chart, go back to the higher time frame
With this, the flow from the 4-hour chart to the 1-hour chart to the 5-minute chart is largely in order.
Next time: #7 “How to practice validating with past charts.”
We will repeat the practice on past charts up to here.
Pursue correctness over winning rate.
The correct direction, at the correct location, with the correct timing.
▼ Videos that deepen understanding when viewed together
Is this a pullback buy? Isn’t your thinking too shallow?
If you’re buying on pullbacks but it isn’t working, this explains that pullbacks are about “location” and that you should confirm the end of the pullback with the 5-minute chart’s N wave before buying, using real charts.
THE DAYTRADE Intensive Course | 1 month
Is that timing correct?
We’ll confirm together in chat.
Buyer perks: ChartPen and Past Validation Tool Pro distributed within the community
・1 month of chat interactions (course basics)
・Total 2 hours of one-on-one online lessons (can be split or done in one go)
・Discipline textbook
・ChartPen (chart drawing tool used in lectures)
・Past Validation Tool Pro (MT4 version / MT5 version)
・Continuous community support after the course
First-come, first-served: 10 people¥9,800
From the 11th, ¥19,800 (please check the product page for the latest remaining quantity)
View intensive course details▼ ChartPen | MT4/MT5 drawing tool (¥980)
A tool that lets you write lines and text directly on the chart (Windows MT4/MT5). If you mark where you think you’ll enter, it will be useful when you review later.
https://www.gogojungle.co.jp/re/oaxx7xNztnaAFo9
▼ Monthly series “Chart Reading, Explanation, Interpretation, and Language” | ¥980 per month
About 33 yen per day for daily environment recognition in the morning and review of the previous day’s answers. All paid video articles (about 500 yen each) are unlimited access.
・Daily gold environment recognition video
・Previous day review (answer check) video
・Practical articles (about 2 per week)
・Access to all past paid video articles
View the monthly series
※ Individual results may vary; this does not guarantee profits or the time required to learn.
※ Trading involves risk of loss. Results vary by individual, and profits are not guaranteed.