
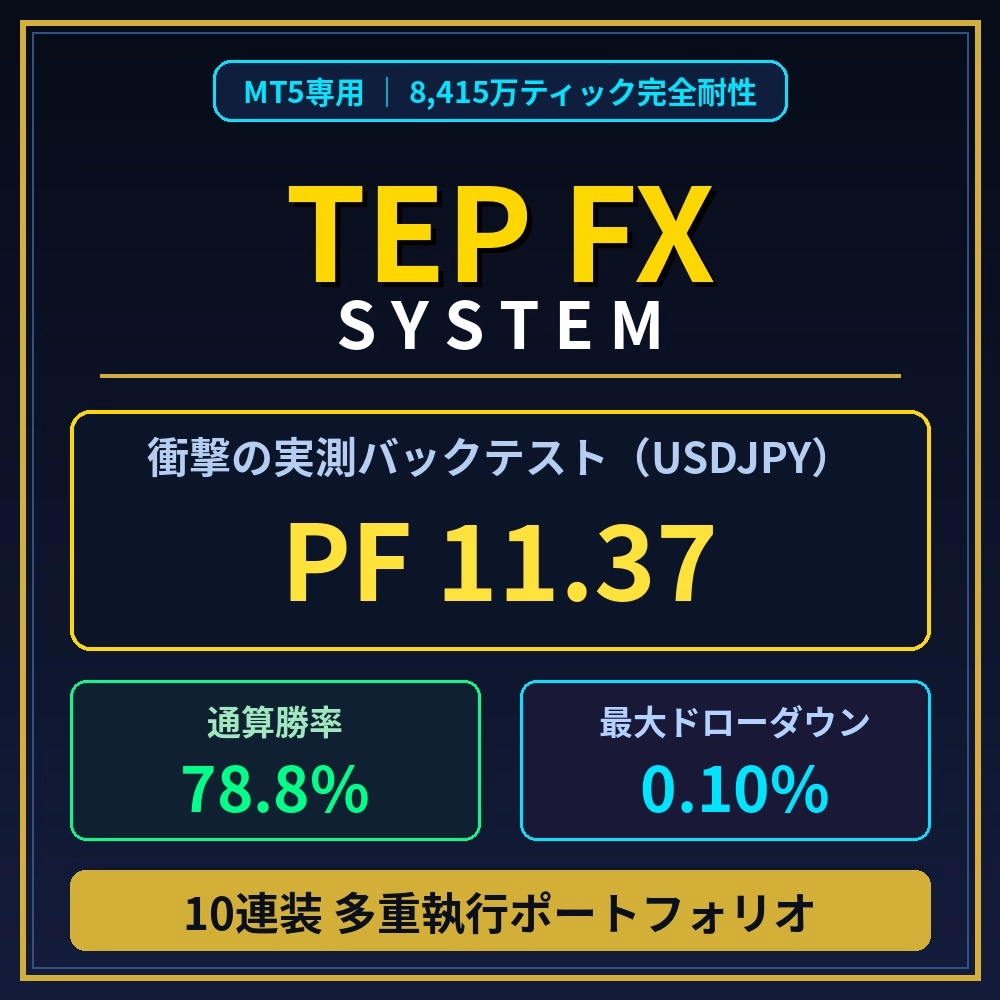
PF11.37 ・ Maximum DD 0.10%! A groundbreaking deconstruction of the “Quadruple-Quonst System” that toppled an extremely harsh market of 84.15 million ticks

“In backtesting, the chart looked perfectly upward sloping, but as soon as you started real trading, the capital began to dwindle…”
The cause of this frustrating phenomenon, experienced by many traders at least once, is not your skill nor a sudden market shock. The cause is only one thing, the overly optimistic environment presented by MT5 Tester’s “fixed spread” and “ignoring swaps/fees.”.
In reality, even while testers calculate with a “fixed 1.5 pips,” the spread explosively expands to 5–20 pips or more during late night/early morning market hours (00:00–01:00). Furthermore, after deducting round-trip 0.6 pips ECN external fees and cross-day negative swaps, the logic that appeared to win every day on the tester’s screen reveals the cold truth: in real trading, only “two trades per week” remain to fire..
In the explanatory video released this time, using actual USD/JPY data (about the last 2.7 years), a shocking test is conducted to subtract 100% of real costs (0.6 pips fee + actual spread and swap) from the anomaly that appeared as 114 “holy grails” on the tester..
? Video highlights: the moment when 114 holy grails are reduced to just one
In the video, as soon as real measured data is applied to the web browser analysis app “3_TEP_FX_Analyzer,” 113 pseudo-holy grails are instantly defeated by costs, leaving only one survivor—the “true premier anomaly (win rate 92.2%, effective PF 11.81, effective RF 25.17)”—visually demonstrated in real-time. This is vividly visualized..
To eliminate this “pseudo holy grail” and capture and automatically execute only genuine anomalies to the millisecond, the institution-investor-grade “TEP Suite 4-part Ecosystem” was developed.
- 【Exploration】1_TEP_FX_Scanner: Scans the entire market space for a week across 120 hours in five modes.
- 【Audit】2_TEP_FX_Auditor: Automatically samples sudden spread expansions, swaps, and slippage on 24-hour full ticks.
- 【Analysis】3_TEP_FX_Analyzer: Fully subtracts real friction costs and selects Top 10 with the “squeeze method”.
- 【Execution】4_TEP_FX_Executor: Just attach to one chart to execute automatically across up to 10 slots simultaneously.
? An overwhelming performance that remains unmoved even with 84.15 million real ticks
In real-measurement testing using Titan FX’s 100% realism history (991,850 bars / 3,928,108 ticks, about 2 years 9 months), the following astonishing unfaltering data was recorded:
- Profit Factor (PF):11.37 (unprecedented profitability)
- Total win rate:78.83%(274 trades, 216 wins, 58 losses)
- Maximum drawdown: Margin max DD 0.10% (Balance max DD 0.01% / nearly unscathed)
- Recovery factor (RF):16.06 (enormous capital recovery power)
- Maximum winning streak / losing streak:20 consecutive wins / maximum losing streak only 3 times
By not performing over-optimization on past data through adjustments to take profit (TP) or stop loss (SL), and achieving this straight asset curve with time-decay-only “untuned state,” the evidence that the market’s temporal distortion (anomaly) is physically real is clear。 Moreover, this structural-observation logic also yields a win rate of 80%–83.9% in binary options with zero spreads (1–5 minute judgments)。
The era of blindly trusting fixed parameters or showy backtests made by others is over。 Please watch the video and confirm with your own eyes the power of genuine measured-cost subtraction and the “unbreakable structure” brought by the four-part ecosystem!