
Limited-time discount "The strongest moving average indicator" Enter when the colors of the two lines align to capture a large number of pips!
I have been trading for many years, and in that time I have been searching for a “reproducible rule that works in any market.”
Even in real markets, things don’t go as planned.
When a trend seems to appear, it reverses immediately,
even when I feel the setup is favorable I get stopped out—
repeated experiences like these have made me think strongly:
“If only there were a simpler, decisive standard to judge things without hesitation.”
“Wouldn’t it be great to have a clearer, decisive criterion?”
Have you ever had experiences like these?
・Missing the entry timing and ending up buying at a high price
・Immediately going against you after entry, getting stopped out and left unsure of the next move
・Overusing multiple indicators and not knowing which signal to trust
To consistently profit in trading,
it is most important to have a “clear and unwavering decision standard.”
So I developed a tool that visually captures the trend and allows anyone to judge without hesitation.
This is—the “Strongest Moving Average Indicator.”
The greatest feature of this indicator is
its elimination of complex logics, letting you grasp the trend intuitively just by color change.
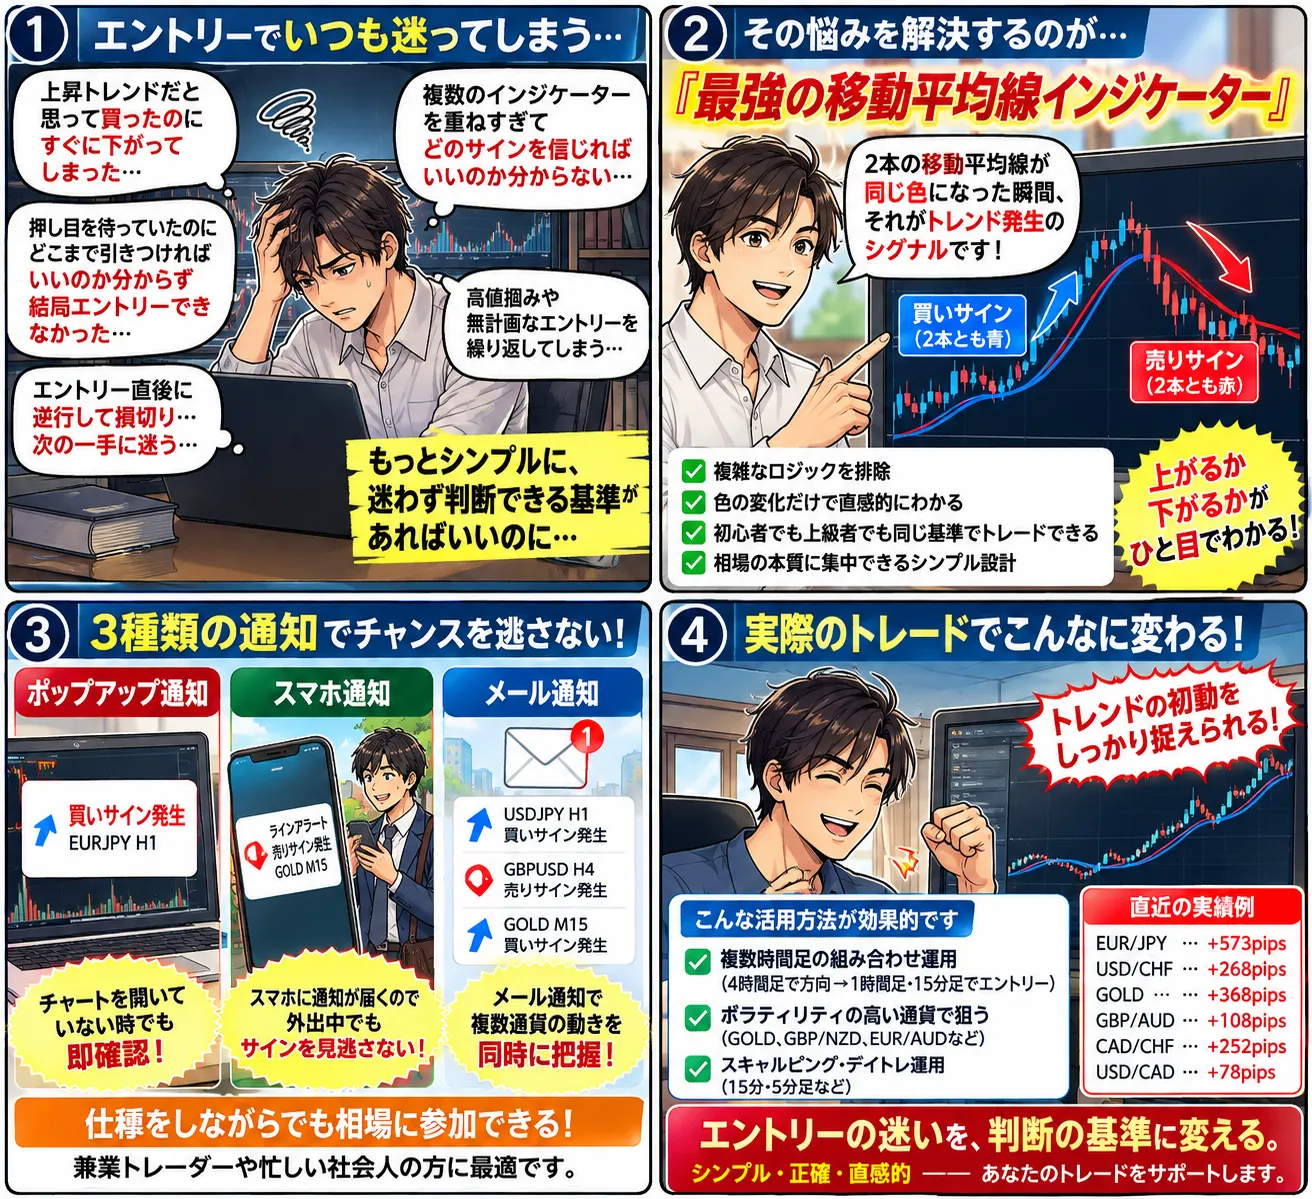
The moment the two moving averages become the same color,
that is the “trend formation signal.”
There is no need to compare multiple indicators as before.
Because you can judge at a glance whether it is up or down,
beginners and advanced traders can trade using the same standard—
a design that pursues reproducibility through simplicity.
Furthermore, to prevent the most common trading hesitation on the field,
we tuned the placement of lines and signals, colors, and response speeds in detail.
Removing extraneous information and focusing purely on “the flow of the trend.”
It’s built to help you concentrate on the essence of the market.
The concept of this tool is,
“Simple, Accurate, Intuitive.”
Shattering the preconception that trading is difficult,
this indicator embodies the idea of “you can see it and act without hesitation.”
Of course it isn’t万能 in all market environments.
However, by having clear criteria, you can eliminate emotional decisions and
create a state where you trade according to the rules.
That is the foundation for long-term continued success.
Since I started using this tool,
I no longer stay glued to the chart.
Just by checking color changes, I know the direction,
and I have more room to view the market, greatly improving trading accuracy.
The essence of trading is not “prediction” but “response.”
Whatever the situation, follow your rules and act calmly.
This indicator provides that “judgment axis.”
You no longer need to hesitate before entering.
The “Strongest Moving Average Indicator” will
silence market noise and support your judgments.
Traders tired of complex charts, please experience this simplicity and high accuracy.
Version update contents: Added the product manual (PDF 16 pages).
With the update, three notification methods are fully integrated and you won't miss opportunities.
✅Open the chart and instantly check via popup!
✅Notifications reach your smartphone, so you won’t miss signals while out.
✅Email alerts let you monitor multiple currency movements at once!
In particular, for part-time traders or busy professionals,
this notification feature becomes a reliable ally that lets you participate in the market while working.
There is no longer the regret of “I realized too late…”
It helps ensure you catch the initial move of the trend.
For example, effective uses include
Using multiple timeframes in combination
→ Check the overall trend on a 4-hour chart, and if the same color (blue or red) appears on the 1-hour or 15-minute chart, you have a strong trend signal.
(Note: the image shown uses 4-hour as an example, but the same principle applies to any timeframe)Volatile currencies (GOLD, GBP/NZD, EUR/AUD, etc.)
→ Tend to move strongly in the early stage of a trend, offering opportunities for large short-term profits.Scalping and day trading (15-minute, 5-minute charts, etc.)
→ Use short-term color changes to accumulate small waves; confirming direction on higher timeframes improves accuracy.
For any method, what matters is to focus only on the moment when the two lines completely match in color.
Purchase here ↓
https://www.gogojungle.co.jp/tools/indicators/38007
First, the latest results!


※The above performance figures are based on past verification results and do not guarantee the same results for all trades.
※On November 21, 2022, we updated the product.
Version update: Added alert functionality.
Pop-up alerts, email notifications, and smartphone alerts are available.
※This product is for online community members only※
“The Strongest Moving Average Indicator” allows large pips gains when the two lines align for entry!
<Product explanation video (no audio except the initial advertisement)>

How to use the indicator
Entry method (3 steps)
① Confirm that both lines are the same color.
② Wait for the candlestick to close above (blue) or below (red) the lines.
③ When the next candle begins, enter in the direction.
Furthermore, combining with other indicators (RSI, Bollinger Bands, etc.) can prevent whipsaws and improve entry accuracy.
Tip?
Check the trend on the 1-hour or 4-hour chart, then enter on the shorter timeframe to increase success rate
Set stop loss based on recent highs/lows to minimize risk
By following this procedure, simple “color changes of moving averages” become a high-precision trend-detection tool.
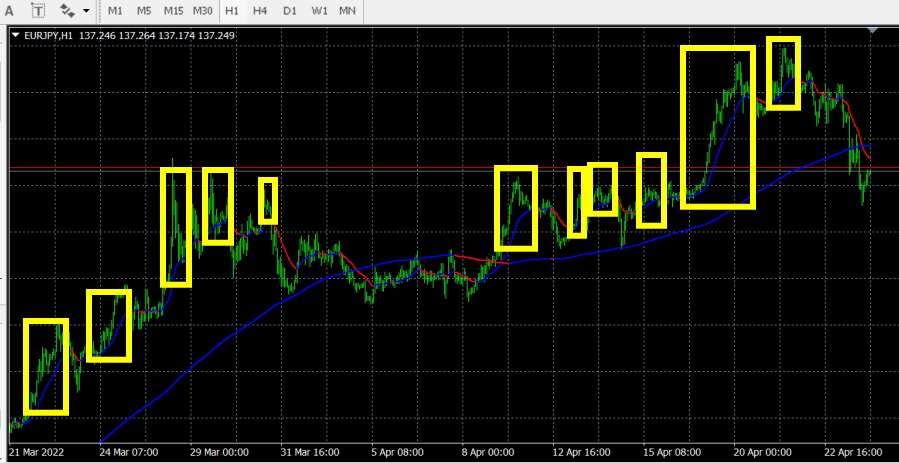
If both lines are blue, it is a buy.
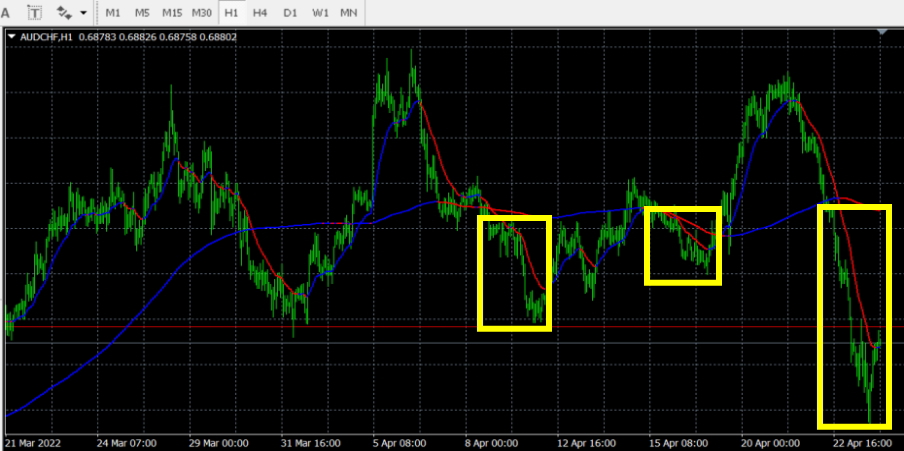
If both lines are red, it is a sell.
Indicator Performance
AUD/JPY 1-hour
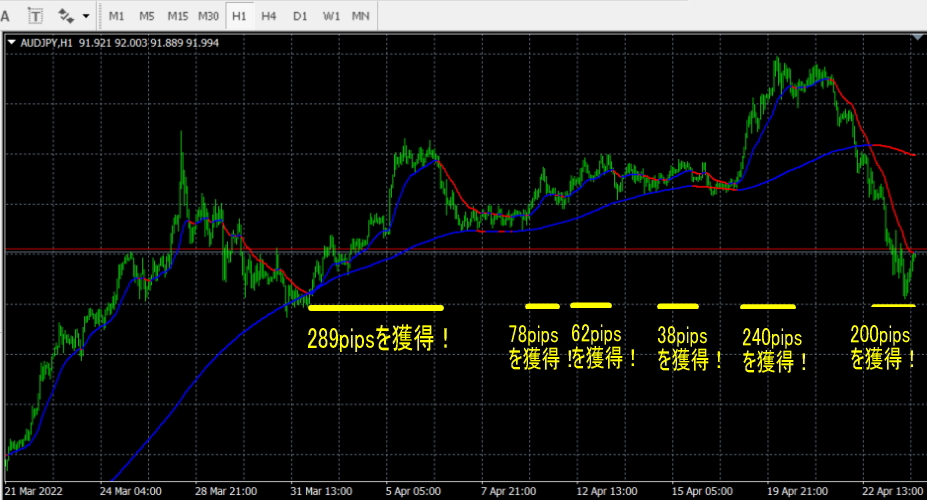
When both lines turn blue, or are blue, it rises significantly.
NZD/USD 1-hour
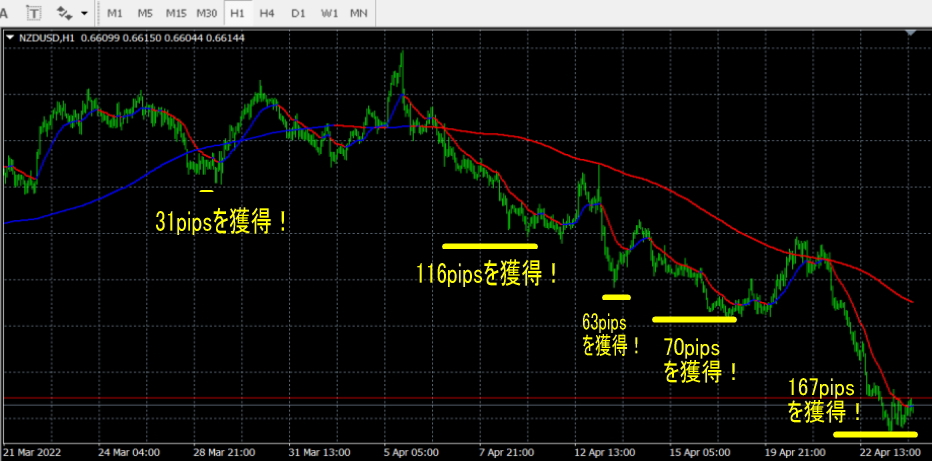
When both lines are red or blue, it falls significantly.
GBP/NZD 1-hour
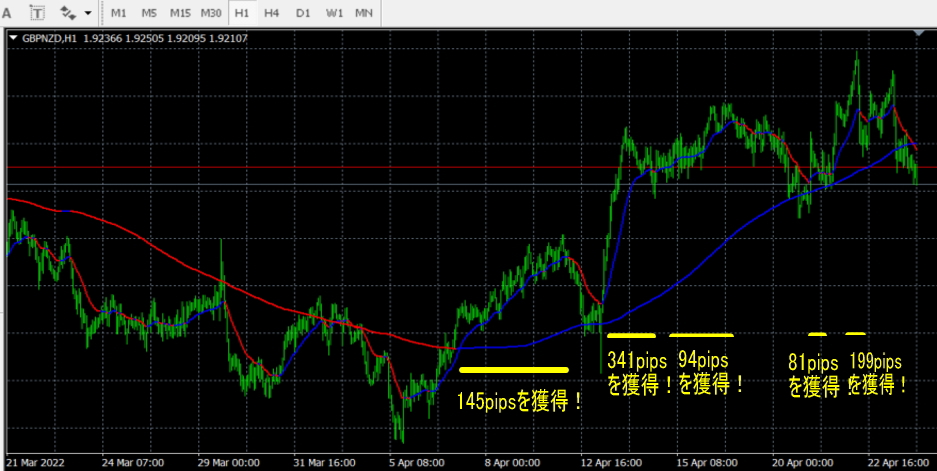
When both lines turn blue or are blue, it rises significantly.
【Indicator Performance】
This indicator’s edge is evident in past charts as well.
Signals that capture the initial surge of a strong trend are followed by stable gains,
recreating ideal entry timings to ride the momentum.
EUR/JPY (1-hour) … Maximum +573 pips
USD/CHF (1-hour) … Maximum +268 pips
GOLD (15-minute) … Maximum +368 pips
GBP/AUD (5-minute) … Maximum +108 pips
CAD/CHF (1-hour) … Maximum +252 pips
USD/CAD (5-minute) … Maximum +78 pips
As shown by numerous verification data,
signals that accurately capture the initial move of a trend continue to grow profits.
In a single trade, for example with EUR/JPY, you may target 200–500 pips at times,
With 100k units, you could see profits on the order of 200k–500k.
By using this signal tool myself, I have been able to secure profits of over 1 million yen per month consistently.
※The pips values and profit examples above are based on past verification and individual results and do not guarantee the same results in all environments or markets. Please use with proper capital management and strict risk controls.
Indicator Features
- Compatible with all timeframes and all currencies.
- Available for MT4.
- Sell timing: both lines red.
- Buy timing: both lines blue.
The market moves today as well.
Are you ready to ride the trend?
The “Strongest Moving Average Indicator” will simplify your trading judgments and make them more confident.
Begin to seize the power to catch trends today.
Purchase here ↓