
【11/3 Night Aussie Dollar】Moves in a range of 0.69933 to 0.70337, ending Monday around the 0.699s — Structure of the market seen on LIGHTHOUSE and near-term targets
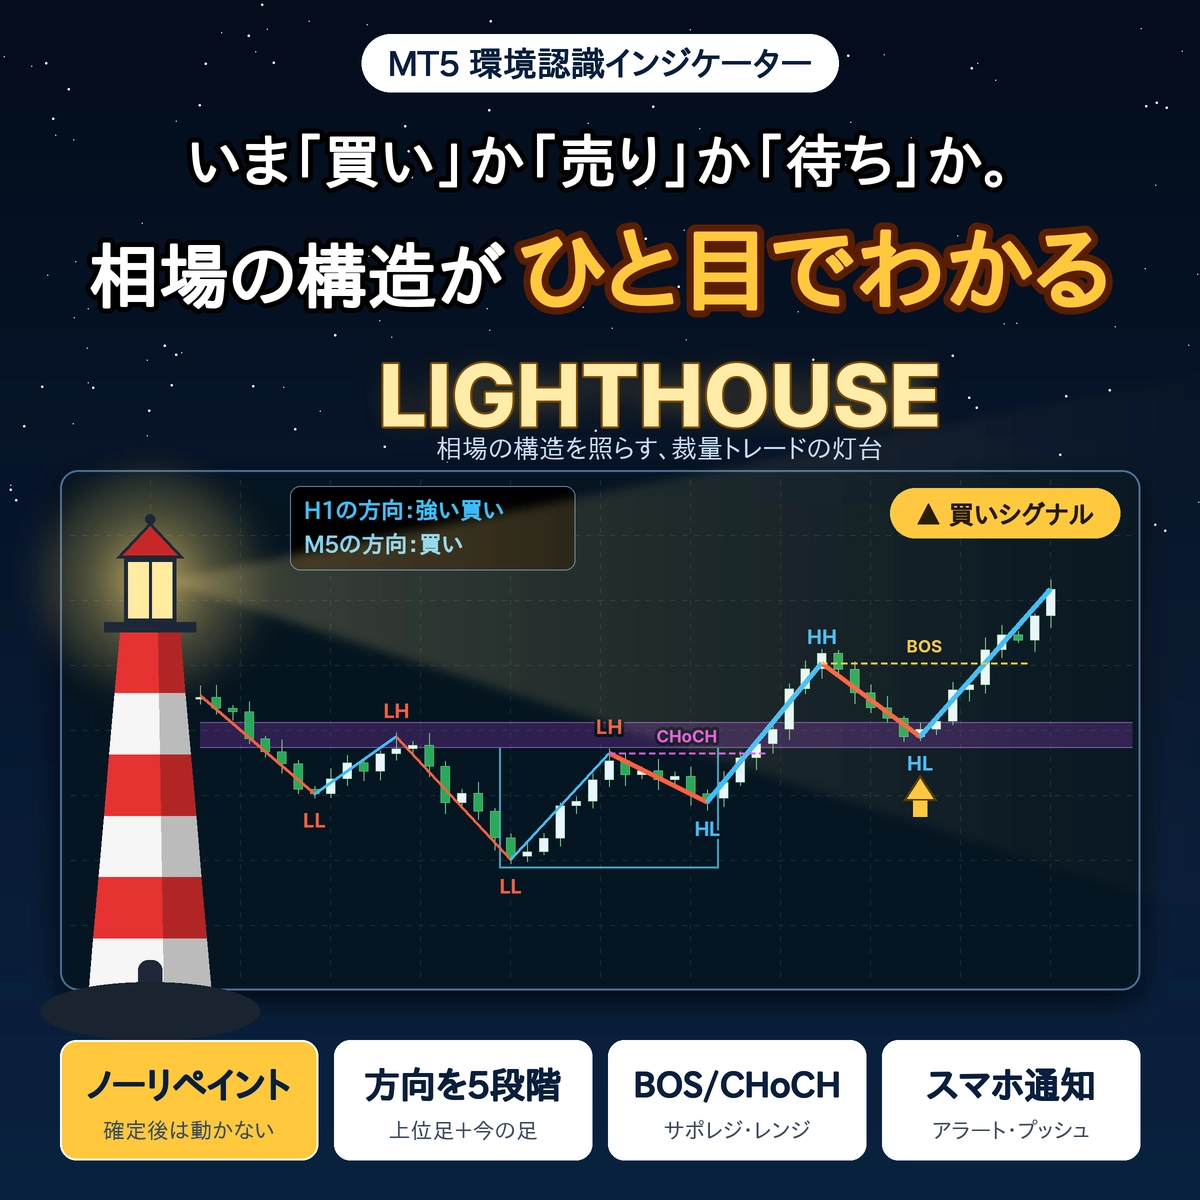
About LIGHTHOUSE
LIGHTHOUSE (Lighthouse) automatically displays the chart's “reading” portionas an aid indicator for discretionary trading.
・Display the direction of the higher timeframe and the current bar in five levels at the top-left of the chart
・Automatically display the lines for high/low updates (HH/HL/LH/LL) and BOS/CHoCH
・Show pullback/retracement zones, support-resistance reversal zones, and range boxes
・The marks for peaks and valleys are confirmed and do not move or disappear afterward (no repaint)
・Since meanings of terms are shown at the bottom-left of the chart, you can learn by looking at them
Trading decisions are to be made by you, and this tool is to quickly assemble the materials for judgment at a glance.
【Key Points】Gold/Australian Dollar memo up to the close on Monday, November 2
・Low on October 150.68934to high on the 29th0.70672after retracing, on Monday, November 2, the low0.69933fell to (the same level as the low on the 22nd)
・The close on Monday, November 2 is0.69972(high 0.70337, low 0.69933 on that day)
・Above are0.70337・0.70672, below are0.69933・0.68934these are the price ranges that tend to be watched first
1. Recent Market Feel (weekly, daily, 1-hour)
Weekly: from 0.70331 in the week of Oct 19–23 to 0.70306 in the week of Oct 26–30, ending at nearly the same level
The weekly close: week of Sep 21: 0.70242, week of Sep 28: 0.69524, week of Oct 5: 0.69802, week of Oct 12: 0.69441, week of Oct 19–23: 0.70331, week of Oct 26–30: 0.70306. In the week of Oct 26–30, the high was 0.70672 and the low 0.70088, ending near the previous week's close. The new week moved from 0.69933 to 0.70337 on Nov 2 and closed at 0.69972.
Daily: rose to 0.70672 on the 29th, then fell to 0.69933 to 0.69972 on Nov 2
Oct 26 (Mon) moved between 0.70117 and 0.70390, ending at 0.70160; Oct 27 (Tue) moved 0.70088–0.70397, ending at 0.70241; Oct 28 (Wed) moved 0.70222–0.70641, ending at 0.70526. Nov 29 (Thu) moved between 0.70672 high and 0.70140 low, ending at 0.70284; Oct 30 (Fri) moved 0.70129–0.70424, ending at 0.70306. On Nov 2 (Mon), price moved from 0.70337 high to 0.69933 low and closed at 0.69972.
1-hour: from 0.70337 at 2:00 on the 2nd to 0.69933 by 23:00
On the 30th, price moved 0.70129–0.70424, ending at 0.70306 by 23:00. On the 2nd, after reaching a high of 0.70337 at 2:00, it dropped the 11:00 peak to 0.70305, then fell to 0.69985 by 15:00. It recovered to 0.70206 by 17:00, but at 23:00 it hit a low of 0.69933 and closed at 0.69972.
Price levels likely to be watched (based on chart facts)
| 0.70672 | High on the 29th |
| 0.70337 | High on the 2nd (2:00 AM) |
| 0.70206 | Retrace high on the evening of the 2nd (5 PM) |
| 0.69972 | Close on Monday, Nov 2 |
| 0.69933 | Low on the 2nd (23:00). Same as Oct 22 low |
| 0.68934 | Low on Oct 15 |
Be aware that around major economic releases or speeches, price movements can be large, so please check the schedule yourself. The numbers in the text are up to the 23:00 hours server time on Monday, November 2 (the chart image also includes a bit of the foot at 0:00 on Tuesday, the 3rd).
2. When you view the same chart with LIGHTHOUSE
From here, you will view the same USD/JPY chart with LIGHTHOUSE applied.
Daily (upper frame is weekly): Weekly is “Buy”, daily is “Strong Sell”
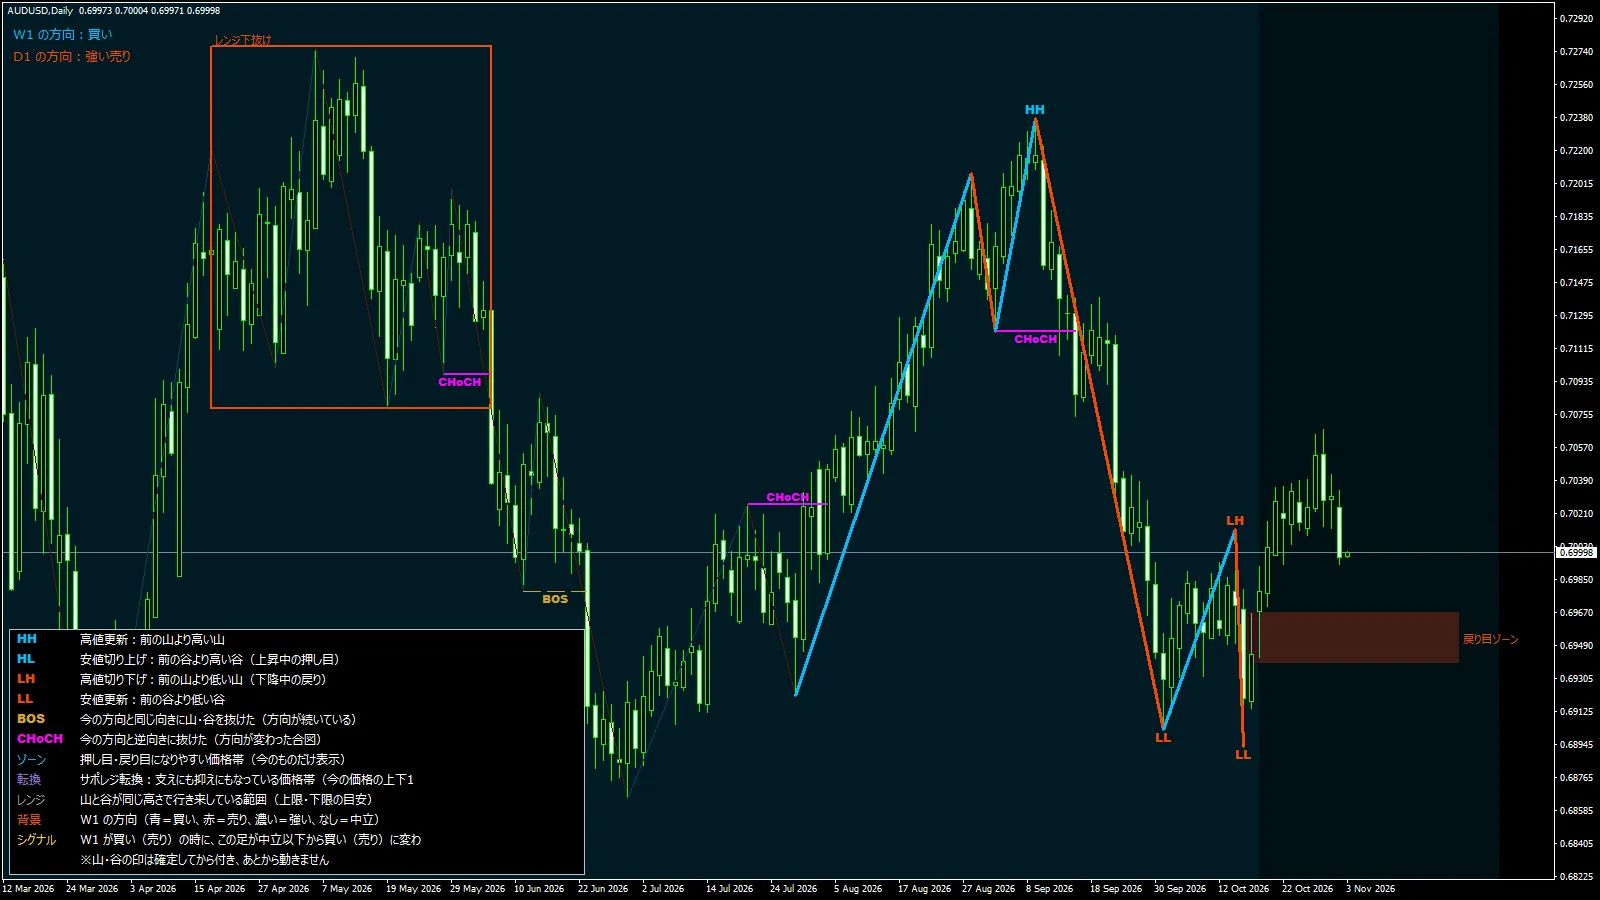
The upper left shows “W1 direction: Buy” and “D1 direction: Strong Sell.” After the highs in early September,HH, a valley near late September and around October 15 showsLL, and between them a peak showsLH.
Below price, around 0.6934–0.6967, anRetracement Zone
1-hour (daily upper): Both daily and 1-hour are “Strong Sell”
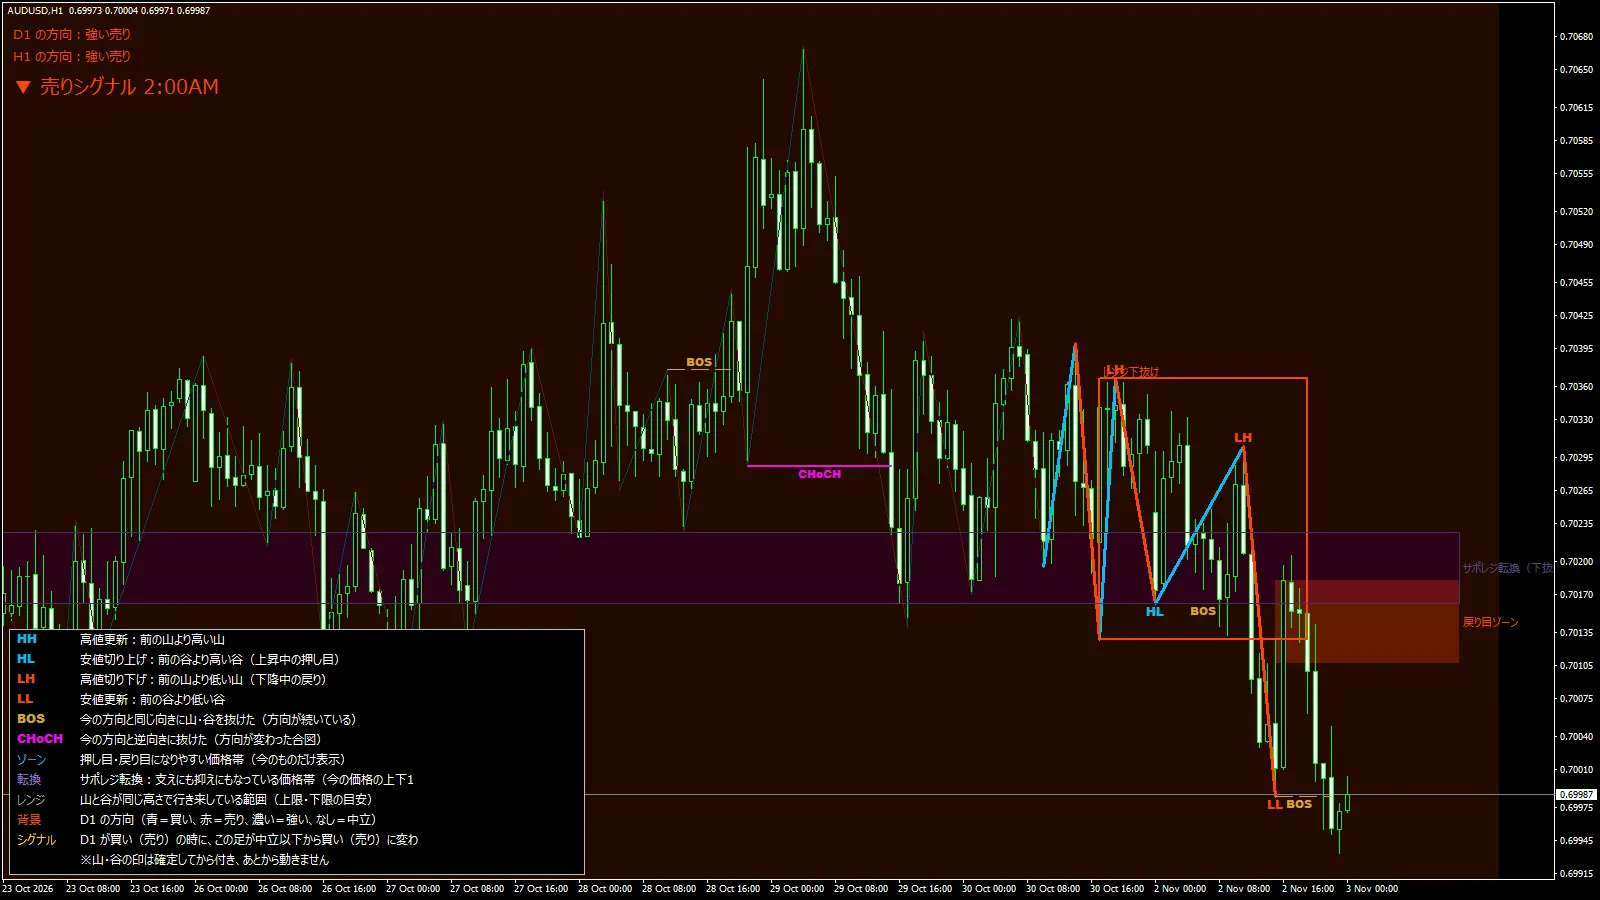
The upper left shows “D1 direction: Strong Sell” and “H1 direction: Strong Sell,” and the “Sell signal 2:00 AM” is also displayed. On the 30th around 19:00, a peakLH, a valley at 2:00,HL, a peak at 11:00,LH, a valley at 15:00,LL andBOS appear.
Above price, aRetracement Zonearound 0.7011–0.7018, and aSupport/Resistance Reversal Zonearound 0.7017–0.7022 are displayed.
5-minute (1-hour upper): Both 1-hour and 5-minute are “Strong Sell”
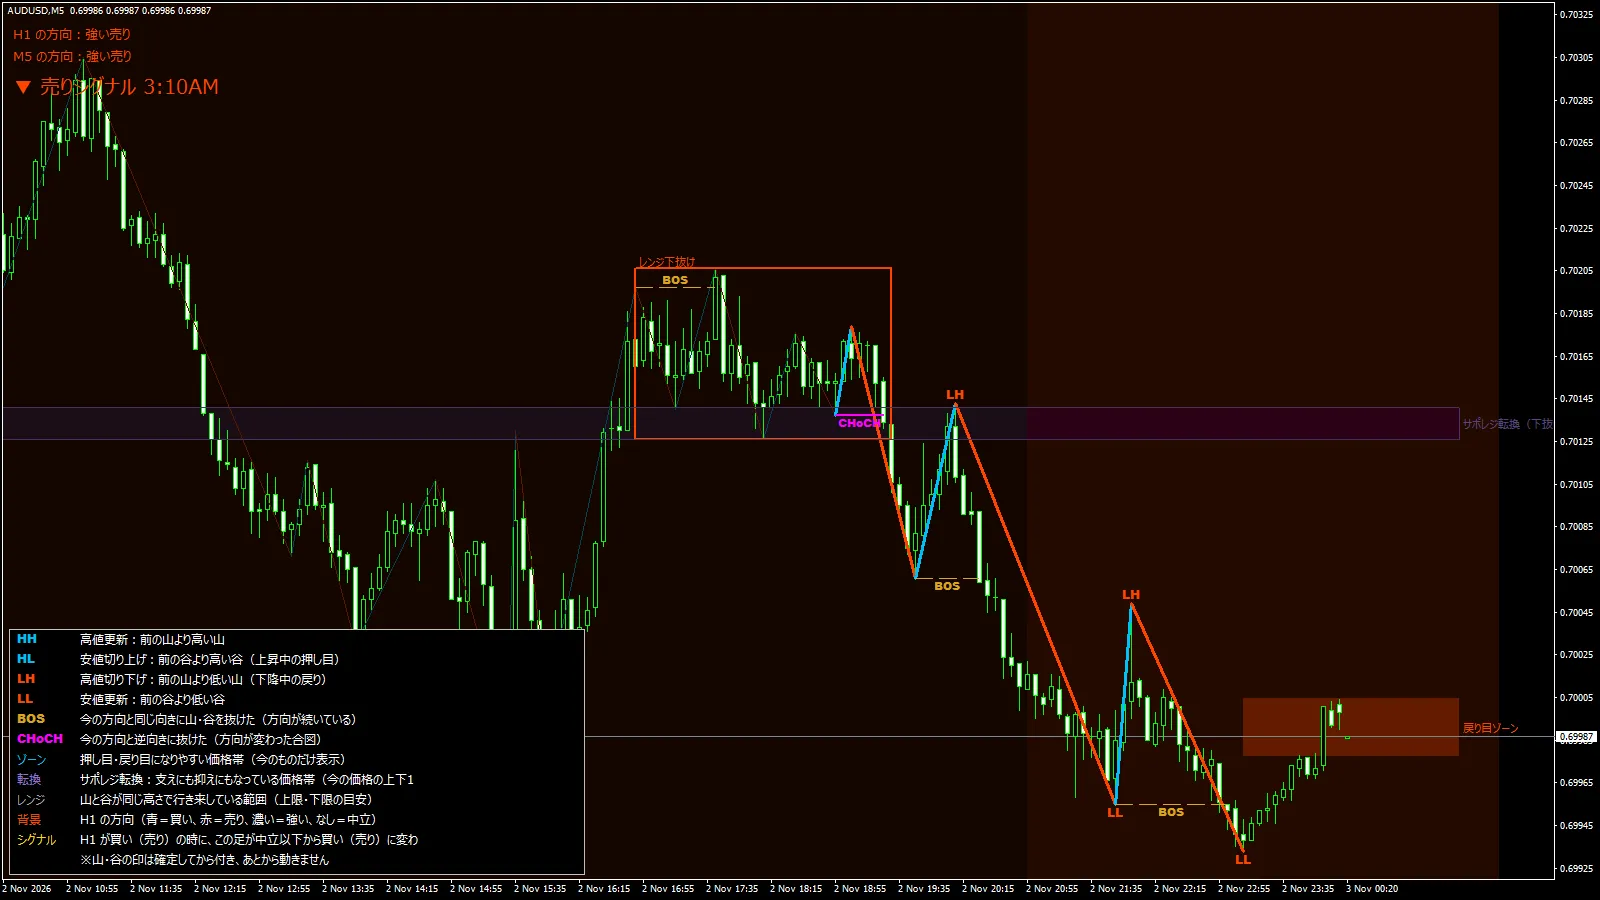
The upper left shows “H1 direction: Strong Sell” and “M5 direction: Strong Sell,” and the “Sell signal 3:10 AM” is also displayed. From the evening of the 2nd into the night, peaksLH occurred twice, valleysLL twice, andBOS also appeared.
Around price, aRetracement Zonearound 0.6998–0.7000, and above aSupport/Resistance Reversal Zonearound 0.7012–0.7014 are displayed. When the directions of the higher frame and the current bar align, you can observe which bar's movement switches first.