
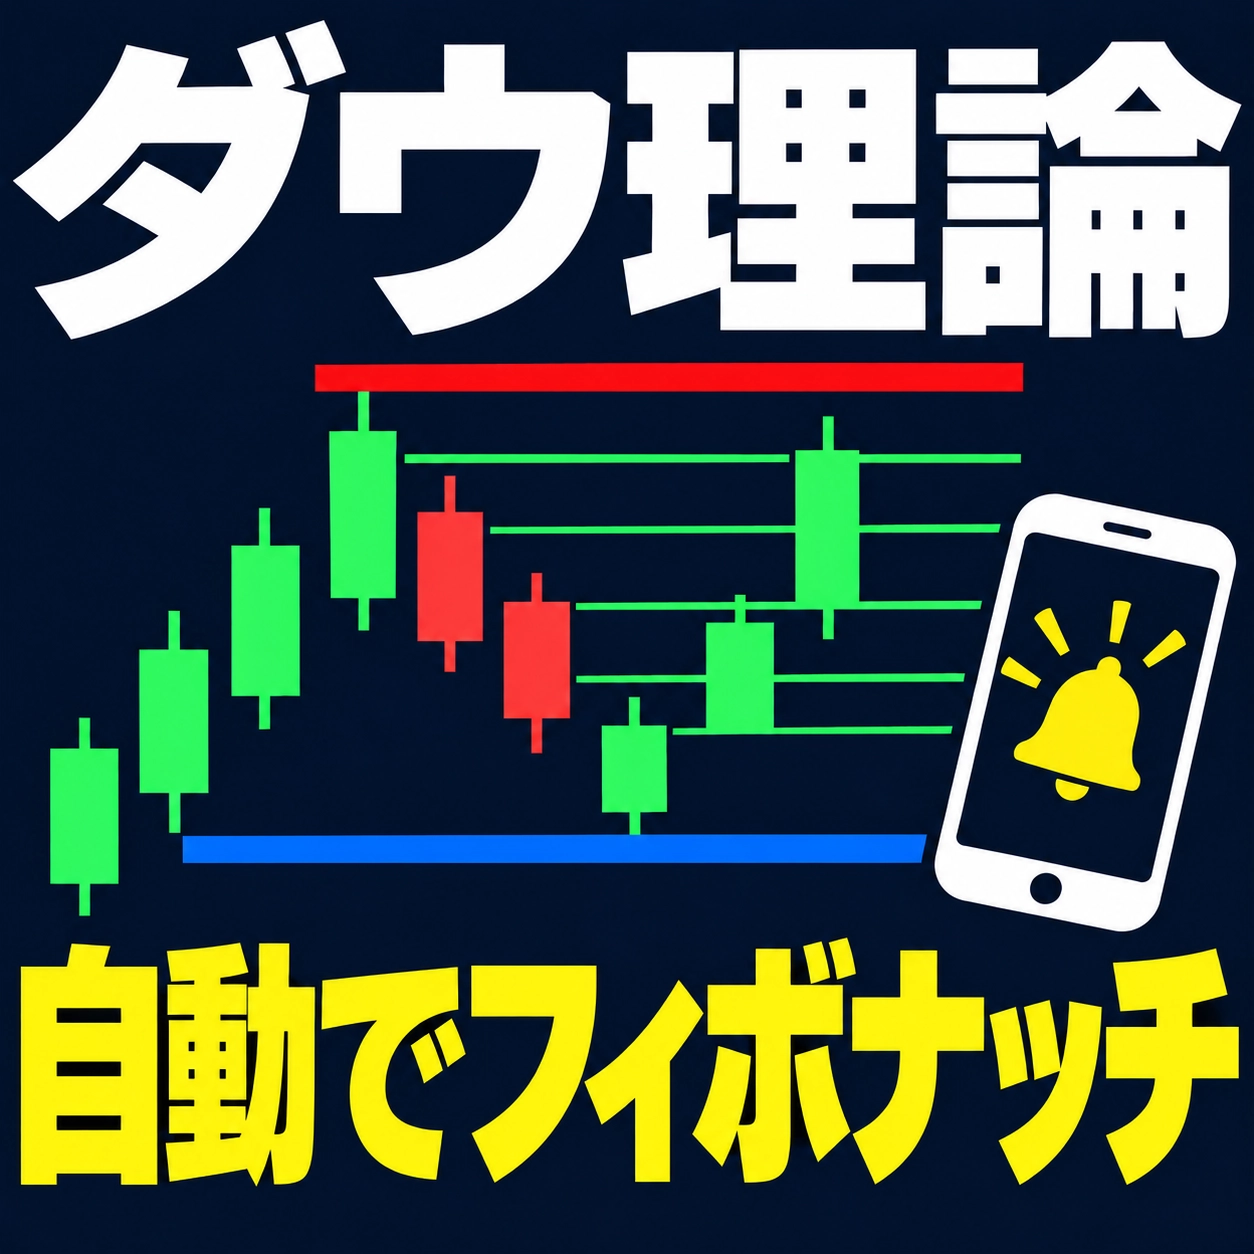
[MT4] Dow Theory × Fibonacci Indicator Released
Hello, I am Ama Papa @ FX Craftsman.
I understood that the Dow Theory indicates an uptrend.
Next, I will wait for a pullback to buy.
Up to here, I think many people are the same.
The hard part is what comes next.
How long should you wait for a pullback?
This time, using Dow Theory and Fibonacci
to measure the depth of pullbacks,
and introducing an indicator that does it automatically.
■ Fibonacci depends on “where you draw from”
When measuring the pullback depth,
Fibonacci is commonly used.
Between the high and the low,
draw levels of 38.2%, 50%, and 61.8%,
to see how far it pulled back.
But here, you get confused.
From which low to which high should you draw?
If you include every tiny peak and trough,
the drawing position keeps changing each time.
For different people, or on different days,
the draw points vary.
■ The starting point is the Dow Theory’s “pullback low”
In Dow Theory, an uptrend continues with
“higher highs and higher lows.”
What matters is
the pullback low.
As long as this pullback low is not breached,
the uptrend is considered ongoing.
Therefore, for Fibonacci used to measure pullbacks,
draw from the pullback low toward the high.
If you fix it this way,
you won’t get lost on where to draw.
(In a downtrend, from the swing high back to the low)
■ Still two extra steps remain
Even after the drawing method is decided,
two more steps remain.
1. Redrawing
Every time a new high is set,
you need to redraw the Fibonacci levels.
If you switch currencies or timeframes, you start over again.
2. Waiting
You have to wait for the pullback to come down,
watch the chart, and wait.
During the wait, pullbacks may pass while you’re not watching,
or you may jump in too early when you can’t wait.
■ Automatic drawing and waiting
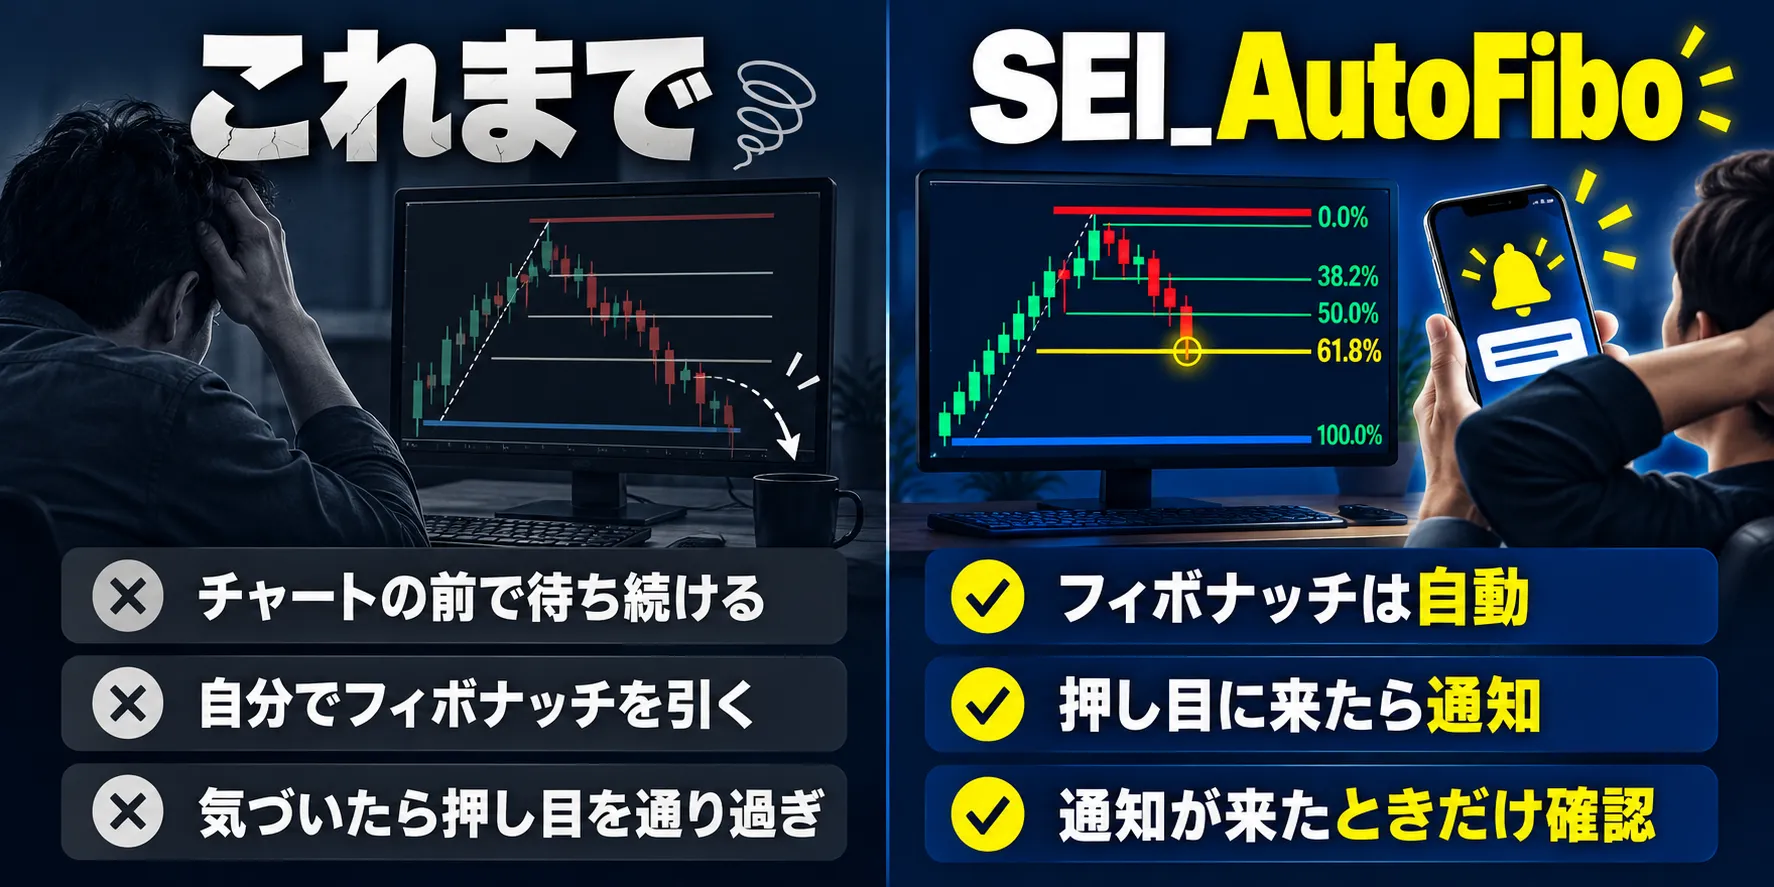
Personally, these two tasks are so bothersome that I had to automate them,
so I created an indicator that does it automatically.
I use it every day now.
What it can do
・Automatically find Dow Theory pullback lows and reversal highs,
and draw Fibonacci levels
・If highs are updated or pullback lows are broken,
re-draw immediately
(even when switching currencies or timeframes, it redraws instantly)
・When 38.2%, 50%, or 61.8% are reached,
it notifies via pop-up or smartphone
Alerts trigger after a new high or low is made,
only when it first touches that level.
It won’t ring repeatedly while it swings up and down.
■ Now on sale (MT4)
【MT4】Auto-display Fibonacci on Dow Theory highs/lows with pullback alerts
We aren’t offering discount sales on the product.
Prices rise with the number of units sold.
Stage 1: 500 yen (first 5 units)
Stage 2: 1,980 yen (next 10 units)
Stage 3: 3,980 yen (next 15 units)
After that: 5,980 yen
▼ Product page
https://www.gogojungle.co.jp/tools/indicators/88653
You can verify operation and alerts with the trial version.
▼ Trial version
https://www.gogojungle.co.jp/tools/indicators/89495
■ Also available with the free SEI_Dow_Line
The free “Dow Theory Confirmed Display and Line Auto-Display Indicator”
shows in color whether Dow Theory is confirmed from the most recent peak and trough.
Use Dow_Line to confirm the trend,
and wait for pullbacks with this indicator.
Since it is built with the same concept, they can be used together.
▼ SEI_Dow_Line (free, MT4)
https://www.gogojungle.co.jp/tools/indicators/28740
You don’t need to spend time waiting for pullbacks on the chart.
Only when alerts arrive should you make a judgment.
If you have questions, please feel free to use the “Community” on the product page.
We look forward to helping you.