

【11/2 Morning Pound-Dollar】Ending higher for the third straight week, closing in the 1.338 range on Friday|LIGHTHOUSE view of market structure and recent target opportunities
About LIGHTHOUSE
LIGHTHOUSE (Lighthouse) automatically displays the “reading” part of the chartA discretionary trading auxiliary indicator.
・Displays the direction of the higher timeframe and the current candle in five levels at the top-left of the chart
・Automatically displays the lines for new highs/lows (HH/HL/LH/LL) and BOS/CHoCH
・Shows pullback/retracement zones, support-resistance reversal zones, and range boxes
・The marks of peaks and valleys are fixed once confirmed and do not move or disappear later (no repaint)
・The meanings of terms are displayed at the bottom left of the chart, so you can learn while watching
Trading decisions should be made by yourself, and this tool helps you gather the decision-making materials at a glance.
【Key points】 Pound-dollar memo up to the closing price on October 30 (Friday)
・Low on October 141.31364rebound, and on the 30th (Friday) a high of1.34331was made, surpassing the high of 1.34183 on the 22nd
・The closing price on October 30 (Friday) was1.33877(high of the day 1.34331 / low 1.33713)
・Above are1.34331・1.34183, below are1.33713・1.32718, which are the price ranges likely to be watched first
1. Recent Market Feel (Weekly, Daily, 1-hour)
Weekly: From the week of October 12 at 1.33246, to the week of the 26–30 at 1.33877, continuing to rise for three weeks
The weekly close values are: week of Sep 21 at 1.32437, week of Sep 28 at 1.32368, week of Oct 5 at 1.32265, week of Oct 12 at 1.33246, week of Oct 19–23 at 1.33728, week of Oct 26–30 at 1.33877. The week of 26–30 had a high of 1.34331 and a low of 1.32718, finishing about 0.0015 higher than the previous week's close.
Daily: After closing at 1.33041 on the 27th, on the 30th it reached a high of 1.34331 and closed at 1.33877
On Friday, Oct 23, it moved between 1.33602 and 1.34069 and closed at 1.33728. On Mon 26 it moved between 1.33271 and 1.33868, closing at 1.33405; Tue 27 between 1.33025 and 1.33484, closing at 1.33041; Wed 28 between 1.32718 and 1.33380, closing at 1.33249; Thu 29 between 1.32952 and 1.33839, closing at 1.33747. On the 30th, it moved from a low of 1.33713 to a high of 1.34331, closing at 1.33877.
Hourly: After rising to 1.34331 in the 14:00 hour on the 30th, it fell to 1.33733 by 17:00
On the 29th, it posted a low of 1.32952 around 12:00, then climbed into the night, ending at 1.33747 around 23:00. On the 30th, it reached a high of 1.34067 around 04:00 and a low of 1.33795 around 08:00, then rose to 1.34331 in the 14:00 hour, and after that fell to 1.33733 by 17:00, ending at 1.33877 around 23:00.
Important price ranges to watch (based on chart facts)
| 1.34331 | High of the day on the 30th (14:00) |
| 1.34183 | High on the 22nd |
| 1.34086 | High on the 20th |
| 1.33877 | Closing price on Oct 30 (Fri) |
| 1.33713 | Low on the 30th (0:00 hour) |
| 1.32718 | Low on the 28th |
| 1.31364 | Low on Oct 14 |
Before and after economic announcements or speeches, price moves can become more volatile, so please confirm the schedule yourself. The chart image also includes some data up to 5:00 server time on Monday, November 2 (the numbers in the text refer to the closing price on Oct 30).
2. If you view the same chart with LIGHTHOUSE
From here, we will view the same Pound-Dollar chart with LIGHTHOUSE included.
Daily (higher timeframes are weekly): both weekly and daily indicate a “sell”
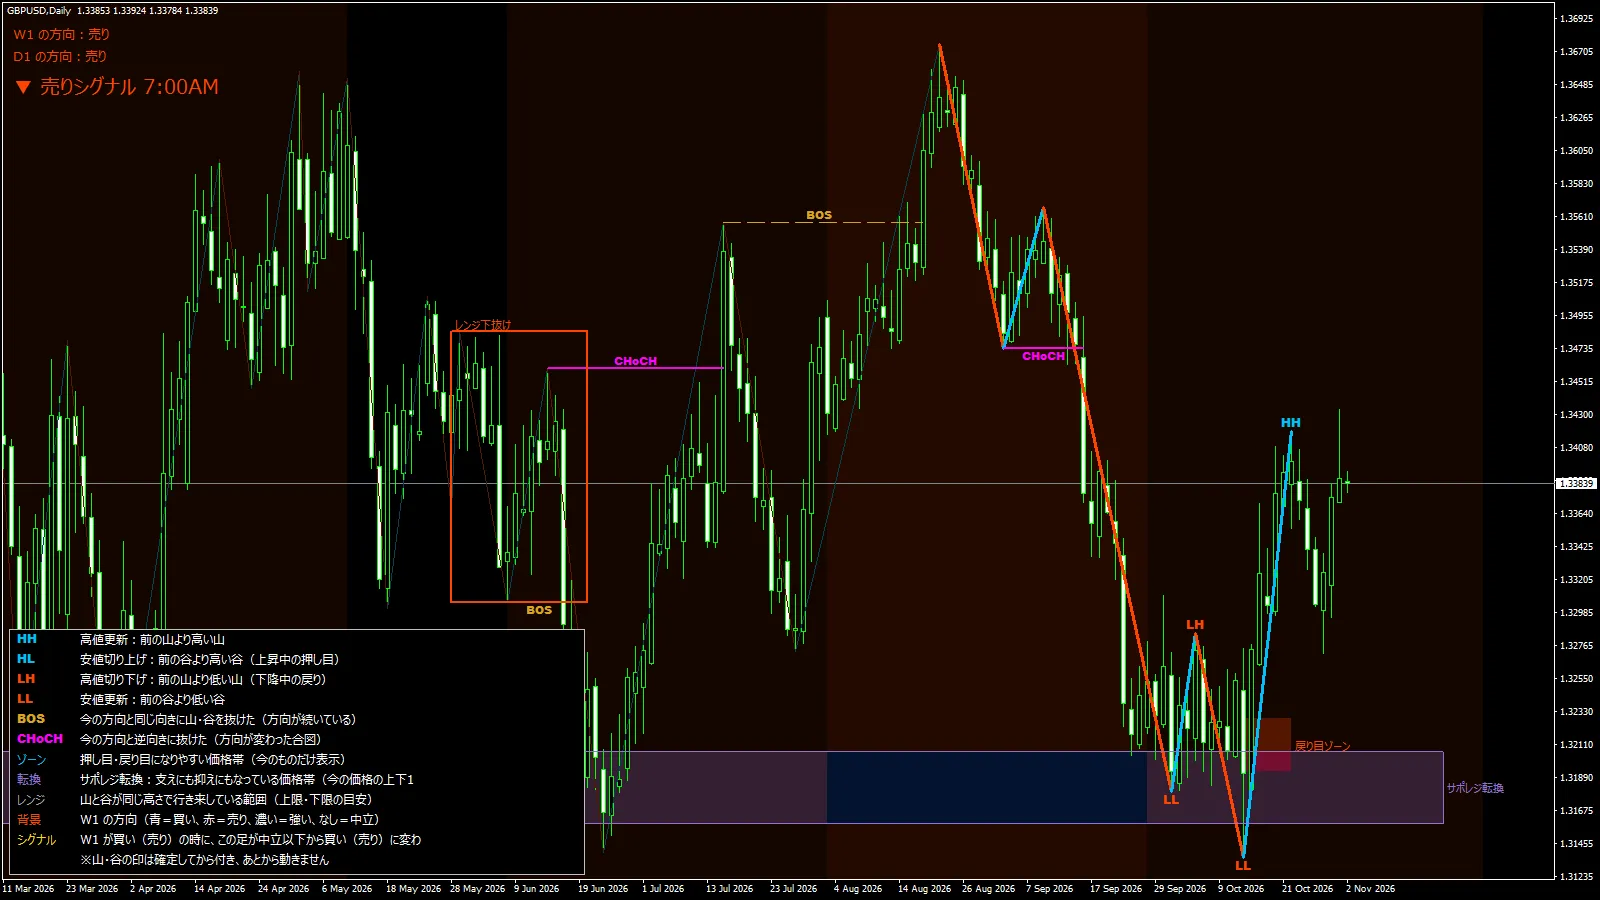
The top-left shows “W1 direction: Sell” and “D1 direction: Sell.” During the fall from August highs, the lows on late September and October 14 showLL, and between those peaks aLHHH
Below the price, around 1.316–1.320 is aSupport/Resistance reversal zone, around 1.321–1.323 is aRetracement zone, and although the 30th high exceeded the 22nd high, the current price is well above these zones.
Hourly (Daily on the top, H1 buy): daily is sell, hourly is buy
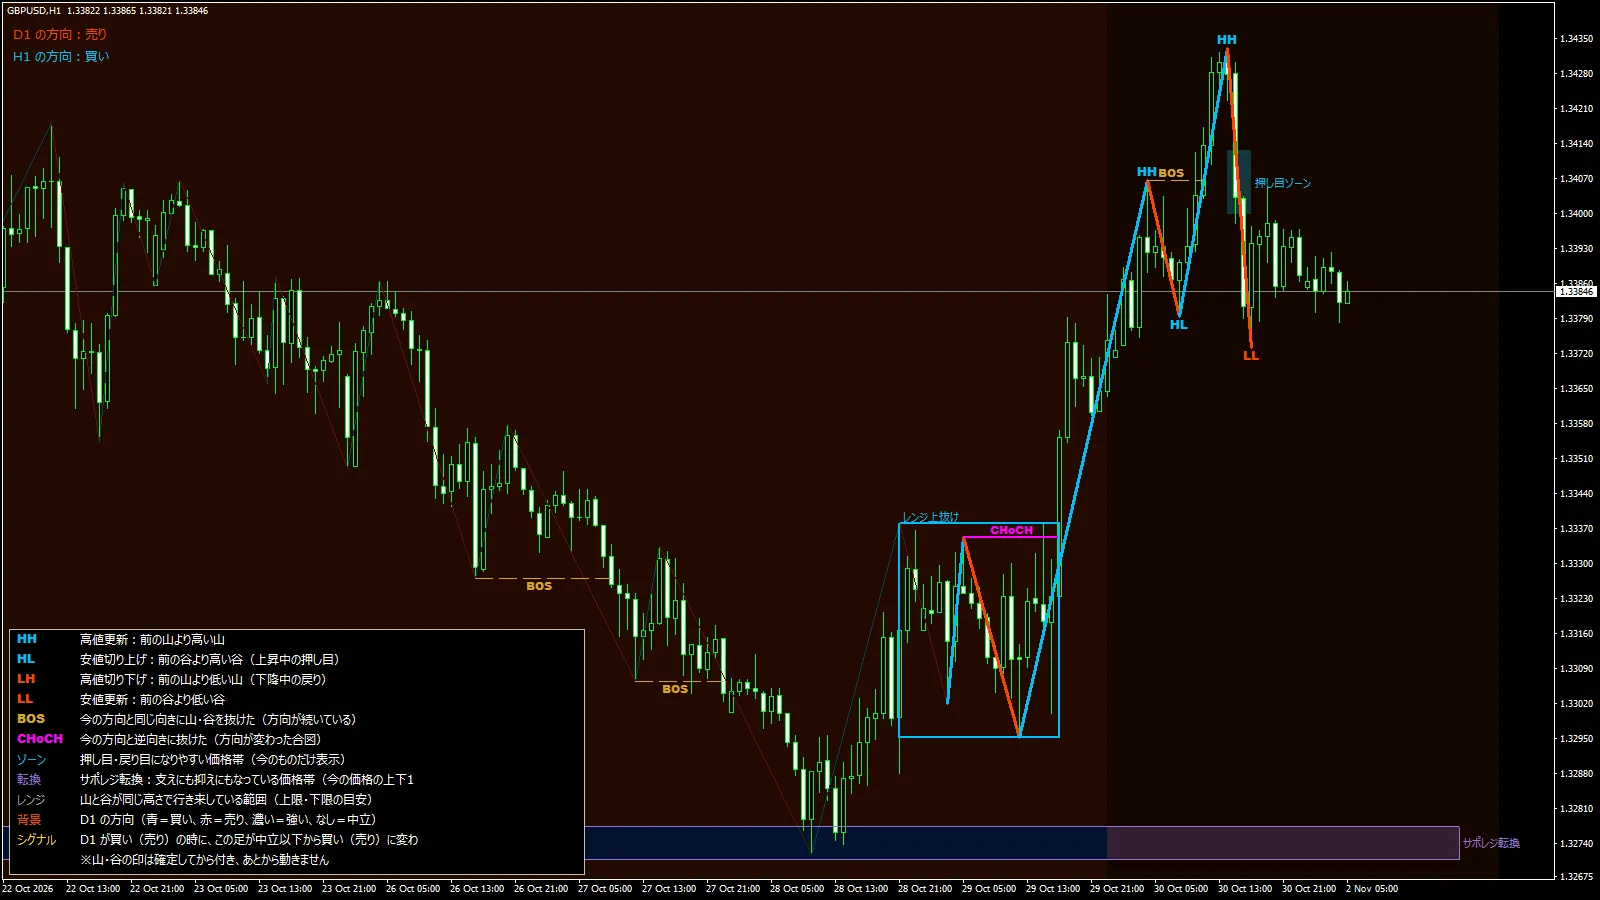
The top-left shows “D1 direction: Sell” and “H1 direction: Buy.” After breaking upward from the late-night to early-morning congestion on the 28th–29th, a CHoCH appears, and the 30th 04:00 highCHoCH appears, then the 30th 04:00 highHH andBOS, the 8:00 low forms aHL, the 14:00 high forms anHH, and the 17:00 low forms aLL.
Above the price, around 1.340–1.341 is aPullback zone, and much lower around 1.327 is aSupport/Resistance reversal zone.
5-minute (Daily on the top, M5 neutral): daily is buy, 5-minute is neutral
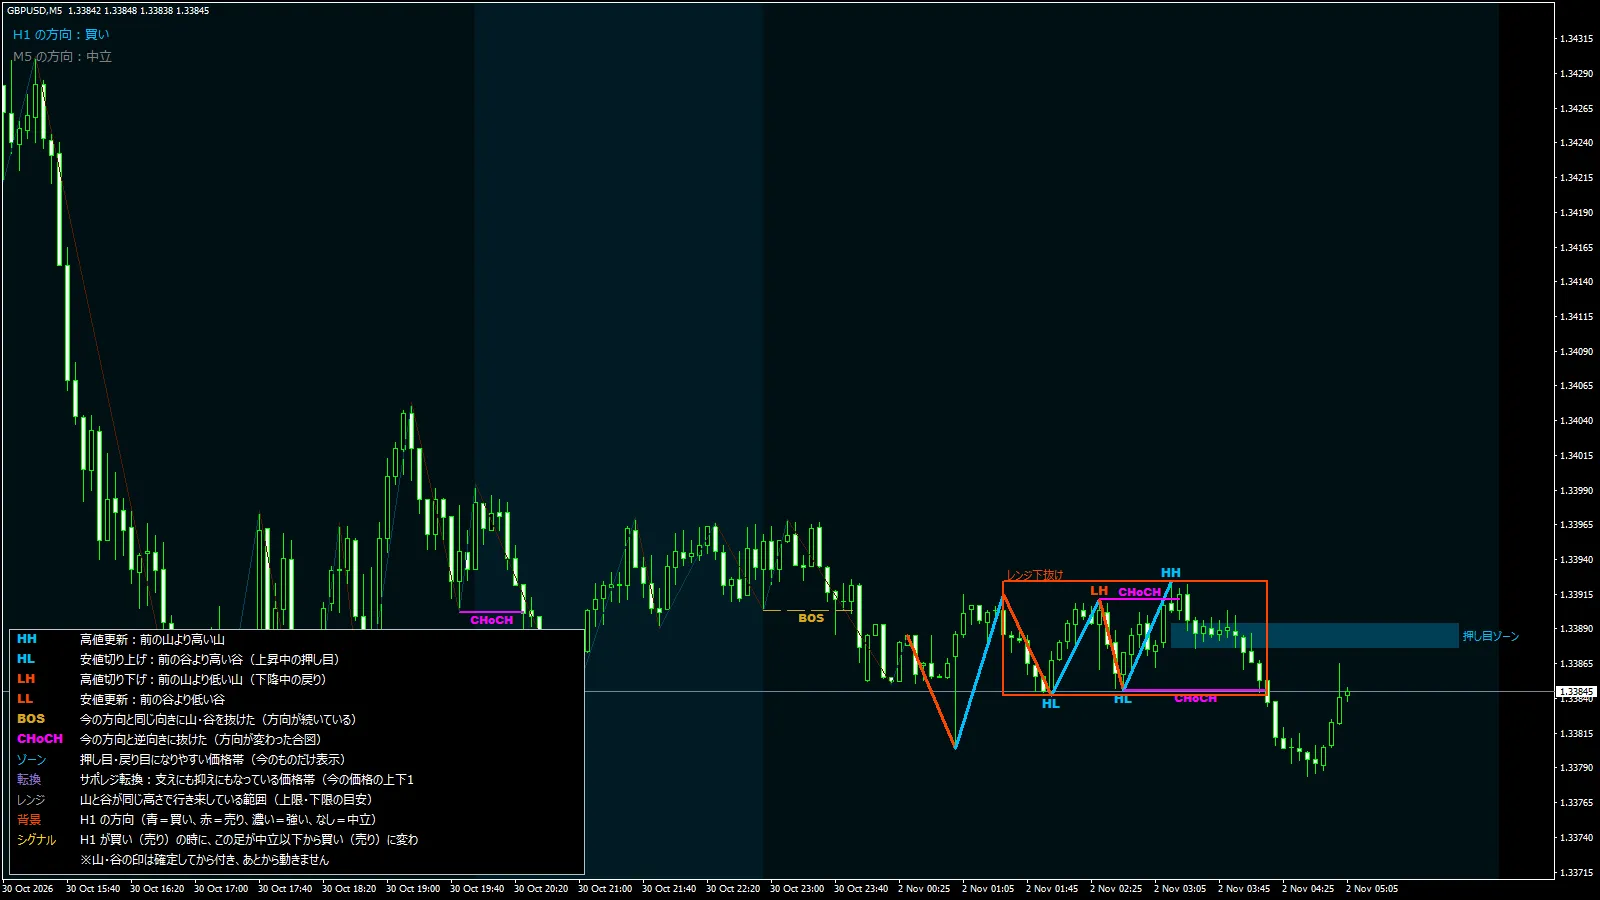
The top-left shows “H1 direction: Buy” and “M5 direction: Neutral.” After the decline on the night of the 30th, toward early Monday it forms a valleyHL, a hillLH andHH, withCHoCH also appearing.
Above the price, around 1.3388–1.3390 is aPullback zone. When higher timeframes are bullish and the current candle is neutral, observe which timeframe's move changes first.