
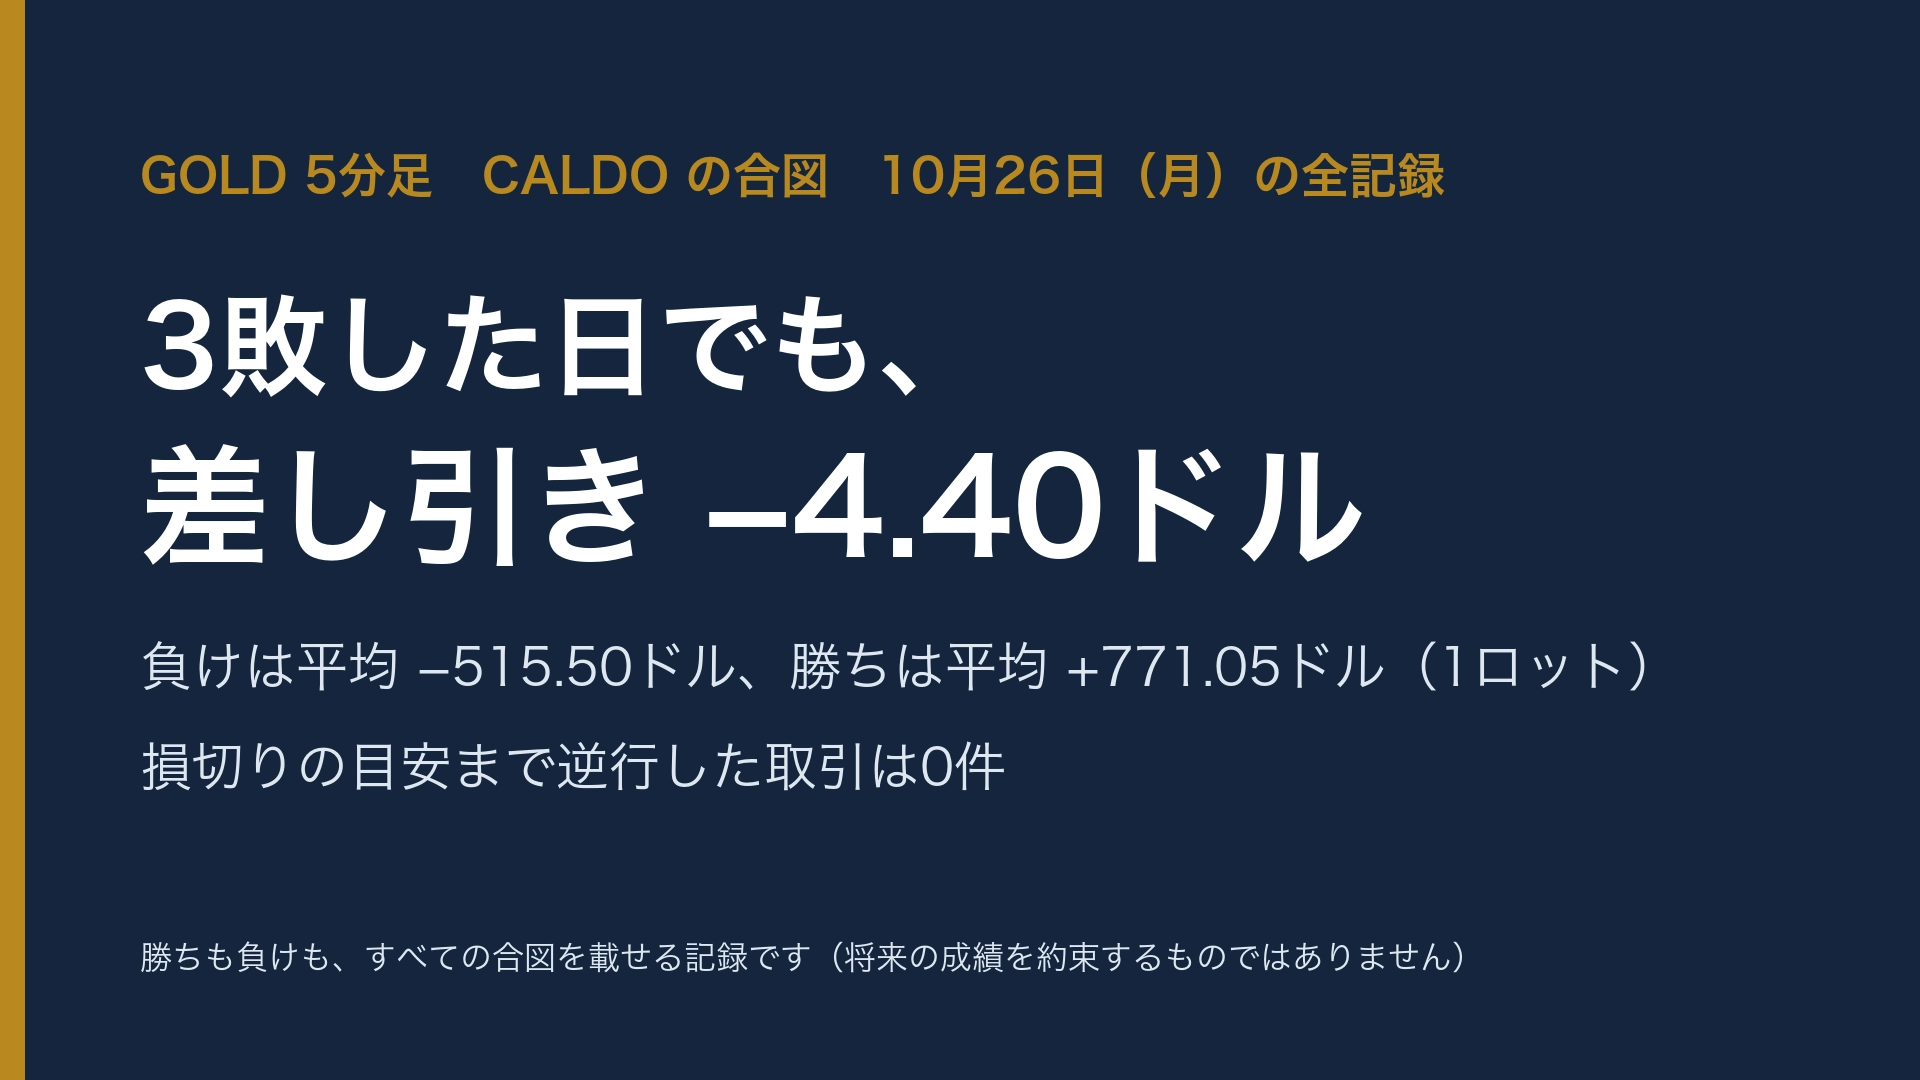
GOLD 5-minute chart CALDO signal, full record of October 26 (Monday)
When I finish work and open the chart, gold is moving. I enter for now, but I don’t know where to cut.
If it moves a little against me, I hold on thinking it “might come back,” and when there is a small unrealized gain, I quickly take profit because I’m afraid “it will disappear.” Before I know it,losses are big and gains are small. Even though I studied, my account is shrinking.
What’s missing isn’t knowledge,but a rule for every time to “cut” and “take profit” in the same way, the author believes.
This article is about GOLD (XAUUSD) 5-minute MT5 indicator being developed by the author“CALDO GOLD SIGNAL”that issued a signal on October 26 (Monday),with neither wins nor losses left outin a record of its signaling.Please look at what would have happened on a day with 3 losses if you followed the signal.
October 26, trading according to CALDO’s signals
| Signal | Win/Loss | Profit and Loss (1 lot) | PF |
|---|---|---|---|
| 5 signals (Buy 4, Sell 1) | 2 wins, 3 losses | −4.40 dollars | 1.00 |
2 wins and 3 losses among 5 signals.A day with more lossesinstead. Still, net −4.40 dollars (per 1 lot). It ends nearly at break-even.
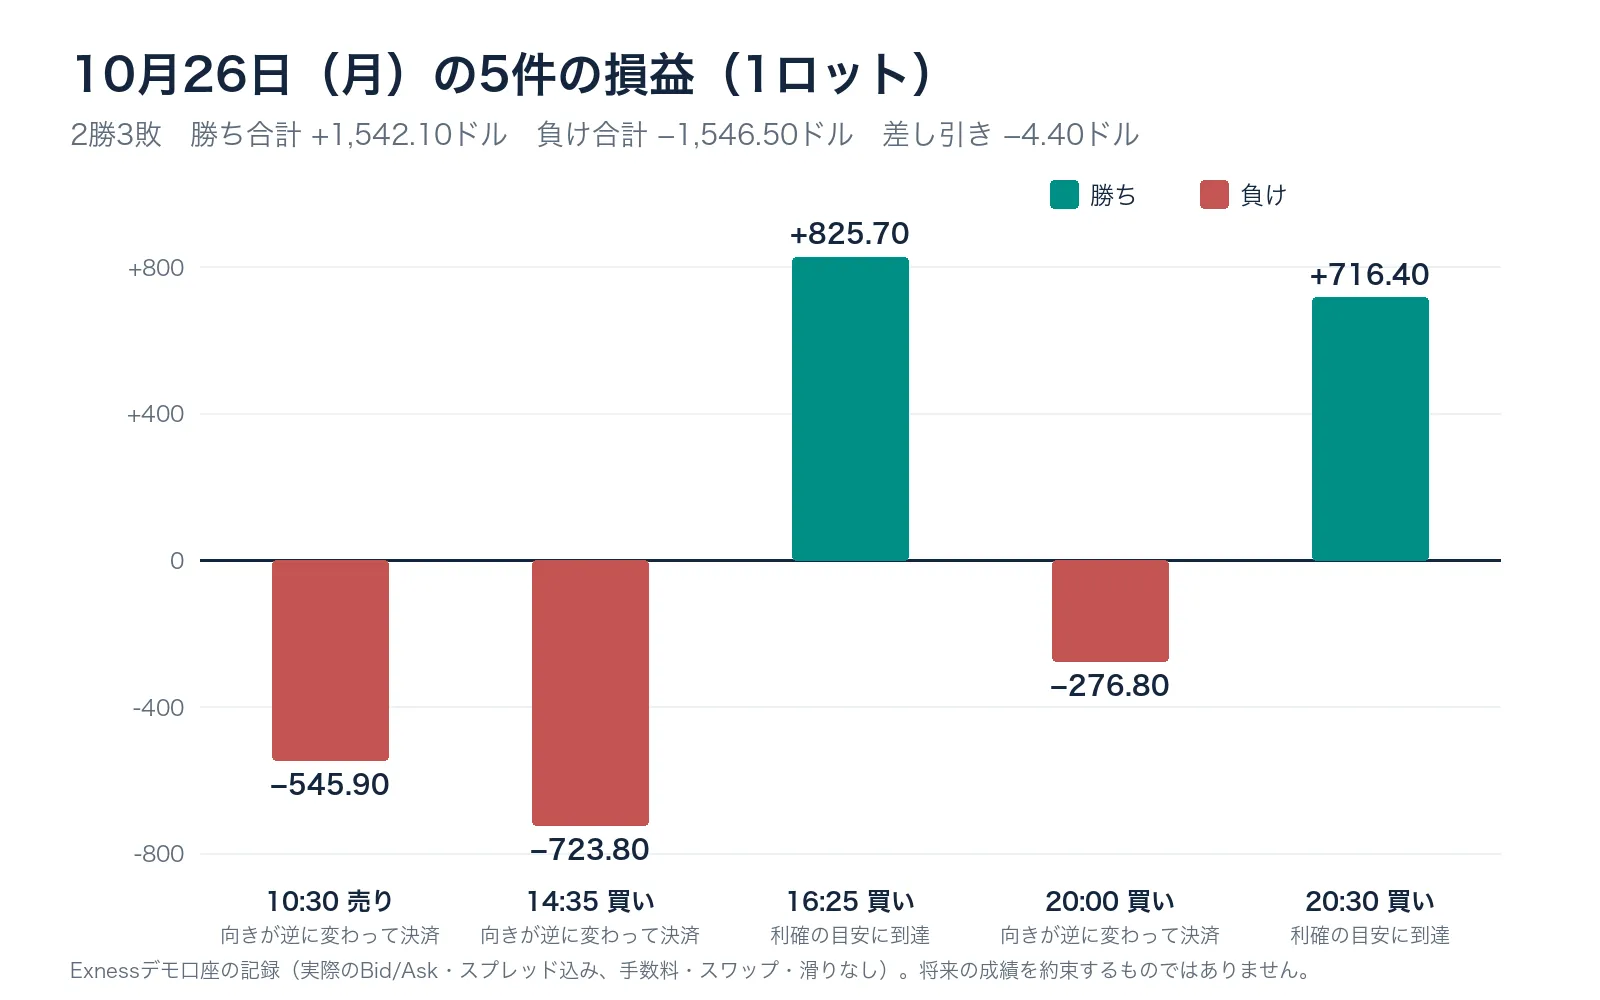
Why it didn’t collapse after 3 losses
| Count | Average per trade | How it was closed | |
|---|---|---|---|
| Losses | 3 trades | −515.50 dollars | Closed when the signal direction reversed before reaching the stop-loss guide |
| Wins | 2 trades | +771.05 dollars | Held until the take-profit guide and then closed |
On this day,there wasn’t a single trade that moved against the stop-loss guideline. The three losing trades were closed early when the direction reversed. The two winning trades were held to the take-profit target. As a result, the average loss was 515.50 dollars, while the average win was 771.05 dollars per trade. The wins were larger on a per-trade basis.
“Lose small, win to the target.” That is where human judgment most wobbles. CALDO shows not only where to enter but also the stop-loss guideline and the timing of exits on the screen. It eliminates hesitation and allows trading with the same rules every time.
What you need to do is only three things
① When the light blue up arrow (buy) or orange down arrow (sell) appears, decide whether to enter
② Place a stop-loss order at the orange dotted line (the stop-loss guideline)
③ When the yellow star appears, exit
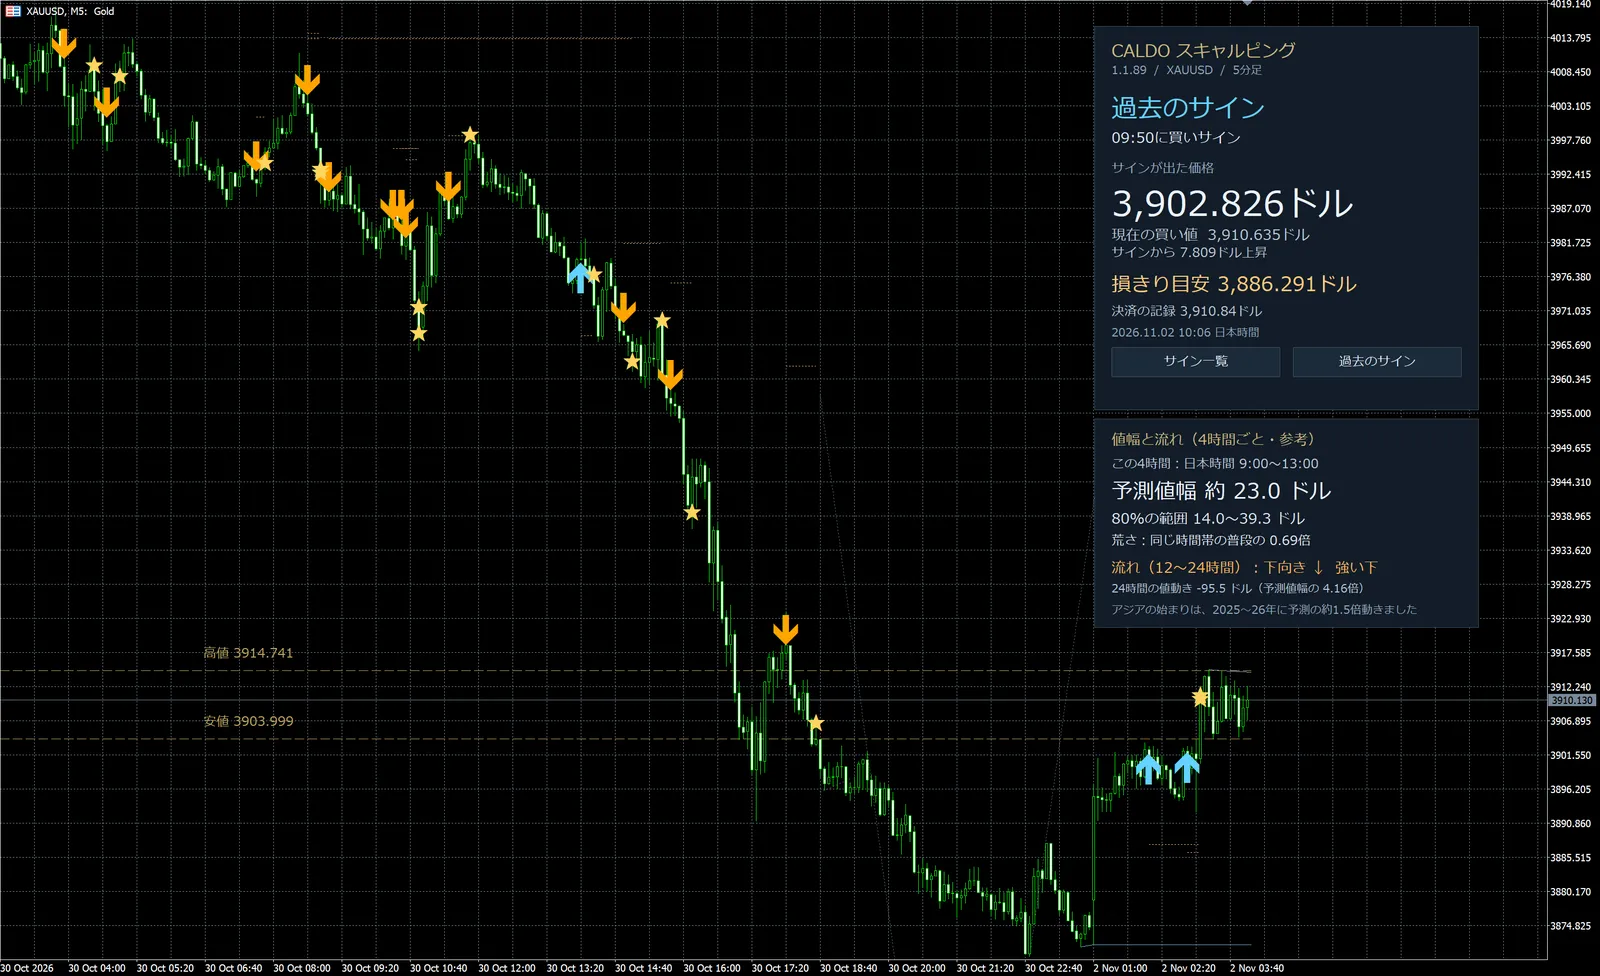
This is CALDO’s actual screen (OANDA MT5, XAUUSD 5-minute chart, a display example captured on November 2, not the October 26 screen). On the right panel, the signal price, stop-loss guideline, and exit records are shown in Japanese.
The five signals on October 26 closed within 10 minutes to 58 minutes after entry. All ended within an hour, with no carryover. It’s a short-time trading routine you can do during work breaks.
What you’ll learn next (free access)
Why did the day with three losses not collapse dramatically? The answer lies in how the five signals are closed. From here, we’ll examine each one by one.
・After a loss at 20:00, nearly recouping that day’s loss with the next signal 30 minutes later. With your own judgment, you would want to skip it
・For the three trades closed before reaching the stop-loss guideline, how many minutes after entry and for how much money were they closed
・For the two trades that held to the take-profit target, how many minutes and how many dollars did they gain
・Among the 10 types of signals, which signals did not appear that day and why
The rest can be read if you sign up for free access.
About this record:This is a demo-account record, running a version identical to the signal content CALDO GOLD SIGNAL 1.1.89 for record-keeping. The October 26 portion was created on October 31 by replaying historical price movements (ticks). Profit and loss are calculated with spread included, 1 lot (100 ounces), and do not include fees, swaps, or slippage. It is the result of trading according to CALDO’s signals and does not reflect the author’s actual trades. A day’s result does not determine overall performance or guarantee future results.