

For those who struggle to keep up with trade reflections | How to view win rate, PF, and expectancy on MT4 charts
Hello, this is Kouki_FX.
Even though I understand that reviewing trades is important, it can be a hassle to go back through history and calculate it.
“Am I overall profitable today?” “What are the win rate and PF of this method?” I also wanted to know these things just by looking at the chart, so I began creating my own indicator.
In this article, I will introduce how to review performance on MT4 charts.
Three numbers to watch when reviewing
- Win rate: the proportion of winning trades.
- PF (Profit Factor): profit ÷ loss. If it is greater than 1, the overall period was more profitable.
- Expectancy: the average per trade.
Relying on win rate alone does not reveal the weakness of a trade that loses big once. When you view all three together, it becomes easier to grasp your trading tendencies.
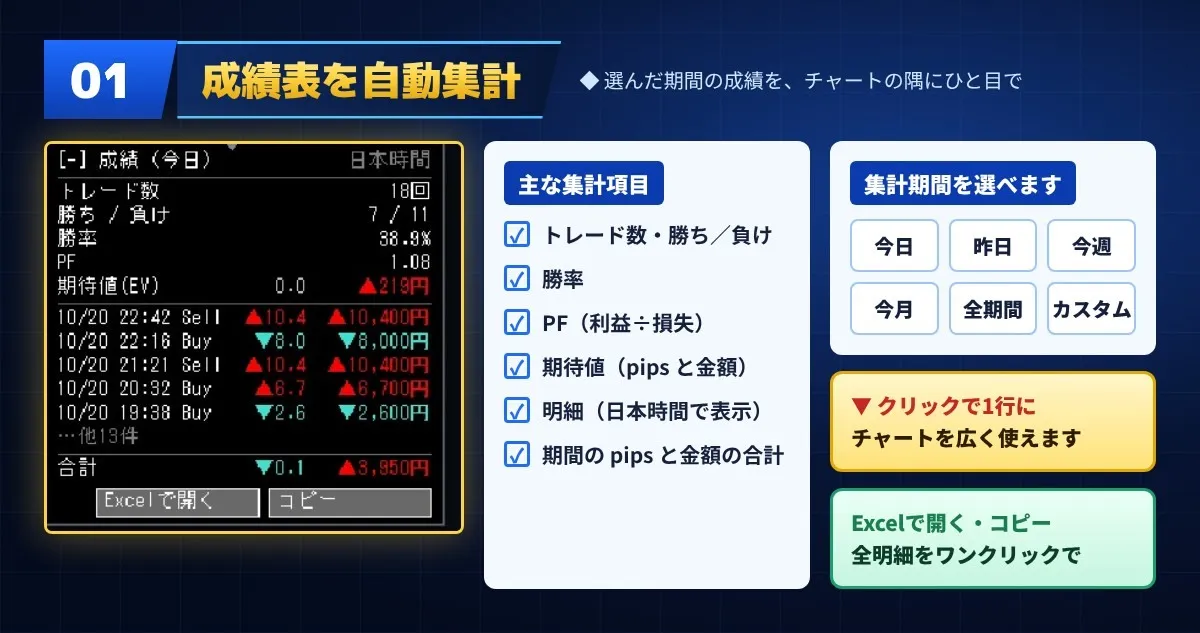
Steps to review on the chart
From here, these are the steps when using the “TradeHistory_Pips_Pro” I made.
- Insert the indicator on the MT4 chart.
- Choose the aggregation period. You can select Today, Yesterday, This Week, This Month, All Time, or Custom.
- In the performance table, check outcomes, win rate, PF, and expectancy.
- On the chart at the closing positions, check the earned pips and profit/loss amount.
- If you want more detailed analysis, open all details in Excel.
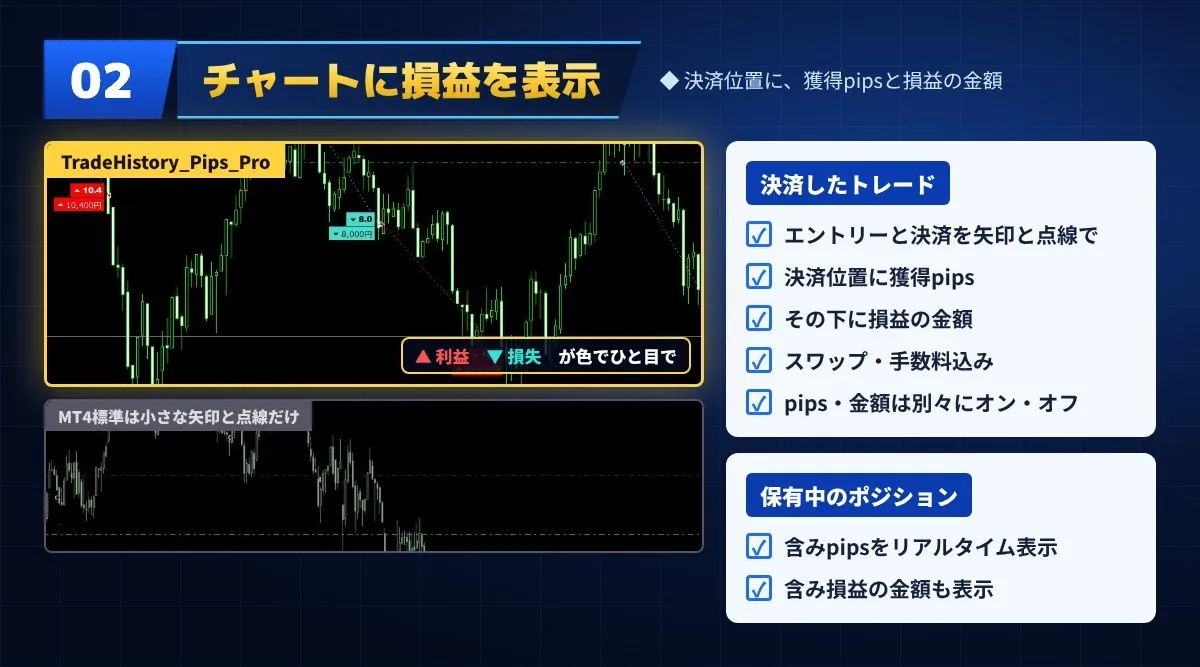
If you are using an EA, you can also filter by EA to view performance.
First, you can verify with a free trial version
All features are available for free for 7 days. Please check the display on your computer and account.
TradeHistory_Pips_Pro (MT4 version) product page
Notes
- This tool displays trade history and performance. It does not indicate the timing of trades, nor does it guarantee profits.
- MT4-only, to be used on Windows PCs.
- The displayed figures are indicative values based on trade history. For exact profit and loss, refer to your broker's trade report.
- Investment decisions and actual trades are your own responsibility.