
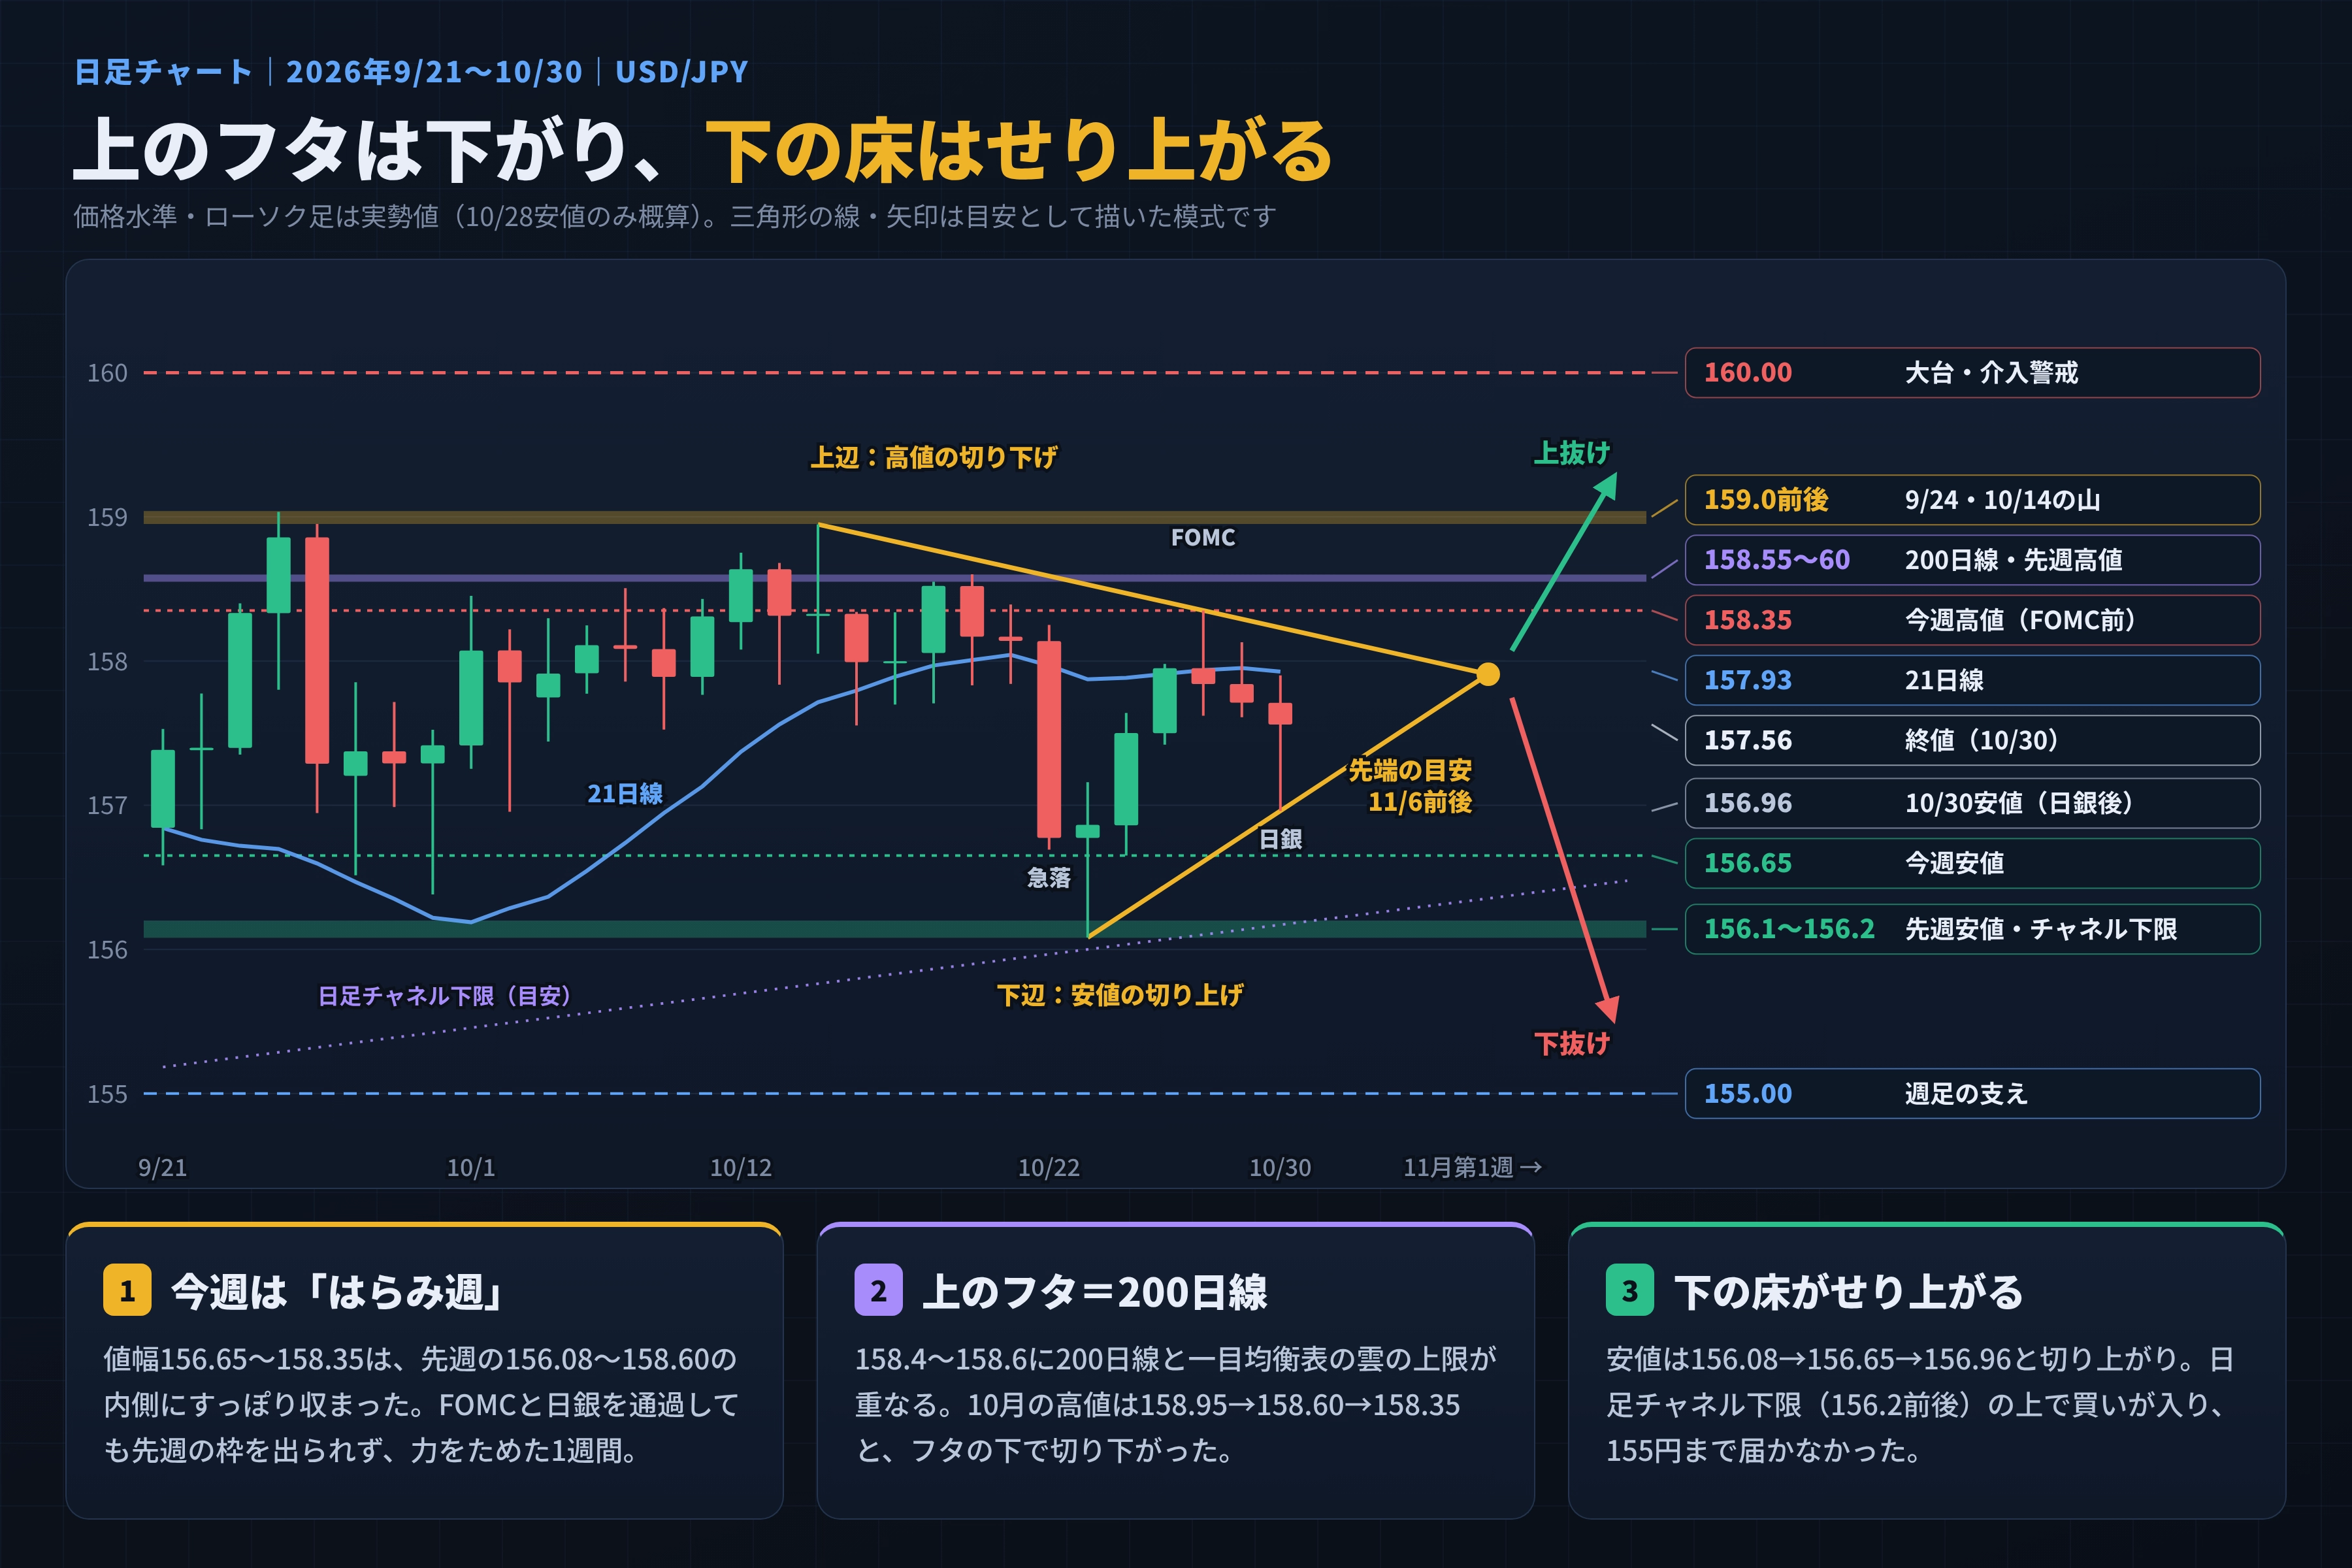
Prices rise and fall: The high prices go down, the low prices go up. Waiting at the tip of the triangle.
Prices rise and fall inversely; wait at the tip of the triangle.
This week (10/26–30) USD/JPY moved between 156.65 and 158.35 yen,
and closed within last week's range (156.08–158.60 yen).
Both the FOMC and the Bank of Japan held rates steady, with the decision carried over to next week.
What happened this week (daily flow)
────────────────────────────────────────
Date Open High Low Close
10/26 156.86 157.64 156.65 157.50
10/27 157.50 157.98 157.42 157.95
10/28 157.95 158.35 157.6s 157.84
10/29 157.84 158.13 157.61 157.71
10/30 157.71 157.90 156.96 157.56
10/26 (Mon) In the morning, Asian stocks were weak and it fell to 156.65 yen,
but rebounded to the mid-157s in the afternoon.
10/27 (Tue) Ahead of the FOMC and BOJ, yen-selling led. Continued rally to 157.95 yen.
10/28 (Wed) Middle East tensions and high oil prices pushed it up to 158.35 yen.
However, it stopped just before the 200-day moving average (158.54 yen).
FOMC kept rates at 3.75–4.00% (10–2; two members favored rate hikes).
Chair Powell did not promise a December rate increase, sending it to the upper-157s.
10/29 (Thu) Rallied to 158.13 yen but gains pared on oil and AI-related stock declines.
10/30 (Fri) BOJ kept rates at 1.25% (8–1; Takata proposed 1.50%).
The underlying price trend was judged to be broadly consistent with the 2% target.
As expectations of a December rate hike emerged, the yen weakened to around 156.96.
Thereafter, oil price rises and comments from FRB officials lifted it back toward the mid-157s.
Three Points
────────────────────────────────────────
1. This week was a “straddling” week
The weekly range 156.65–158.35 is within last week's 156.08–158.60 range.
Even after two major events, it remained within a contained range, accumulating energy for a move.
2. The lid is the 200-day line
The 200-day line and the upper edge of the Ichimoku cloud sit around 158.4–158.6 yen.
October highs fell from 158.95 → 158.60 → 158.35 yen, staying under the lid.
3. The floor is rising
Lows rose 156.08 → 156.65 → 156.96 yen.
Buying occurred above the daily channel lower bound (around 156.2 yen), preventing a drop to 155 yen.
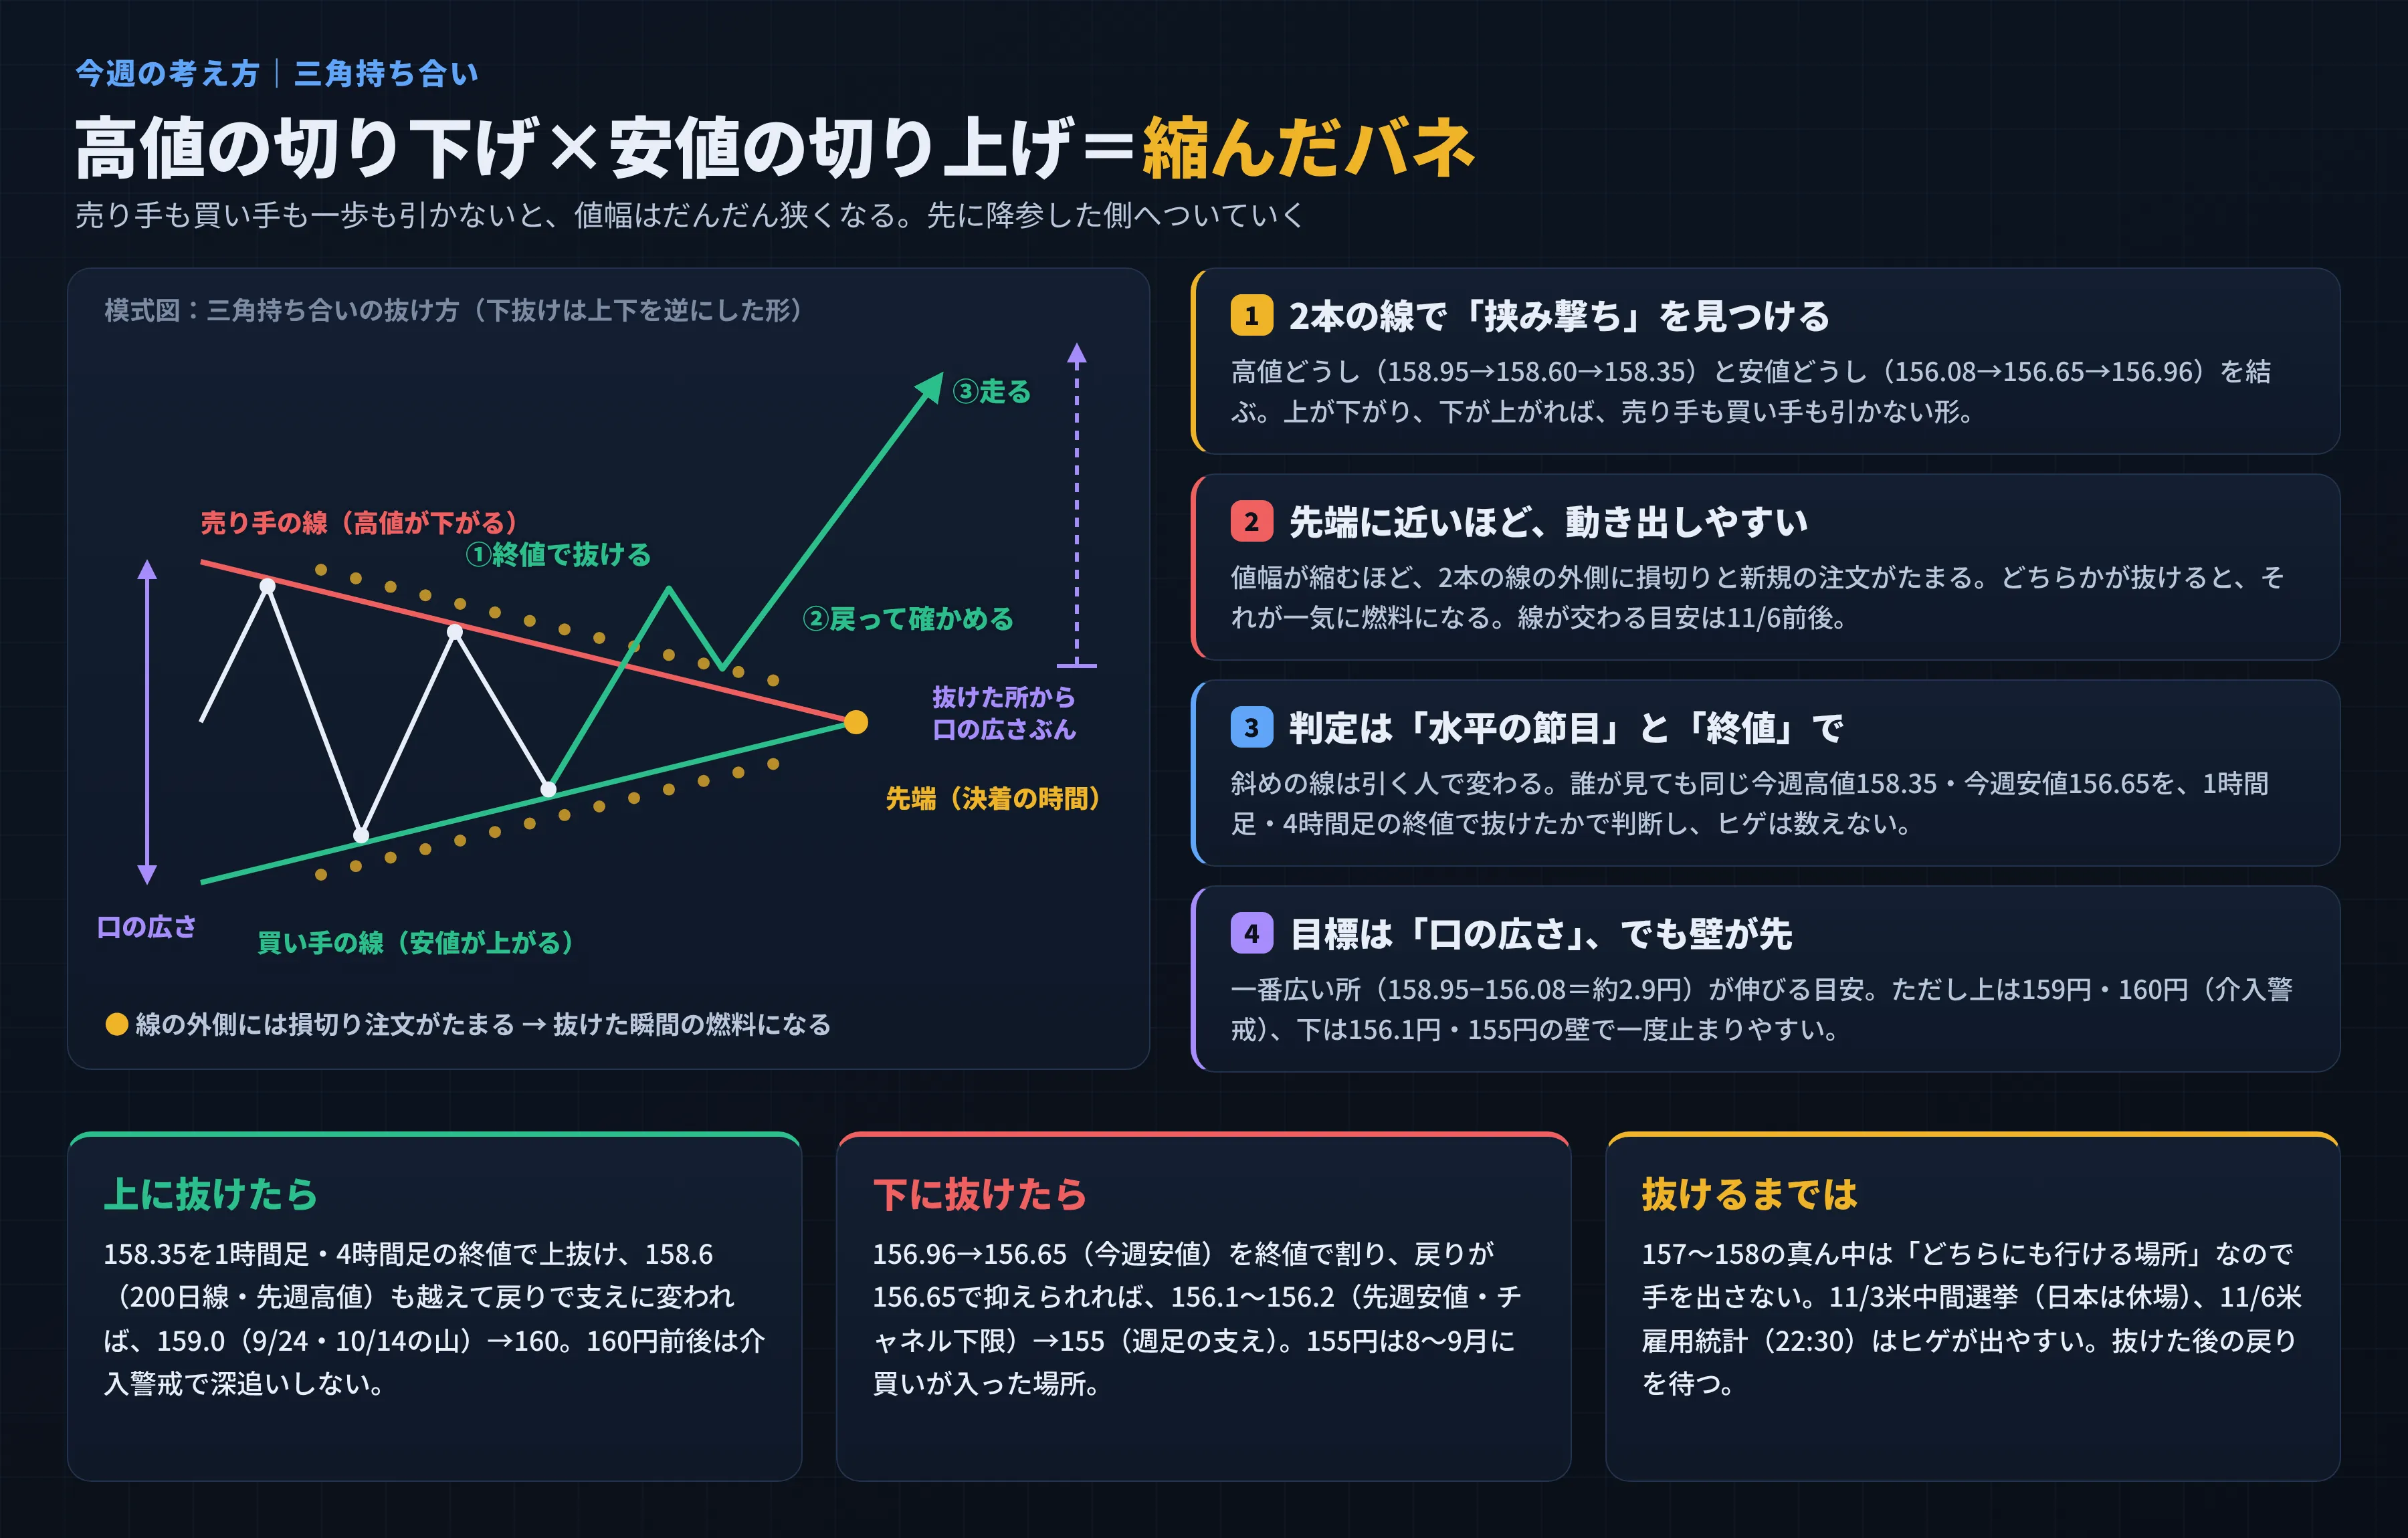
Next Week’s View: Symmetrical Triangle
────────────────────────────────────────
When highs decline and lows rise, the range tightens.
Both sellers and buyers hold firm in a “pinch” formation.
158.95
\ 158.60
\____ 158.35
\____
> Tip (around 11/6)
____/
___/ 156.96
/ 156.65
156.08
1. Find the “pinch” with two lines
Connect the highs with highs and the lows with lows. If it goes up then down then up, it’s a symmetrical triangle.
2. The closer to the tip, the easier the move
As range narrows, orders to cut losses and new positions accumulate outside the lines.
If either side breaks, that breakout can fuel a strong move.
3. Judgment on “horizontal level” and “close price”
Slope lines depend on the observer. The week’s highs of 158.35 yen and lows of 156.65 yen will be judged by the close of the hourly and 4-hour charts.
Do not count wicks (brief intraday breaches) during events.
4. The target is the mouth width, but a wall comes first
The widest part of the triangle (158.95−156.08 ≈ 2.9 yen) indicates the potential extent.
However, resistance at around 159–160 yen and support near 156.1–155 yen may cap the move.
Next Week’s Scenario
────────────────────────────────────────
If it breaks higher
Close above 158.35 yen on the hourly and 4-hour charts
→ also clear 158.6 yen (200-day line and last week’s high); if supported on pullback
→ 159.0 yen (peak on 9/24 and 10/14) → 160 yen
Around 160 yen, intervention by authorities is more likely; avoid chasing
If it breaks lower
End the move by closing below 156.96 yen and 156.65 yen (this week’s low); if supported at 156.65
→ 156.1–156.2 yen (week’s low and daily chart lower bound)
→ 155 yen (weekly support; area where buying occurred in Aug–Sep)
Until a break occurs
The middle between 157 and 158 yen is a zone where either direction is possible. Do not take positions; wait for a breakout and pullback.
Next Week’s Schedule (Japan Time)
────────────────────────────────────────
Note: The US shifts to daylight saving time from 11/1. U.S. releases will be one hour later than in summer.
11/2 (Mon) 24:00 US October ISM Manufacturing PMI
11/3 (Tue) US midterm elections (Japan is closed for Health and Sports Day)
11/4 (Wed) 22:15 US October ADP employment
24:00 US October ISM Non-Manufacturing PMI
11/5 (Thu) 08:50 BoJ Minutes of September Meeting
11/6 (Fri) Speech by BoJ Governor Ueda (IMF-related meetings)
22:30 US October Employment
(Expected: Nonfarm payrolls +55k, unemployment rate 4.2%, average hourly earnings +2.9% YoY)
Price Level List (as of 10/30)
────────────────────────────────────────
160.00 Major level; intervention alert
159.0 around 9/24 (159.04) and 10/14 (158.95) peaks
158.55–158.60 200-day line and last week high
158.35 This week’s high (before FOMC) = upper triangle line
157.93 21-day line
157.86 25-day line
157.56 Close (10/30)
156.96 10/30 low (after BoJ)
156.65 This week low = lower triangle line
156.1–156.2 Last week's low and daily channel lower bound
155.00 Weekly support
152.89 September low
Notes
────────────────────────────────────────
This material is an analysis to learn about market perspectives and does not constitute a trading recommendation.
Please make investment decisions at your own risk.
Chart price levels are actual market data. The triangle lines and arrows are schematic guidelines.