
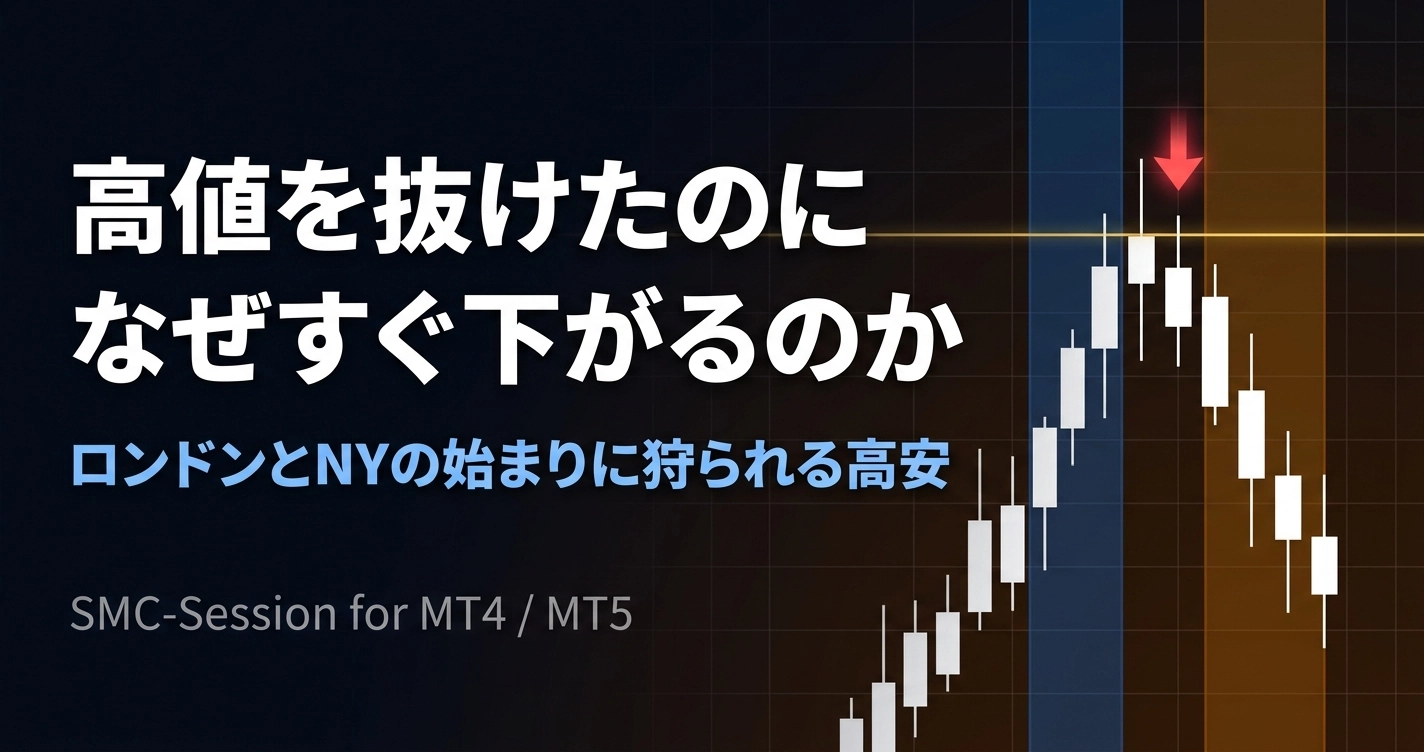
Why does it fall right after breaking the high, as highs and lows are hunted at the start of London and New York, and how to confirm a reversal【SMC-Session】
lab.aiueo, developing MT4/MT5 indicators.
This article explains why the movement that reverses immediately after breaking a high occurs,and why it happens, andwhat is troublesome when chasing it manually. Finally, I will introduceSMC-Session(included with MT4/MT5). It also shows examples where signals were false.
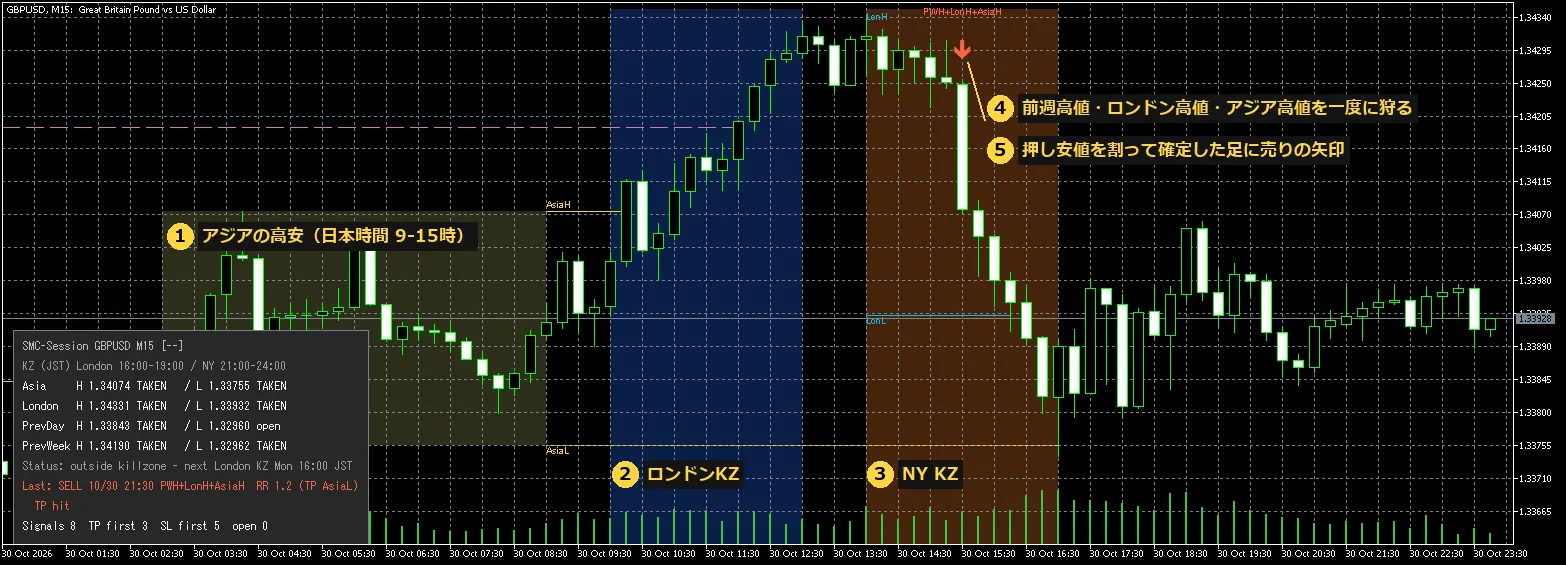
GBPUSD M15 ・ October 30. After breaking the previous week’s high and London/NY high in the kill zone, a sell arrow appeared on the candle that broke the low of the pullback
I bought because it broke through, then it came back
In the evening in Japan time, London began to move. The previous day’s high clearly broke upward. I bought expecting it to rise from here.
However, the price stopped a little above the high. It left a long upper shadow, then retraced below the previous high. Right after the stop loss was triggered, it moved downward instead.
The breakout itself wasn’t wrong.However, that breakout was not the start of a big move, but a single thrust before moving in the opposite direction.

There are orders queued beyond the breakout
It is said that immediately outside obvious highs and lows, stop orders and pending orders tend to accumulate. For those who sold at the previous day’s high, or those who intend to buy after breaking the high, their stop orders become market orders as soon as the price breaks the high.
From the side that wants to place large sells, this is a place where buying can accumulate. Therefore, it is explained that when the price slightly breaks the high, buy orders are absorbed and the price tends to move downward afterward, called “stop hunting” or “liquidity sweep.” Whether someone is intentionally hunting cannot be confirmed from the outside.
What is most likely to be hunted are clearly visible highs and lows. SMC-Session uses the following four types.
| Symbol | Content | Effective period | Target kill zone |
|---|---|---|---|
| AsiaH / AsiaL | Asia session highs and lows (Japan time 9–15) | After Asia session to the end of that day | London・NY |
| LonH / LonL | Highs and lows from the start of London KZ to the start of NY KZ | NY KZ start to end of that day | NY |
| PDH / PDL | Previous day high/low | That day | London・NY |
| PWH / PWL | Previous week high/low | That week | London・NY |
There is also a time bias. The few hours at the start of London and NY are called the “kill zone,” and it is common for the highs and lows of the previous day or Asia time to be broken here. SMC-Session’s default is7:00–10:00 local time in London and NY, a 3-hour window.
Hunting vs. true breakout
At the moment of break above a high, you can’t tell if it is hunting or a true breakout. The clue is theclosethat follows.
- If it’s hunting, after the breakout the price returns inside with a close, then breaks lower below the recent pullback low
- If it’s a true breakout, it closes outside and continues to make new highs
A change in direction after breaking the pullback low is called CHoCH (Change of Character) in SMC. SMC-Session does not draw arrows until this CHoCH is confirmed.
Chasing by hand is tiring for time calculations
The concept is simple, but doing it daily by hand is hard. The most tedious part is the timing. Asia is Japan time, the kill zone of London is London time, and NY’s is New York time, and the U.K. and the U.S. switch to daylight saving time on different days.
| Period | London KZ (Japan time) | NY KZ (Japan time) | Interval |
|---|---|---|---|
| Winter (early Nov–mid-Mar) | 16:00–19:00 | 21:00–24:00 | 5 hours |
| Summer (late Mar–late Oct) | 15:00–18:00 | 20:00–23:00 | 5 hours |
| Period of switch offset(about 3 weeks in March and about 1 week late Oct–early Nov) | 16:00–19:00 | 20:00–23:00 | 4 hours |
In 2026, the UK returned to winter time on Oct 25 and the US on Nov 1. During that week, the London time started at 16:00 (winter time) while New York still used 20:00 (summer time). The image at the top shows Oct 30, exactly that week, with the gap between blue and brown bands shorter by 1 hour than usual.
Additionally, two more burdens of manual operation are
- Since trading hours are determined by the broker’s server time, “the previous day” shifts by broker. SMC-Session fixes the day boundary at 17:00 NY time and automatically detects the broker’s GMT offset
- Each of the eight highs/lows must be remembered whether they were broken inside or outside the kill zone. Highs/lows broken outside the kill zone are not targeted anymore
SMC-Session judgment proceeds in 4 steps
Written for the selling case (swap the directions for buying).
| Step | What to do |
|---|---|
| 1. Draw highs and lows | Draw lines for the four highs/lows, track whether they are still open or TAKEN |
| 2. Wait for hunting | In the kill zone, if a high that is still active breaks up, enter “waiting” to sell. If another high breaks as well, combine into one |
| 3. Confirm with CHoCH | Break the most recent pullback low with a close, place a sell arrow below the broken level. If it closes far outside the level (2x ATR), treat as a break and cancel, time out in 180 minutes |
| 4. Decide TP/SL | SL slightly outside the tip of the hunted wick. TP is the nearest among the lows that have not yet been hunted on the opposite side with RR of 1.0 or more (if none, RR 2.0) |
For one kill zone and one direction, there is up to one signal. Signals appear on M1–M30 (roughly M5–M15). The selling signal in the opening image has already reached the Asia low as TP.
How to read the screen and panels
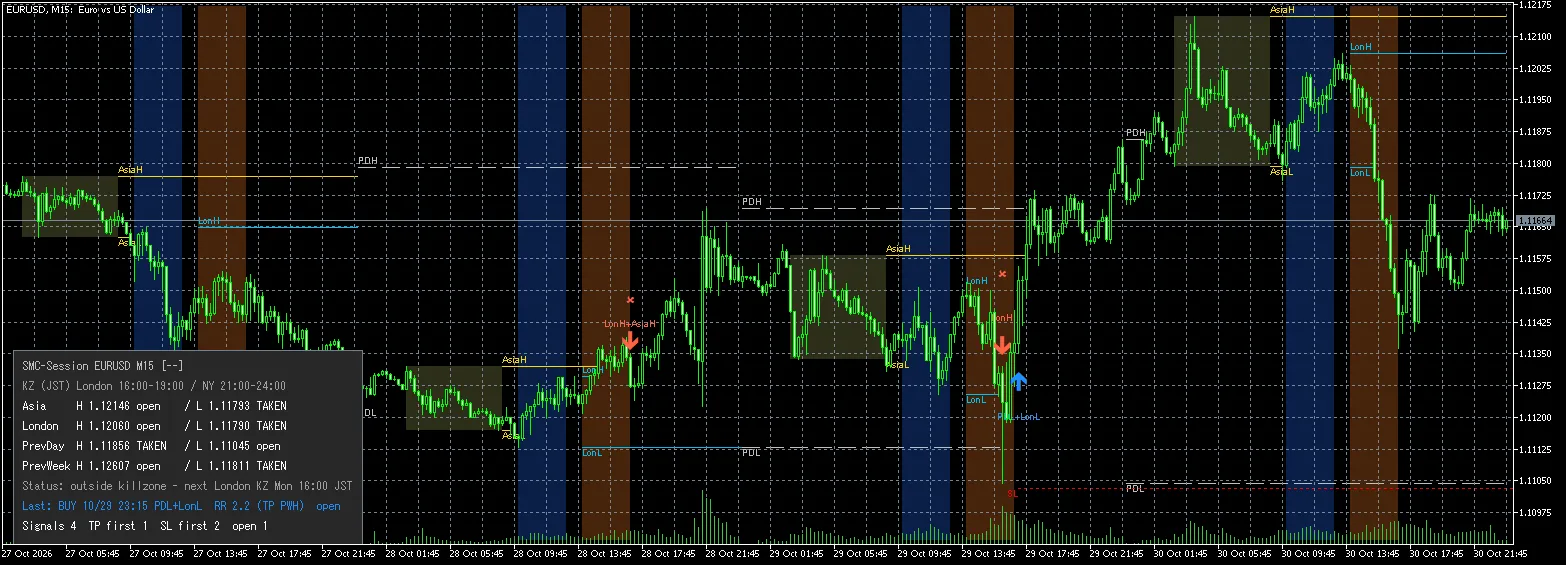
EURUSD M15. The blue band is London, the brown band is NY kill zone. There is a TP and SL line for the current signal
Above the chart, you will see kill zone bands, Asia time frame, four highs/lows lines, arrows, and the TP/SL lines of the latest signal. If a line ends midway, that means it has been broken.
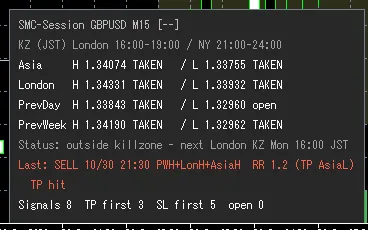
Panel. The four highs/lows prices and status, today’s kill zone in Japan time, and the latest signal
The bottom-left panel is shown in English to avoid garbled text. The status lines are generally open (not hunted yet), TAKEN (hunted), forming (time zone not yet finished). The Status row is the most used.
| Status | State |
|---|---|
| outside killzone - next NY KZ 21:00 JST | Outside the kill zone. Start time of the next kill zone (Japan time) |
| London KZ - watching 4 levels | Inside the kill zone. There are four highs/lows that can be targeted |
| SELL setup - AsiaH taken, CHoCH below 1.33890 (150 min left) | Asia high hunted, waiting for sell reversal. If the close goes below 1.33890, a sell signal is confirmed. If not completed within 150 minutes, cancel (panel wraps into 2 lines) |
| London KZ - SELL limit reached | This kill zone sell signal reached its upper limit (one bar) |
| London KZ - no levels left | All usable highs/lows have been hunted |
Signals do miss
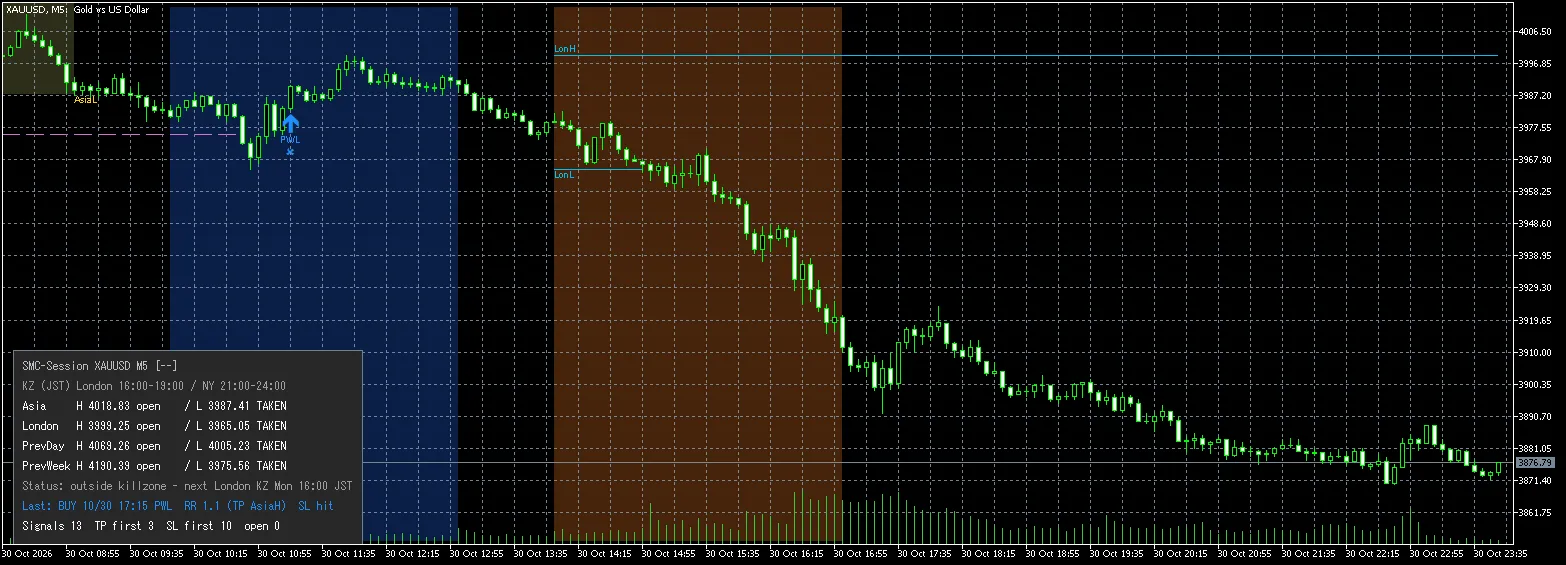
XAUUSD M5. A buy signal after hunting the previous week’s low did not continue the reversal and hit SL first
In the gold 5-minute chart, a buy signal appeared after the previous week’s low (PWL) was hunted. The reversal did not continue, and it hit the SL first. A cross mark remains on the chart.
SMC-Session, as soon as a chart is loaded, reproduces the most recent 20 days of signals and marks with a check (✓) for where the TP or SL was hit first. The panel shows onlythe count, not the win rate. The opening image’s panel shows the first 3 TP hits and the first 5 SL hits; it will continue to show the same if SL hits are more frequent during that period. Since there are only 8 items in that period, the numbers cannot be used to compare magnitude.
Past arrows also rely only on information up to that bar
From the oldest bars on the chart, one by one,only information visible at the time of that bar’s confirmationis used to judge. The pullback lows and returning highs are confirmed only when the two right-side bars are in place, and the past bar’s time frame is judged by that day’s daylight saving time (UK and US respectively).
In development, we created automatic tests for both MT4 and MT5 to verify that signals calculated by cutting bars mid-way match those calculated across all bars, that shifting the starting point yields the same results, and that values align with a different method (Python time-zone calculations).
With your signal tool, you can also screenshot once a day, switch the timeframe, and after returning, check whether arrows have increased in the range you captured.If arrows increase after you pull back, it’s likely a late signalto confirm it.
What this product does not do
It does not place orders.It is not an EA but an indicator displayed on the chart. You must make trading decisions and place orders yourself.
It does not display or promote win-rate numbers.Instead of numbers that could be skewed by testing errors, it provides records you can verify on your own chart (count of signals). The panel in the opening image also shows TP-first 3 and SL-first 5; it will show the same even if SL-first is more frequent during that period. Since there are only 8 items in that period, it is not meaningful to compare highs and lows.
Flow of use
- Check highs and lows in the morning: See which of the previous day/week highs/lows is still open. After 15:00 Japan time, Asia highs/lows join the list
- Wait for a kill zone: Outside the kill zone, the Status shows the next start time (Japan time)
- Watch the hunting: Status changes to SELL setup / BUY setup, and the price level for reversal and remaining time appear (Alert_OnSweep can notify)
- Look at the signal: Check whether TP/SL positions align with your targets before considering a trade
- Review: See how the signal finished for that symbol/timeframe using the check marks and counts
When a signal appears, you’ll be notified by popup, smartphone push notification, or sound. The message is in alphanumeric characters only to avoid garbled text.
Can be used on the same chart as SMC-Signal
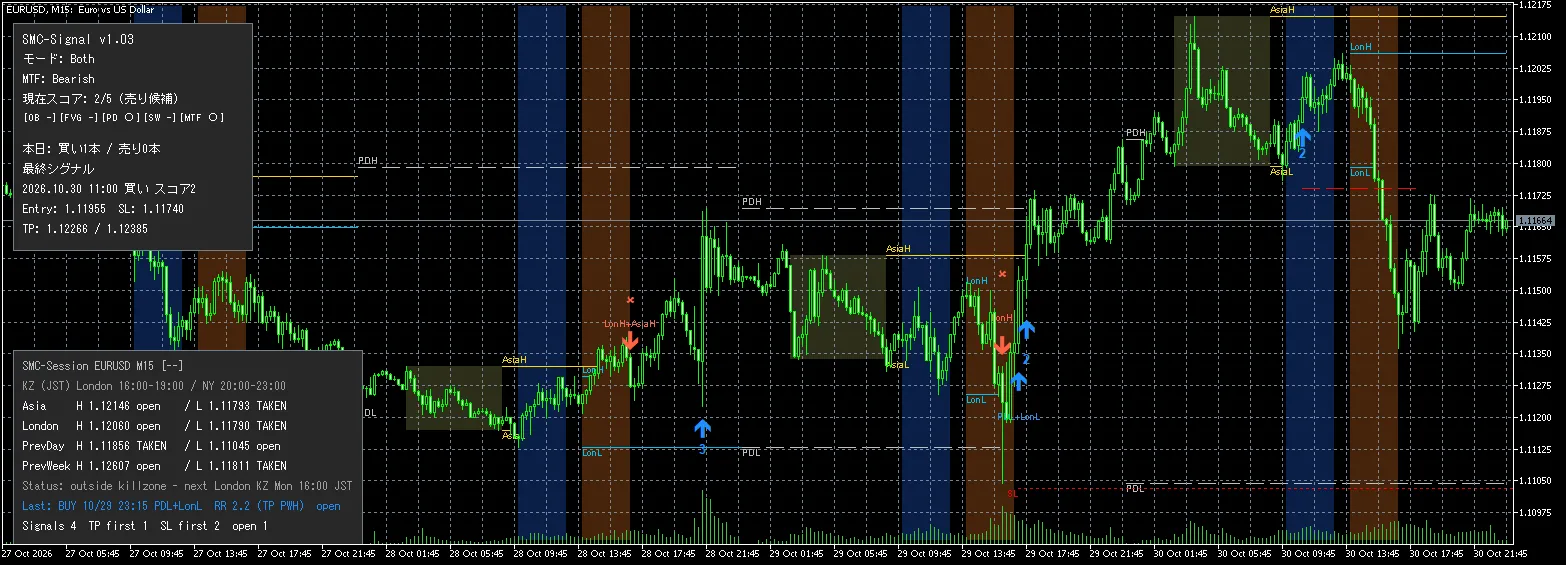
EURUSD M15 example withSMC-Signal (panel at the top left) and SMC-Session (panel at the bottom left)
SMC-Signal is used for entries on pullbacks to order blocks or FVG, while SMC-Session is used for reversals from liquidity hunting in time zones. They do not conflict because their entry methods are different. The panels are placed so that SMC-Signal (top left) and SMC-Session (bottom left) do not overlap; lines and symbols are drawn behind the candles. If used with CP-Signal, you should disable one of the bands (for SMC-Session, set ShowKillzones to false).
It also runs on the BT-Replay verification chart for past markets (MT5) and does not trigger alerts while replaying.
Operating environment
| Platform | MetaTrader 4 / MetaTrader 5 (Windows). Both files included |
| Instruments | FX currency pairs, gold, stock indices, etc. (calculations based only on the displayed chart’s bars) |
| Timeframes | Signals from M1–M30 (roughly M5–M15). H1+ only show highs/lows/bands/panel |
| Repaint | No repaint (only confirmed bars used) |
| Parameters | 55 items (Japanese explanations) |
| Alerts | Popup / Push notification / Sound |
| DLL / External indicators | Not used / not required |
MT4 and MT5 versions share the same judgment, display, and parameters. However, even for the same broker, MT4 and MT5 might receive price from different servers, so the arrow positions may not match.
Why it was made
SMC-Signal is a tool for entering on pullbacks to order blocks or FVG. Another common SMC entry,a reversal after a high/low has been hunted was not covered by my product. Since OANDA’s MT4 in the domestic market ends in November 2026, I included both MT4 and MT5 in one product from the start so it remains usable after migration.
The default values were set without considering win/loss. Initially, the wait time was 90 minutes and the cancellation was 1x ATR, but with actual data (EURUSD, GBPUSD, USDJPY for three weeks), most waits canceled or ended by time-out, and few signals appeared. Since hunts extend clearly outside the level and then return, I set the wait time to 180 minutes (same as kill zones) and broadened cancellations to 2x ATR. The focus wasonly on counts and the width of the SL, not on which side hit TP or SL first.
Second, during image production for listing, I noticed the panel’s “TP hit” had become “TP hi.” The chart text is limited to 63 characters per line; the rest is cut off without notice. I had passed the wording tests, so I did not notice until viewing the screen.Even if tests pass, always check the screen.This was the strongest realization I had.
This product is a supplementary tool for analyzing the market based on time zones and highs/lows. It does not provide investment advice or guarantee performance.
The displayed signals, TP/SL, and the count of results are mechanistically calculated from current and past prices and do not predict future price movements. Result judgments do not include spreads or order slippage. The developer is not responsible for any damages arising from trades made using this product. Please make investment decisions at your own risk.