
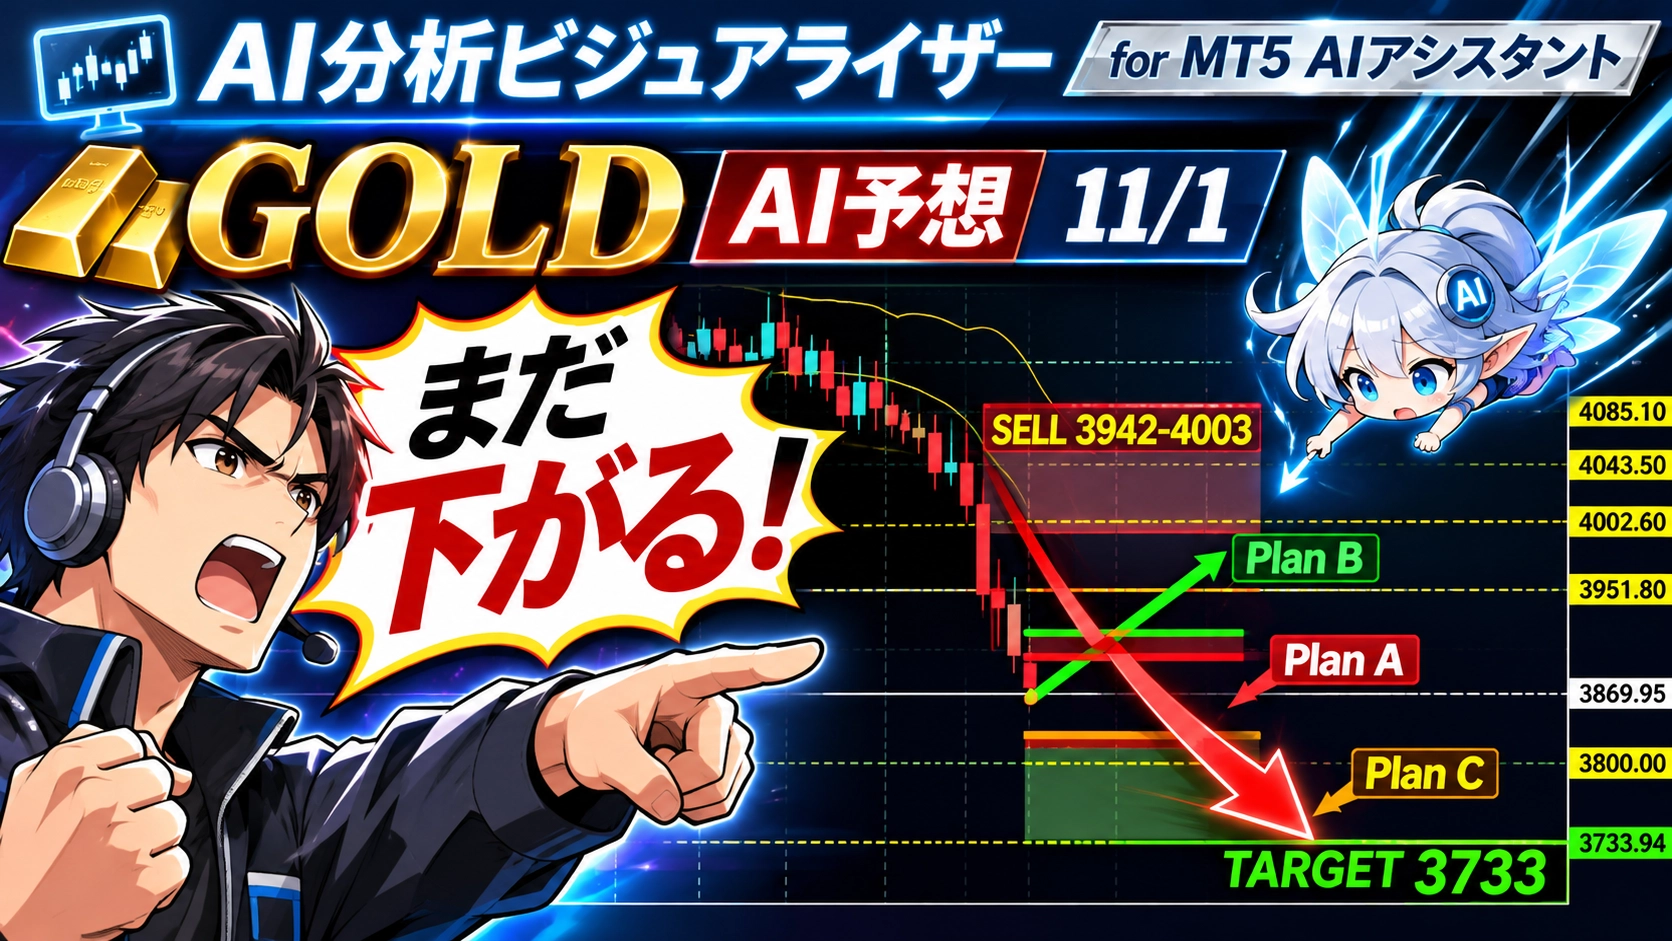
[GOLD AI Prediction] October Range Break to the Downtrend? Scenario of Sell on Rallies at $3952 and Drop to $3733 — November 1
?This article was posted on 2026-11-01=>Latest related articles?
※This article introduces results visualized by MT5 AI Assistant's market analysis throughAI Analysis Visualizer. AI analysis is based on chart data at specific times and does not guarantee future prices or profits.

1. Last week's gold market: October range broken to the downside
Gold fell sharply last week.
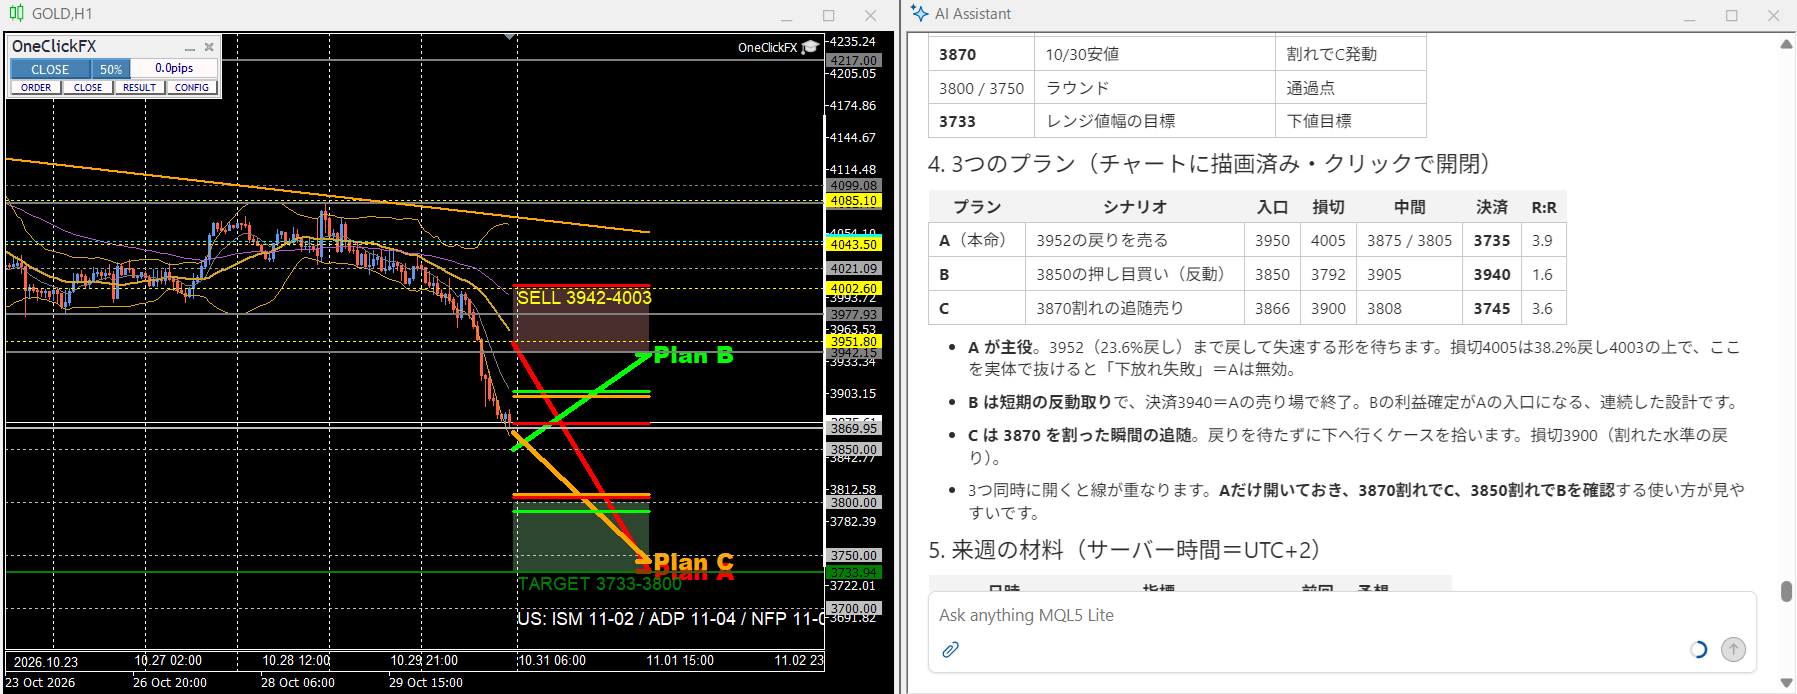
The week opened at 3997.06 and closed at 3875.61, a weekly decline of about 3.0%. Notably on October 30, it dropped from 4023.43 to 3875.61, a drop of 147.8 dollars, about 3.7%.
- October 30 decline: 147.8 dollars
- From the August high of 4696.53: down 17.5%
- From the March high of 5419.09: down 28.5%
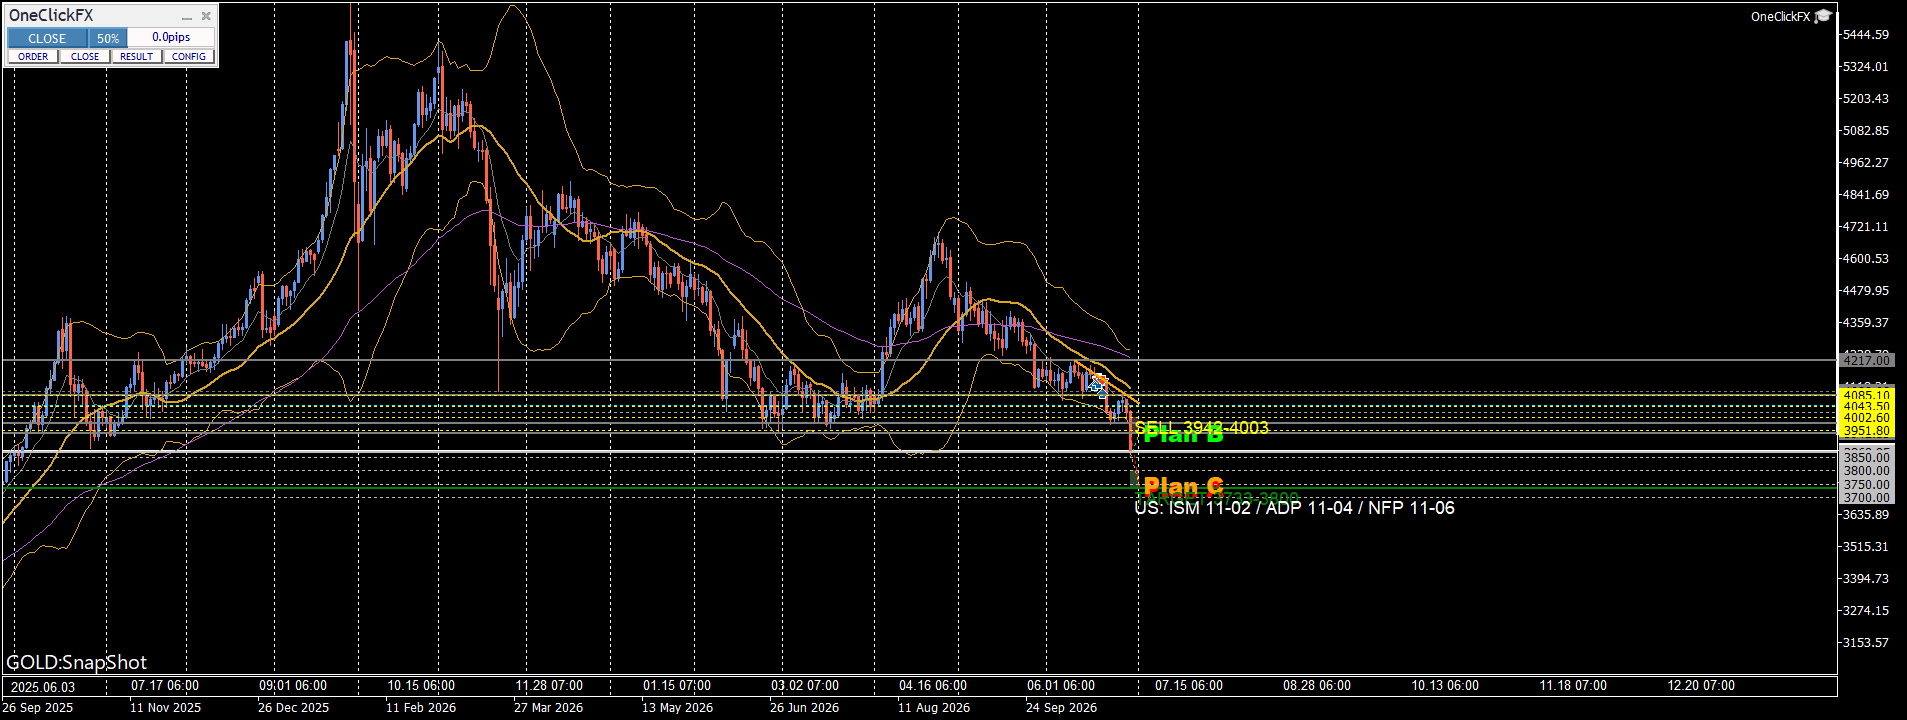
The key point this time is that it broke down from the previously ongoing October range.
The weekly low of 3942.15 on June 28 formed the lower bound of the range from June to October. However, with this drop, that level was broken on a closing basis, and the October range lower bound of 3975.47 also broke.
AI analysis considers this not just a pullback, but a downtrend entry due to a range breakdown.
2. Notable technical points
The important levels in this analysis are around 3942 and 3952 dollars.
| Level | Meaning | Handling |
|---|---|---|
| 4085 | 61.8% retracement; Oct 28 high | Bullish breakout changes view |
| 4044 | 50% retracement; MA10 4047 | Strong resistance |
| 4003 | 38.2% retracement; round 4000 | Stop-loss guideline |
| 3978 | 10/26 low; 10/23 low 3975.47 | Resistance |
| 3952 | 23.6% retracement; old 3942 | Sell zone (A) |
| 3942 | June low = broken lower bound | Decision point |
| 3870 | 10/30 low | Break triggers C |
| 3800 / 3750 | Round | Milestone |
| 3733 | Target of range width | Lower target |
- 6/28 week low3942.15(Lower bound of the June-October range) closed below, and the October range 4217.00−3975.47 also broke down. The decline target width was3733.
- Closing price 3875.61 is outside the D1 Bollinger Lower band (25,2) of 3944.Outside. MA10 4047 / MA20 4099 are well below, implying limited upside in a rebound.
- However, since the close outside the band may be overextended, a move back to the 3920–3950 range at the start of the week is quite possible. That is a zone to watch for selling opportunities.This would be a selling area at that time.
3. AI's three trade scenarios
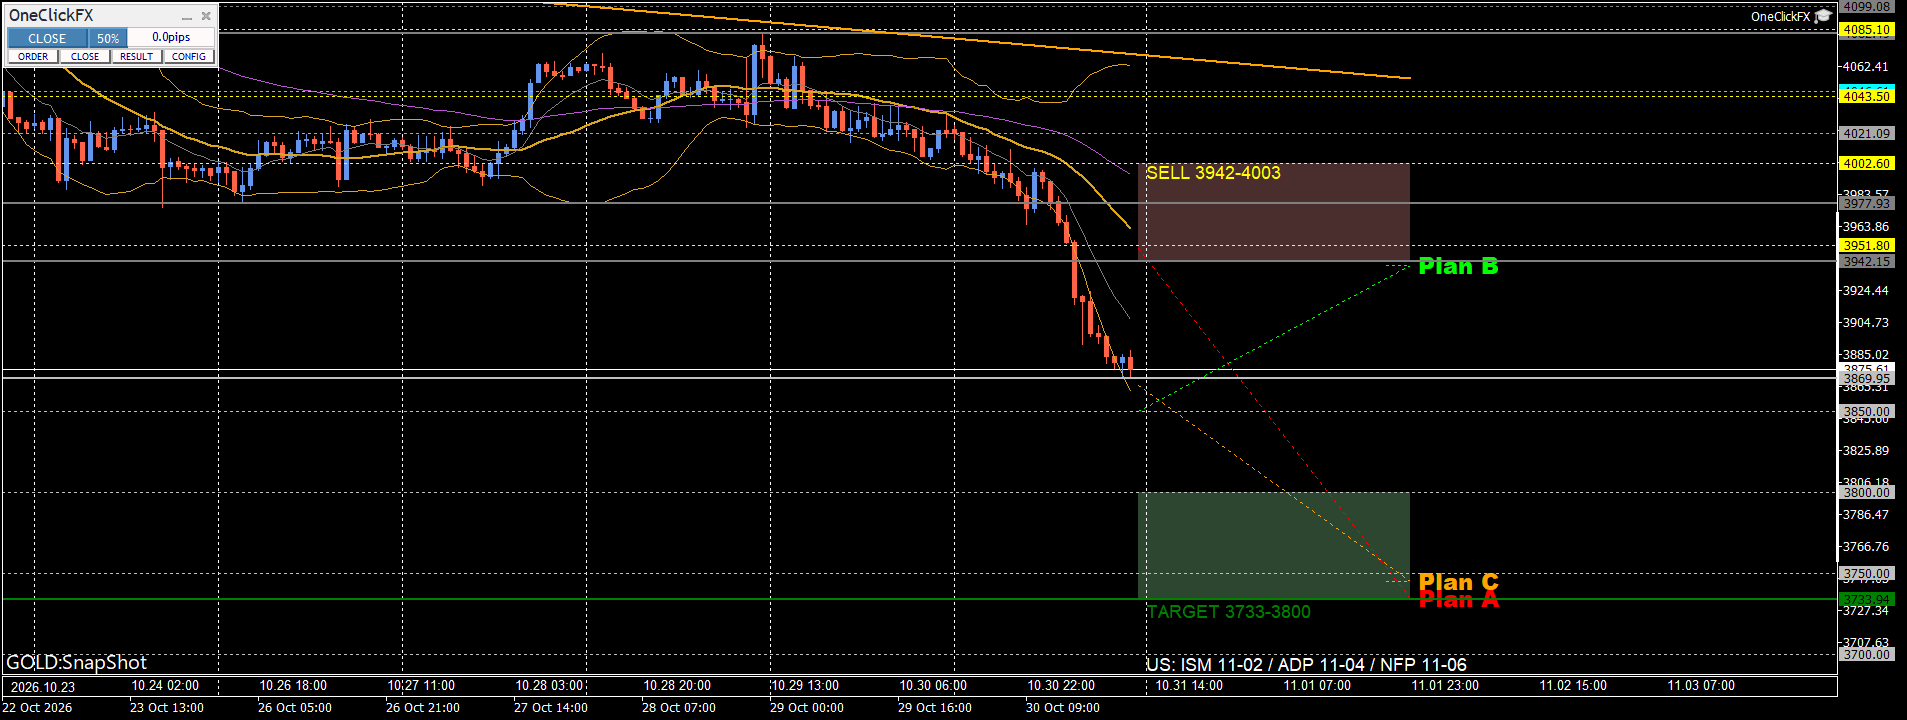
This analysis sets three trade plans: one buy and two sells, totaling three.
The main scenario is a short (sell) near 3952 dollars, waiting for a pullback.
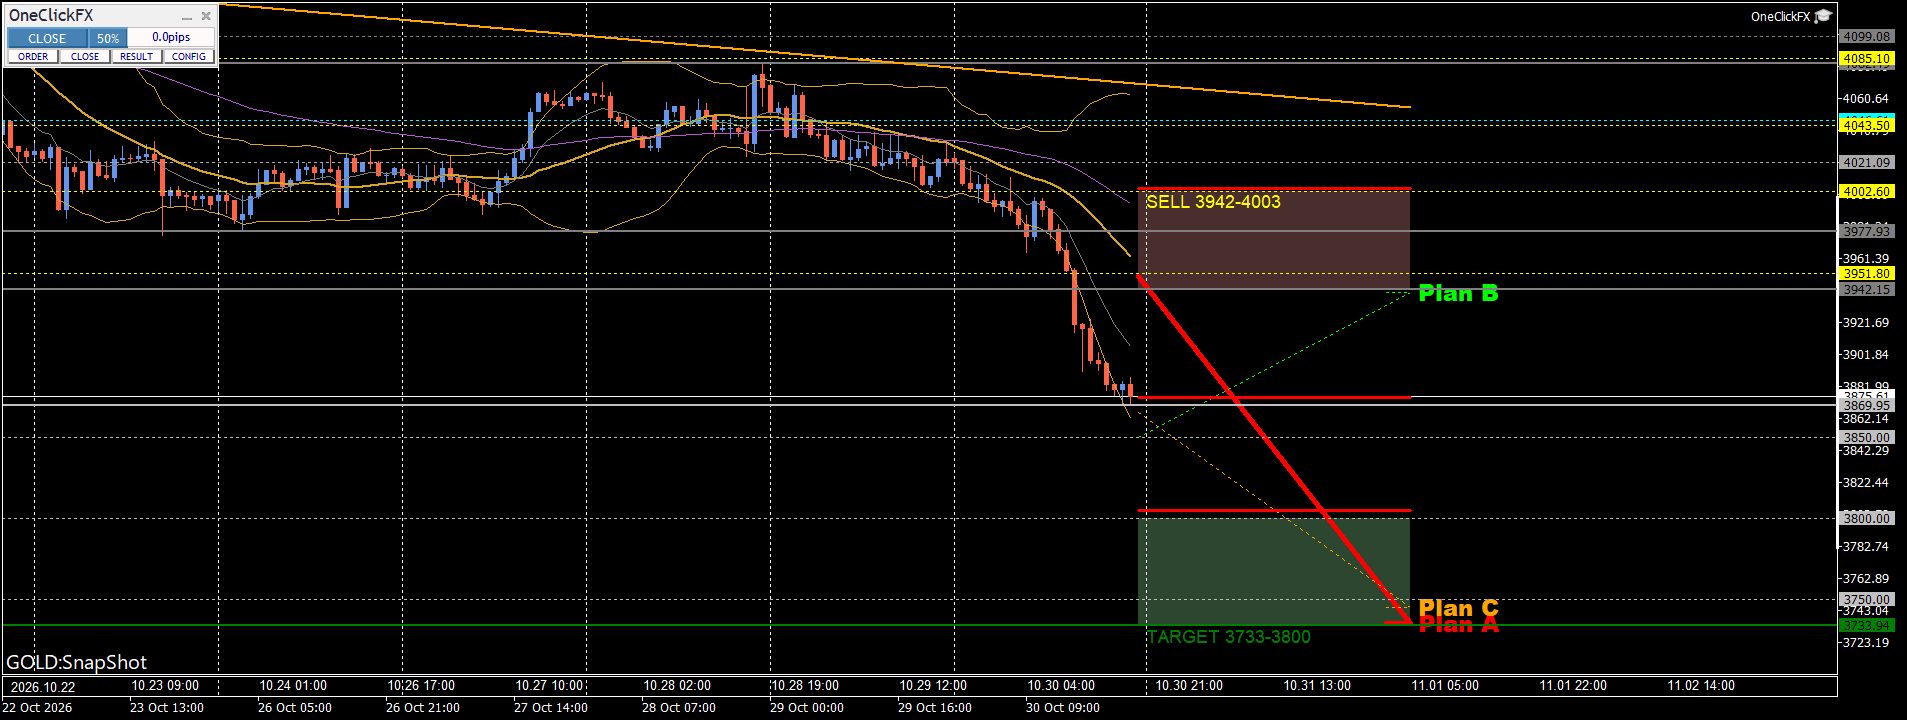
? Plan A: Sell on pullback near 3952 dollars (main)
Expected development:
After breaking down the October range, price may briefly rebound to around 3952 dollars.
3952 dollars is near the Fibonacci 23.6% retracement and close to the old range lower bound 3942.
If the price stalls there and resumes lower, this is the moment to push the sell.
- Entry: 3950 dollars
- Stop loss (SL): 4005 dollars
- Intermediate target: 3875 dollars
- Intermediate target: 3805 dollars
- Final settlement: 3735 dollars
- Risk-reward ratio: 3.9
The stop loss is set above 4003 dollars at 4005 dollars, above the 38.2% retracement of 4003.
If price breaks above here, this sell scenario becomes invalid as the range breakdown may be a failure.
Among the three plans, this is the one AI positions as the primary scenario.
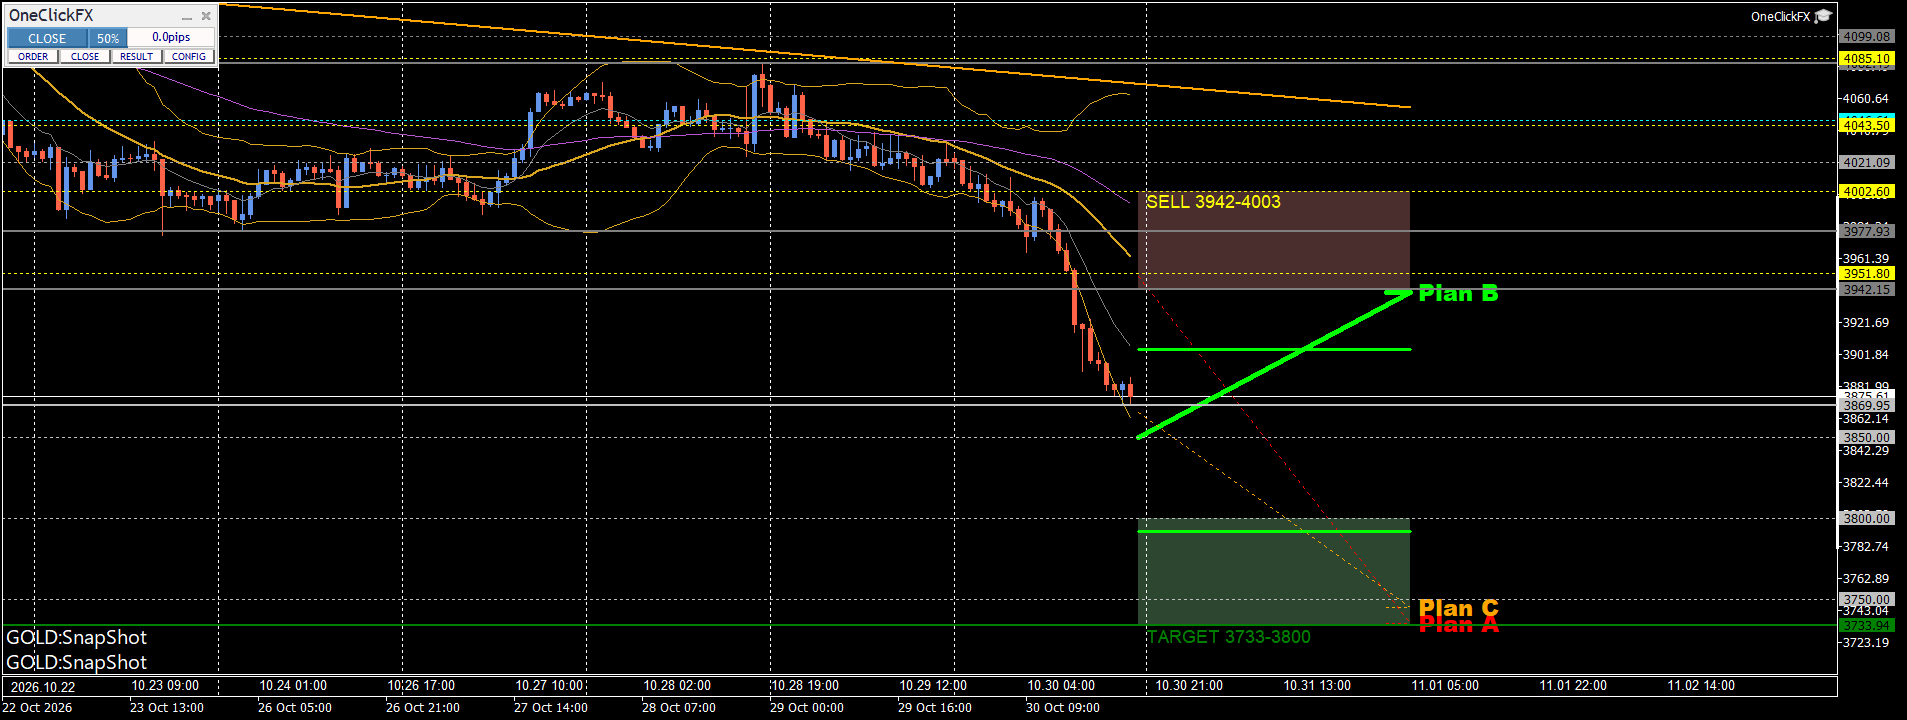
? Plan B: Buy on a pullback near 3850 dollars
Expected development:
A short-term rebound play after a sharp decline.
Not a reversal of the downtrend itself, but a temporary bounce from around 3850 dollars.
- Entry: 3850 dollars
- Stop loss: 3792 dollars
- Intermediate target: 3905 dollars
- Final settlement: 3940 dollars
- Risk-reward ratio: 1.6
Note that the target is set near 3940 dollars.
This is close to the 3952 pullback sell point envisioned in Plan A.
In other words, Plan B aims for a short-term rebound, then price returns to Plan A's selling zone, forming a continued scenario.
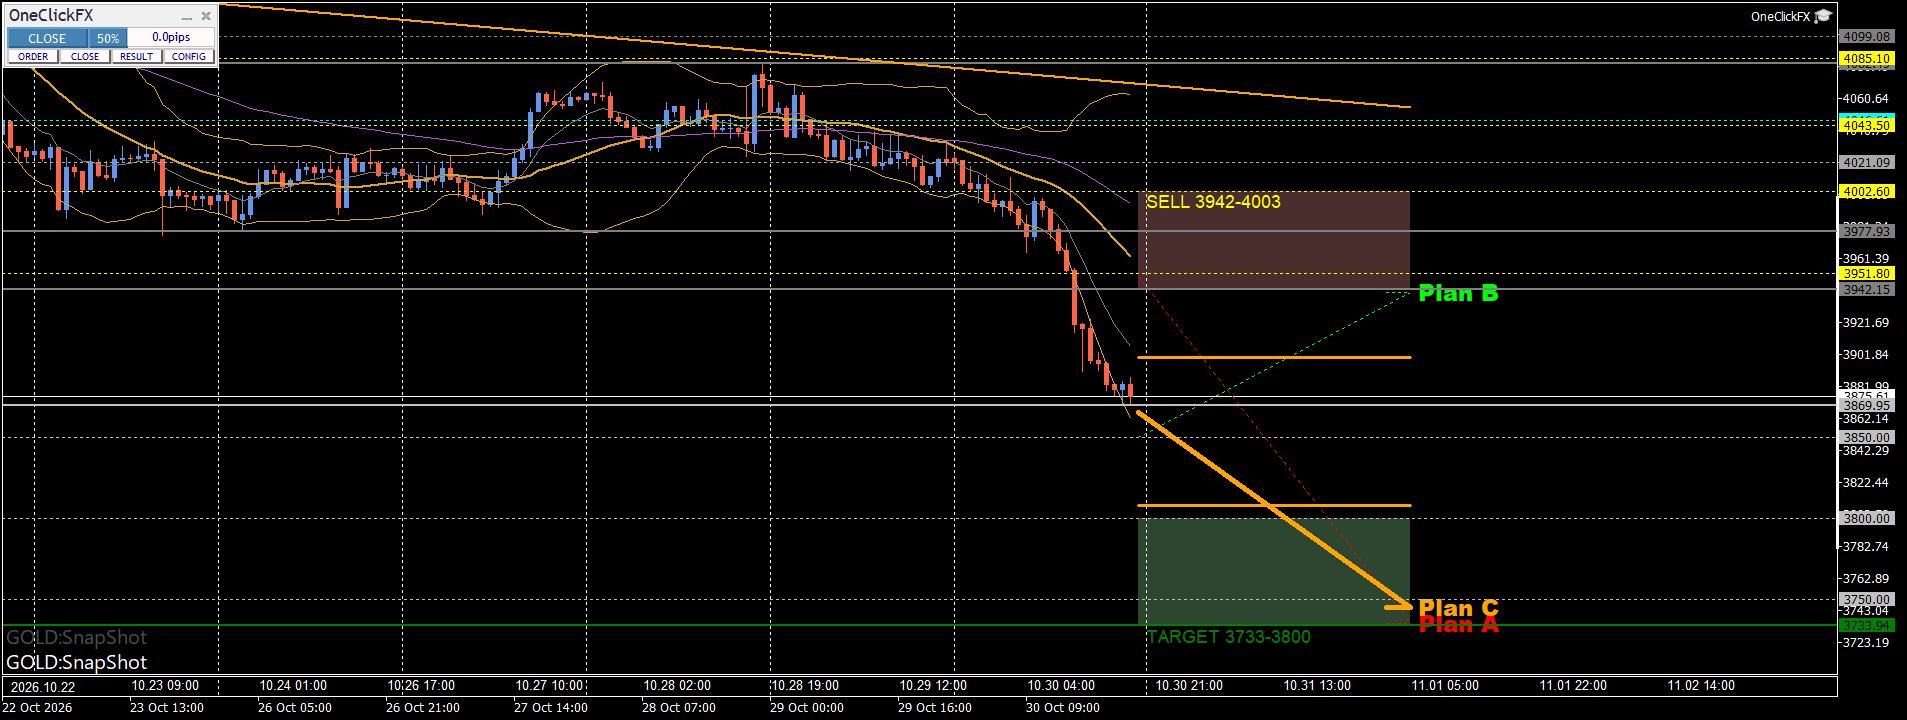
? Plan C: Sell on a break below 3870
Expected development:
From the weekend close, price continues to fall without rebounding, breaking the October 30 low of 3870.
Rather than waiting for a rebound like Plan A, this plans to sell on new lows.
- Entry: 3866 dollars
- Stop loss: 3900 dollars
- Intermediate target: 3808 dollars
- Final settlement: 3745 dollars
- Risk-reward ratio: 3.6
The stop loss is placed at 3900 dollars, considering a potential return to the broken 3870 level.
This plan stands for continuing downside without first returning to 3952.
4. Important economic indicators for next week
Next week, multiple US economic indicators are scheduled.
In particular, the November 6 Non-Farm Payrolls (NFP) release is a key event that will affect gold prices.
Below are the indicators referenced in the analysis.
Note: Times are converted from server time (UTC+2) to Japan Standard Time (JST).
- Nov 3 (Tue) 00:00:ISM Manufacturing PMI
- Nov 4 (Wed) 00:00:JOLTS Job Openings
- Nov 4 (Wed) 22:15:ADP Employment Report
- Nov 5 (Thu) 00:00:ISM Services PMI
- Nov 6 (Fri) 22:30:US Jobs Report (NFP)
AI analysis indicates that employment metrics are expected to be weak, but gold prices are still influenced by a strong dollar and real yields.
Therefore, even weak economic indicators may not necessarily lead to gold price gains.
In particular, the 30–60 minutes following the NFP release can be highly volatile, so the analysis assumes not changing Plan A's stop level.
5. Summary of this AI forecast
This GOLD analysis interprets a downtrend after breaking the October range.
- A is the main playerWait for a pullback to 3952 (23.6% retracement) and stall there. A stop at 4005 is above the 38.2% retracement at 4003, and breaking this level would invalidate A as a down break.
- B is for a short-term rebound captureClose out at 3940 = Plan A's selling area. B's profit-taking becomes the entry for A, creating a continuous design.
- C is to chase follow-through on a break below 3870Take the move down without waiting for a rebound. Stop at 3900 (returning from a breached level).
In this analysis, MT5 AI Assistant organizes the market direction, key price levels, and three trading scenarios based on the chart information it read.
“AI Analysis Visualizer for MT5 AI Assistant” is a tool that visualizes AI analysis results on the chart to visually confirm entries, stop losses, and take-profit targets.
Even when there are multiple buy/sell scenarios like this, you can confirm each price level and expected price movement on the chart.
※This article introduces market analysis and forecasts by the AI analysis assistant and does not guarantee investment advice or profits. The price levels and trading scenarios shown are those at the time of analysis and may change with market conditions. For actual trading, please confirm the latest charts, prices, and spreads before making decisions.