
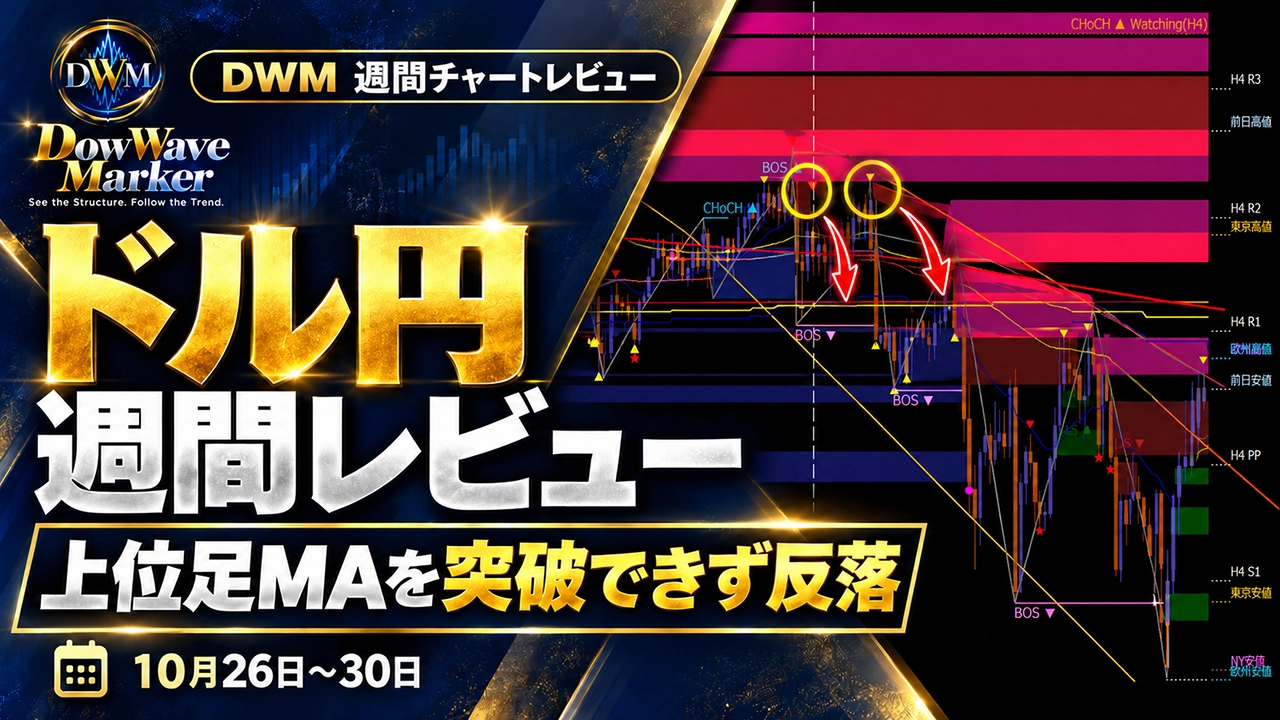
[Dollar/Yen Weekly Review] Unable to break above higher-timeframe MA, reverses—Reviewing October 26–30 with Dow Theory x Environmental Awareness
DOWWAVE MARKER | DWM Weekly Chart Review | USD/JPY / 2026.10.26–10.30
Dollar/Yen Weekly Review | Could not Break Through Higher MA on Higher Timeframes and Recedes
With Watching still undecided, the structure on the H1 timeframe shifts from an upmove to a downmove
We will review USD/JPY across the daily, 4-hour, 1-hour, and 15-minute charts. We will organize the major reversal on October 30 and three conditional scenarios for the following week.
This week’s USD/JPY movement shows an upward CHoCH and BOS confirmed on the 1-hour chart, while the 4-hour chart shows an upward CHoCH that remainsundecided as Watching, after which it reversed.
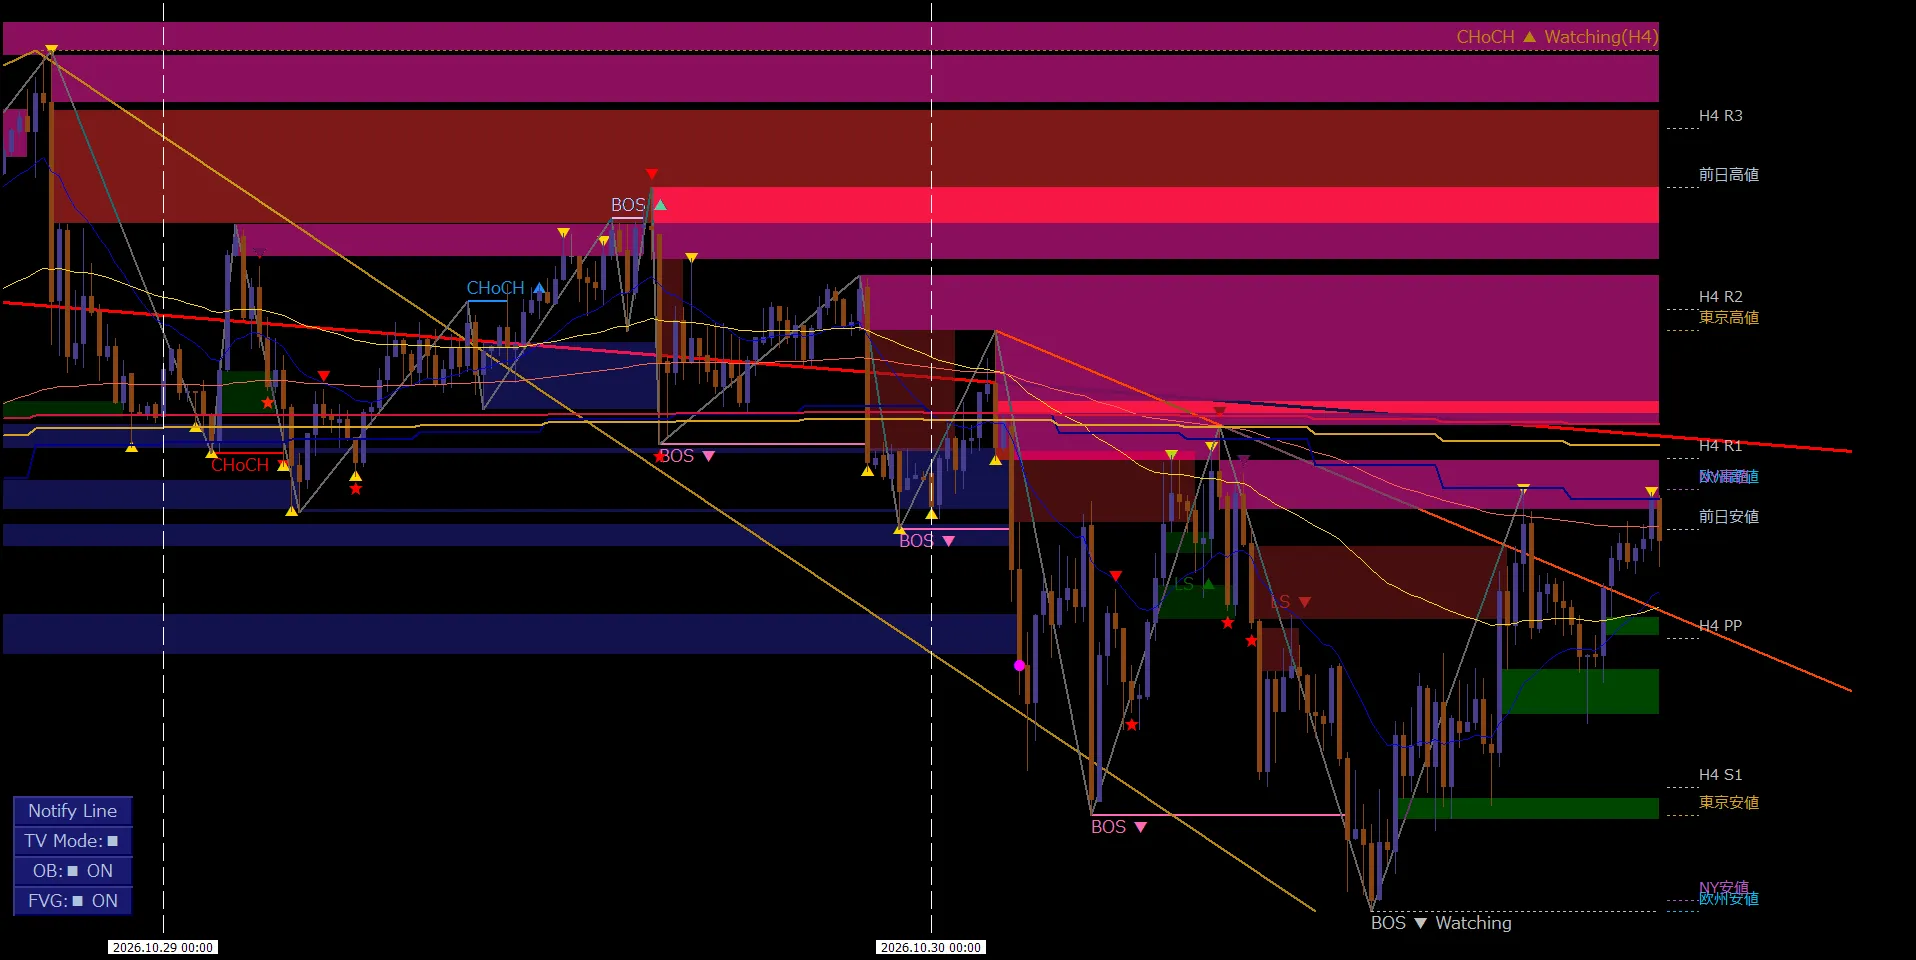
Notably on October 30 at the 15-minute chart, there were repeated attempts to push through the upper-timeframe mid-term and long-term MAs, but they did not take hold, and each reversal saw the price make wide-ranging reversals with lower lows.
Multiple thick FVGs and Order Blocks formed, providing material for interpreting a shift in market momentum.
What to pay attention to isthe time-frame differences such that the structure is confirmed on H1 but remains Watching on H4and the price action near the higher-timeframe MAs.
Watch the video for the chart | USD/JPY Weekly Review

You can also review the article content in video form. If playback is unavailable,Watch the USD/JPY Weekly Review on YouTube
If you want to verify CHoCH/BOS or the higher-timeframe MAs on actual charts,DowWave Marker 14-day Free Trialis available for you.
01 / DAILY STRUCTURE
Daily: No Confirmation of Direction Change in a Rebound
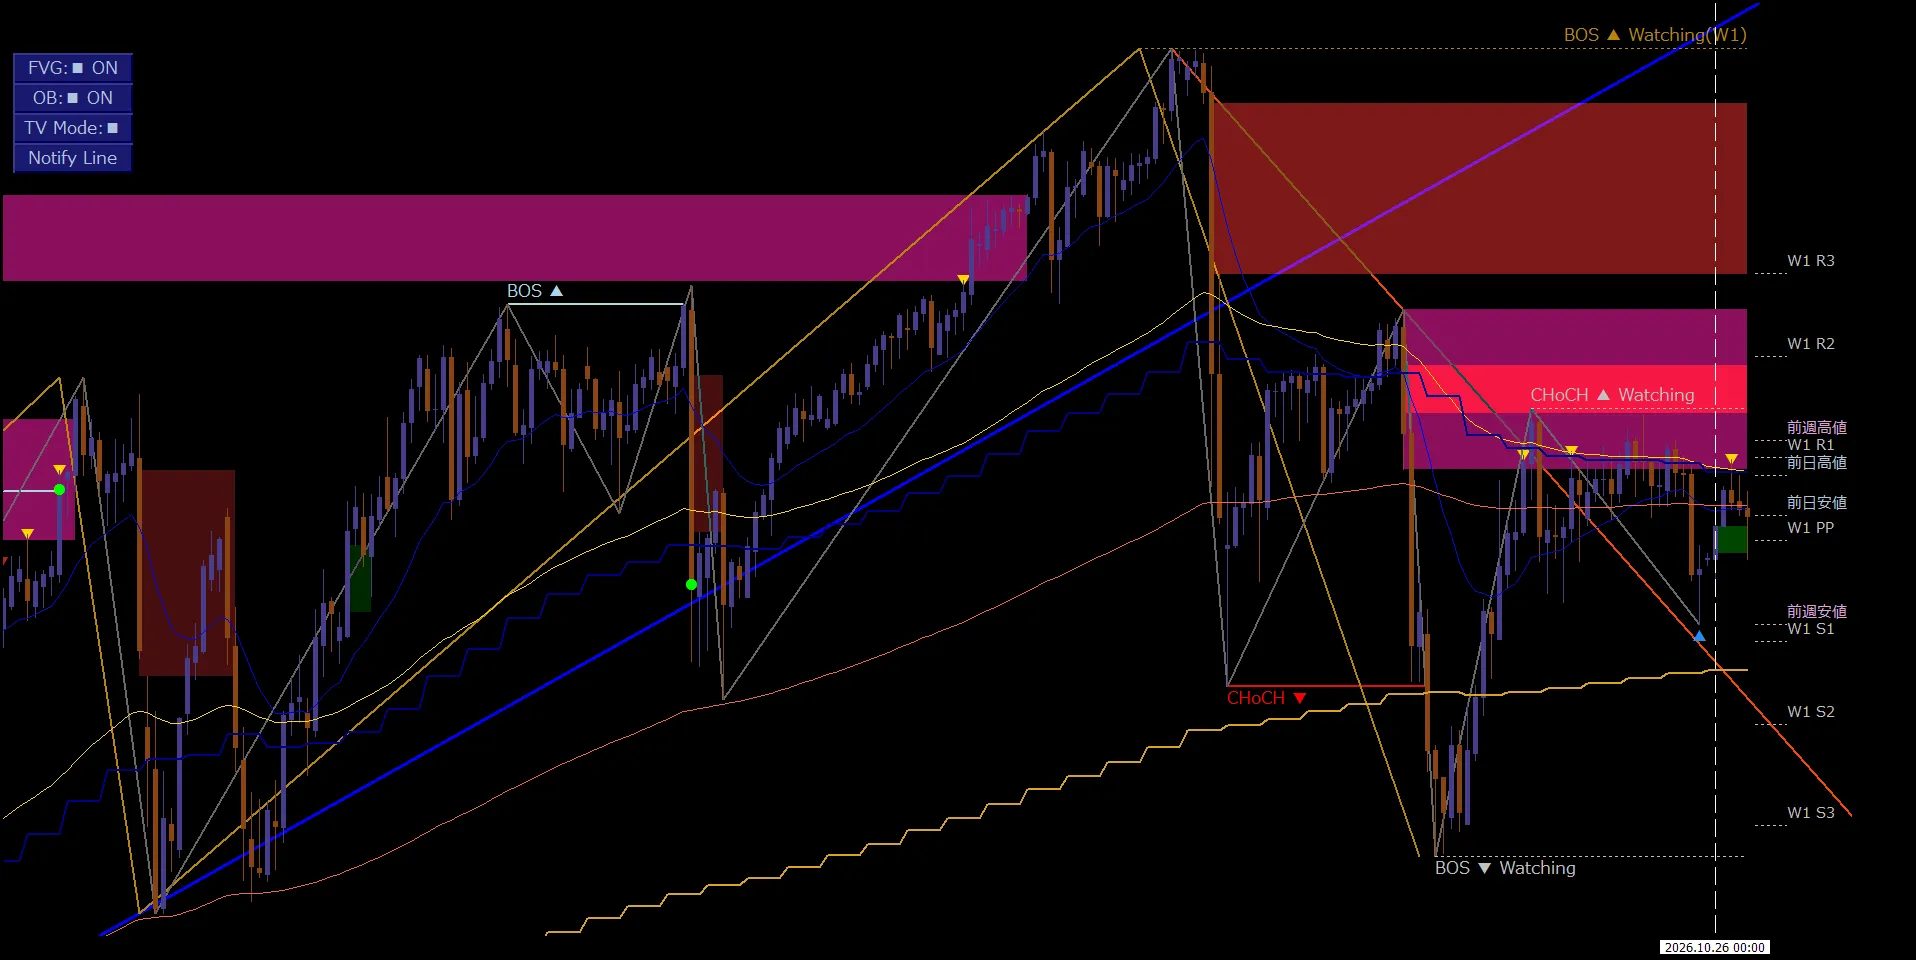
On the daily chart, after a prior large decline and a rebound, it has been moving around near moving averages and important price zones.
In addition to Watching for the upward CHoCH, a downward structure candidate is also visible, making it difficult to conclude that an explicit uptrend has been established on the daily chart.It is hard to conclude an explicit uptrend on the daily chartgiven the environment.
Watching is a stage to monitor candidate CHoCH and BOS.
We will examine which price bands need to be broken, distinguishing them from confirmed structural changes.
02 / H4 WATCHING
4-Hour: CHoCH Watching Not Confirmed, Reverses
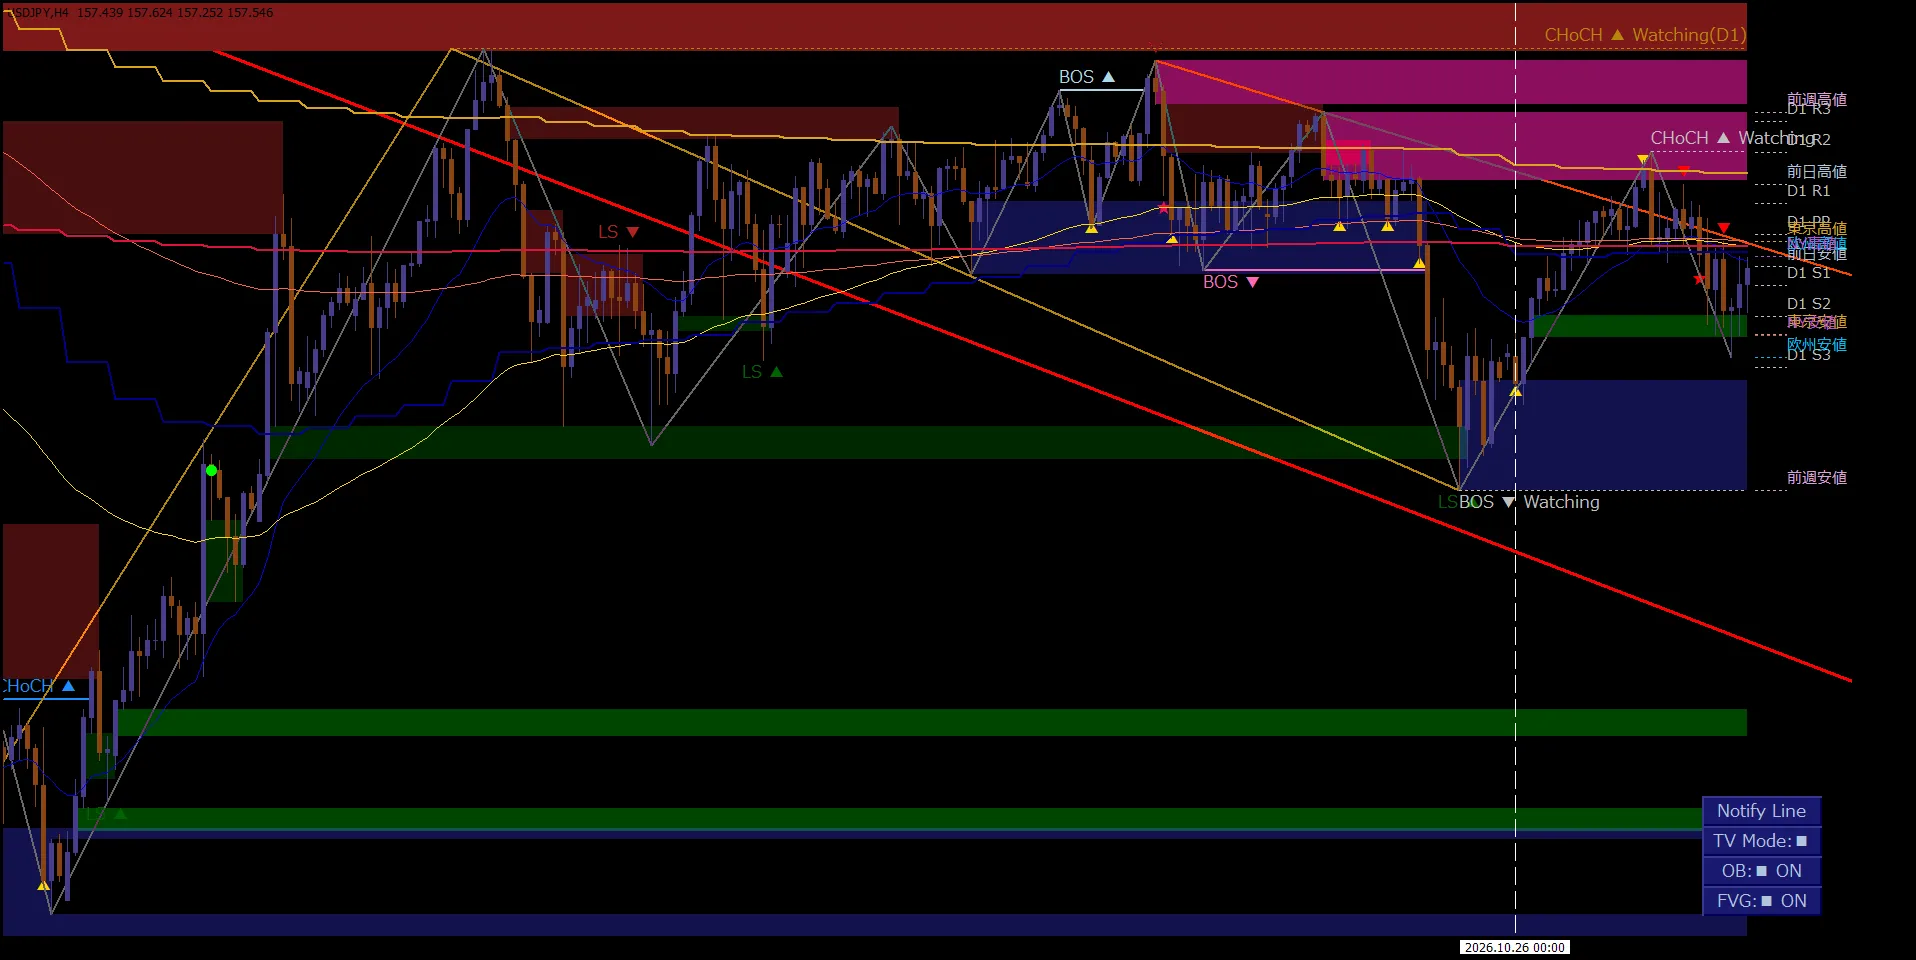
In the 4-hour chart, price retraced in the early part of the week toward a Watching level for upward CHoCHapproaching, but did not reach confirmation conditions, and price reversed.
However, it did not reach confirmation, and price has since fallen.
“Even reaching Watching did not confirm”could lead to misinterpretation of the decision conditions.
What can be confirmed here isthe price level being approached but CHoCH not yet confirmedduring the progression.
We also check the relationships with upper FVGs, Order Blocks, and moving averages.
03 / H1 STRUCTURE
1-Hour: Upward CHoCH and BOS shift to Downward BOS
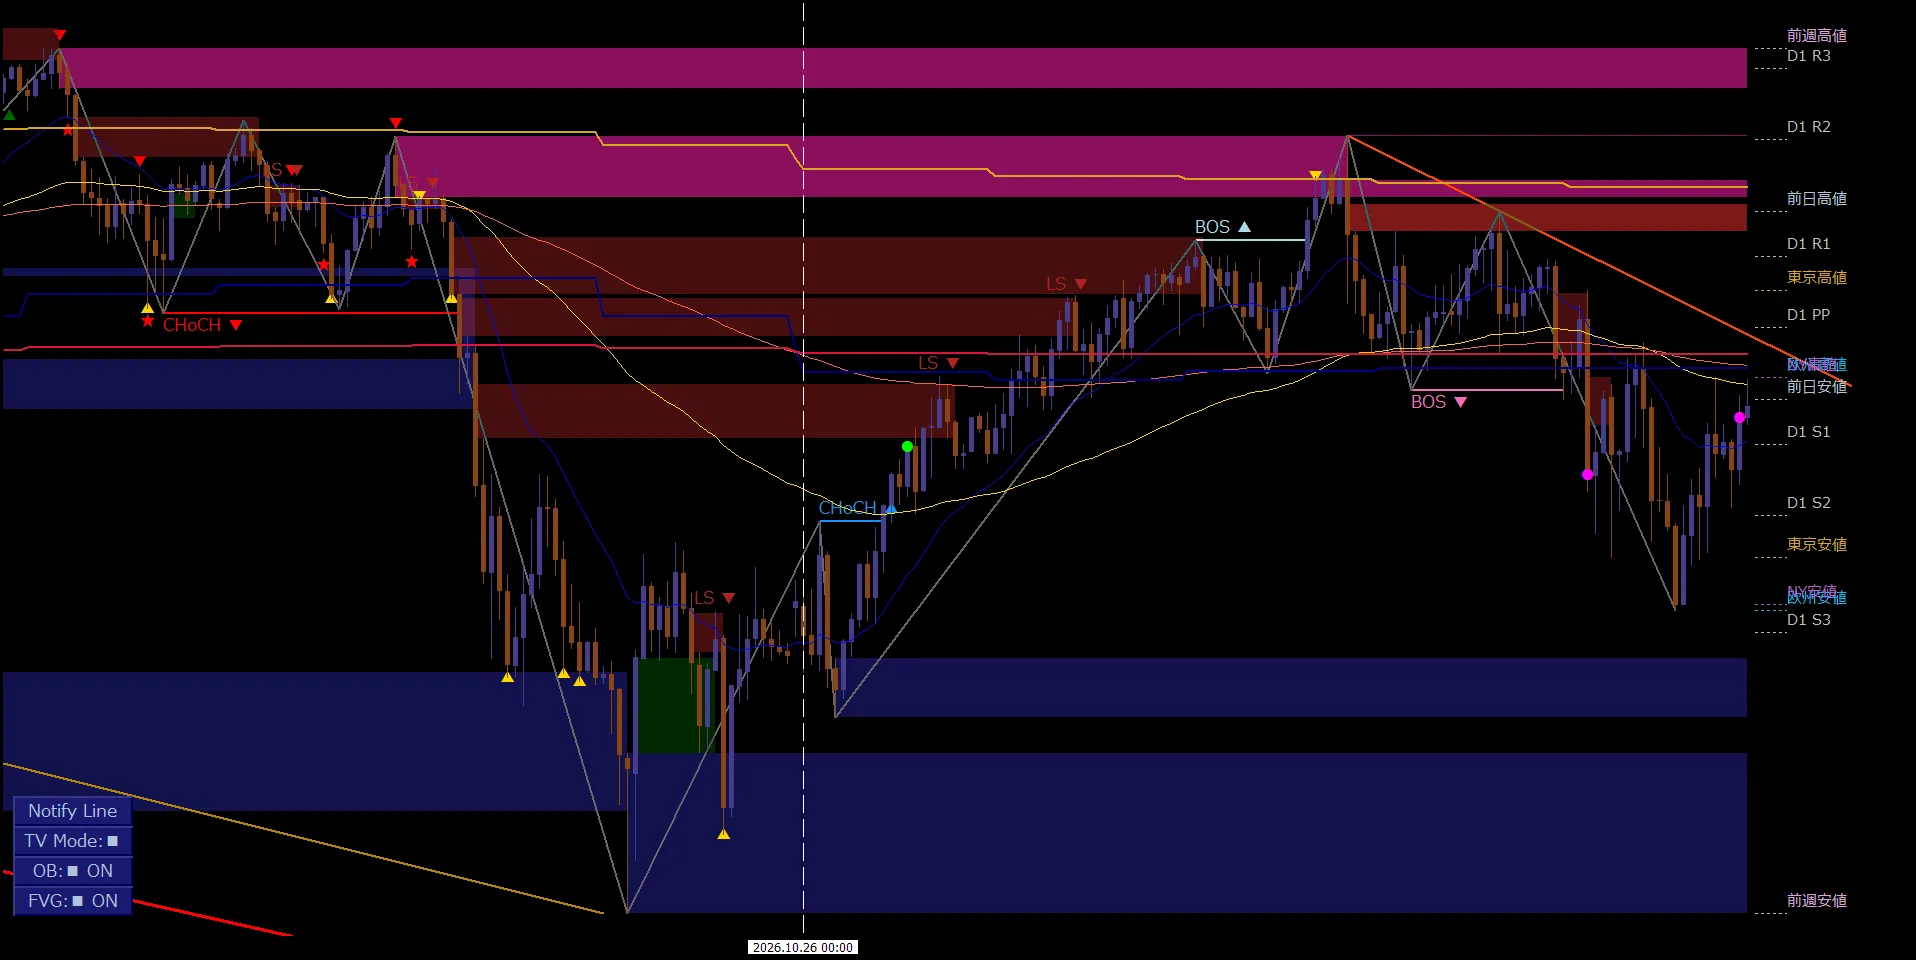
On the hourly chart, an upward CHoCH and then an upward BOS were observed in the first half of the week, forming an up-move structure at one point.
But it could not sustain above a key higher level, reversing again. Since thenthe downward BOShas appeared.
Even within the same week, on H1 there was a confirmed upward structure, while on H4 the upward CHoCH remained only Watching.
A key lesson is not to declare a higher-timeframe trend reversal based solely on the active timeframe decisionmarks.
04 / M15 RANGE & MA
15-Minute: Reattempt of Higher-Timeframe MAs and New Lows
The movements on the 15-minute chart can be seen for October 29–30.
On the 30th, the price repeatedly tried to move above the mid- and long-term MAs on the higher timeframe but failed to sustain, reversing each time and making new intraday lows.
There were periods of notable reversals, so it can be viewed as a wide-ranging range.
However,it was a pattern more of wide reversals with lower lows rather than a simple horizontal range with fixed bounds.
Even if there was a bounce toward the end of the week, we cannot conclude that a price uptrend was confirmed solely by that movement.
05 / FVG & ORDER BLOCK
What Thick FVGs and Order Blocks Imply
In the last two days on the 15-minute chart,there are multiple thick FVGs and Order Blocksdisplayed.
They provide clues for segments where large candles or rapid price moves occurred.
FVG represents price imbalance, and Order Block captures a specific price range in a different sense.
Having both does not guarantee future reversals or declines.
We also overlay previous day/week highs and lows, market highs/lows, pivots, etc., to assess distance to next key levels.
06 / NEXT WEEK 11.02–11.06
Next Week Outlook: Three Conditional Scenarios
For USD/JPY from November 2–6, 2026, starting from the H4 Watching undecided status on Oct 30 and the reversals around the higher-timeframe MA on M15, we organize the conditions to check.
This is not a forecast of future price moves.
A) If the rebound is contained and price falls again
The focus is whether the H4 upward CHoCH remains Watching and whether it can hold the rebound high.
If the H1 shows lower highs or continuation of downward structure, and the M15 also confirms a downward BOS, a move testing the week's low is possible.
We check the downside market lows and new Pivot levels for potential take-profit opportunities.
B) If the higher-timeframe MAs are broken and a stronger rebound occurs
On the 15-minute chart, test whether the price can break above the mid-term and long-term MAs on the higher timeframe, and hold above them.
Then observe whether the H1 structure re-forms with upward CHoCH/BOS.
In H4, it is important whether there is a confirmed determination for the Watching candidate level.
Do not certify H4 upside reversal merely from an M15 breakoutto avoid overestimating a top-down reversal.
C) If wide-ranging reversals continue
If price cannot break above a key upper level and lower lows do not continue, a broad oscillation in both directions may persist.
We organize the range bounds, higher-timeframe MAs, and Watching confirmations, focusing on both the movement direction and the current price position.
Next week, weekly Pivot levels will be updated.
Do not simply treat October 30 Pivot levels as final for the following week, but check the updated chart for confirmation.
07 / ABOUT DWM
Reading Multiple Timeframes with Dow Theory and Environmental Awareness
DowWave Marker (DWM)is an environment awareness indicator for discretionary trading that visualizes CHoCH, BOS, and Watching based on Dow Theory, and enables verification with higher-timeframe MAs, FVGs, Order Blocks, market highs/lows, previous day/week highs/lows, Pivot, and more.
This time, for USD/JPY,“H1 upward CHoCH/BOS confirmed → H4 Watching undecided → price upper limits cause downward BOS on H1 → big range around MA on M15”a notable characteristic of how timeframes reveal different perspectives.
08 / 14-DAY FREE TRIAL
View DWM on a 14-day Free Trial
On your own chart, you can verify Watching vs confirmed, the position of higher-timeframe MAs, and the distribution of FVGs and Order Blocks.
MT4 / MT5 compatible, full features of the SMC-integrated model
the market structures, higher-timeframe MAs, and key price levels discussed in the video can be checked on your chart as well.
09 / SUMMARY
Summary: When the trend isn’t clear, confirm structure and current position
From October 26 to 30, USD/JPY showed an undecided higher-timeframe structure, with H1 shifting from an upmove to a reversal, and M15 displaying wide-ranging reversals around higher-timeframe MAs.
Do not rely on a single timeframe signal to conclude your assessment,instead, evaluate using CHoCH/BOS/Watching across multiple timeframes, MA, FVG/Order Block, and important levelsto manage market uncertainty.
See the Structure. Follow the Trend.Identify market structure and align with the trend.
Reviews for other symbols in the same week are also published:GOLD Weekly Review | YouTube: Reversal on the 4-hour mid-term MA and FVG
※ The outlook for next week is a set of conditional checks and does not predict or guarantee future price moves.
※ The market highs/lows and Watching shown at the right edge of the chart do not imply that these states were the same at all prior points. When a new week begins, please check updated Pivot levels.
※ DowWave Marker is a tool to assist discretionary judgment. Please make trading decisions at your own risk.