
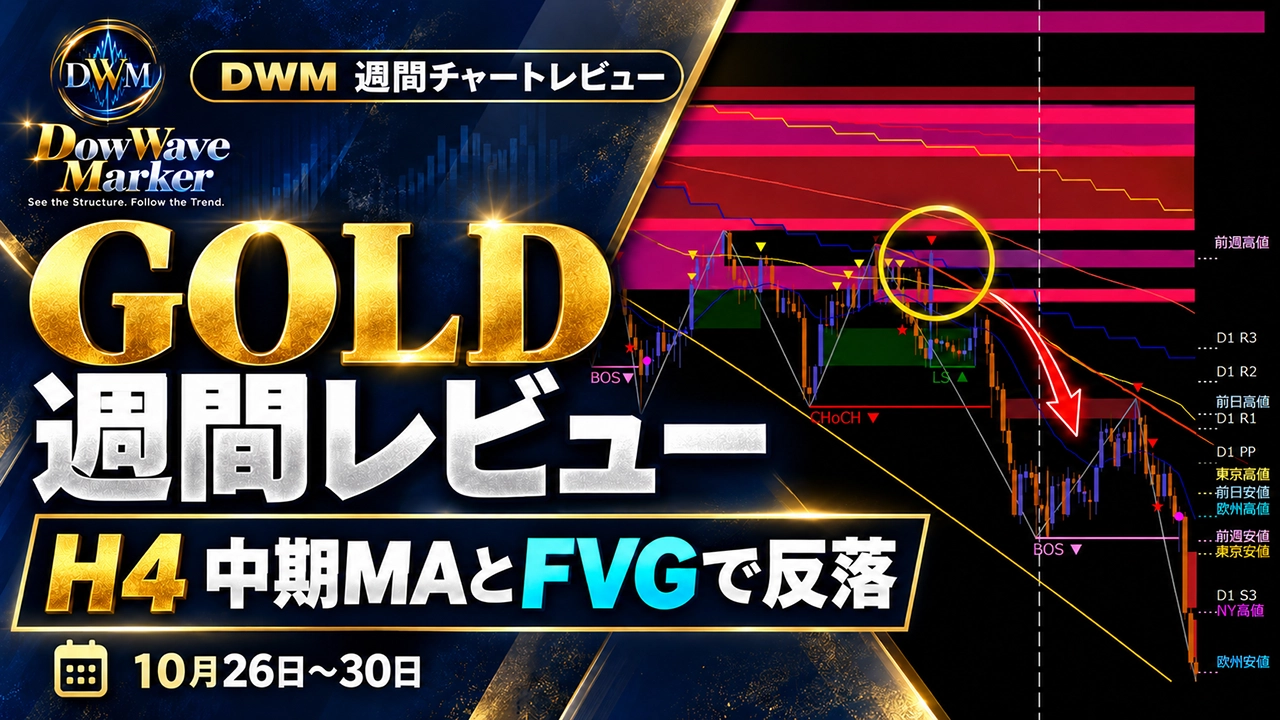
【GOLD Weekly Review】A pullback with H4 medium-term MA and FVG — Dow Theory × Environmental Awareness review for October 26–30
DOWWAVE MARKER | DWM Weekly Chart Review | GOLD / 2026.10.26–10.30
GOLD Weekly Review — Reversal with mid-term MA and FVG on the 4-hour
How to read the downtrend environment on the higher timeframe and the temporary upward structure on the H1
We review GOLD (XAUUSD) across four timeframes: daily, 4-hour, 1-hour, and 15-minute. We also explain next week's scenario by conditions based on the structure as of October 30.
This week's GOLD market saw,on the 4-hour chart, price retreat from a region where it approached the mid-term moving average and FVG, unable to break higherand reversed.
Later, the downside accelerated toward the end of the week.
What to note is that on the intermediate 1-hour chart, an upward CHoCH and BOS appeared.
If the lower timeframes show an upward structure, but the daily and 4-hour charts remain biased to the downside, how can we organize our view of the overall market?
The point here is not merely the fact that price returned, butto what important price levels it retraced and what was confirmed there.
Watch the chart in the video|GOLD Weekly Review

You can also review the article contents via video. If playback fails,Watch GOLD Weekly Review on YouTube
If you want to verify with your own chart using a free trial,DowWave Marker 14-day Free Trialis available.
01 / DAILY & H4
Daily & 4-hour: Pullback suppressed within a downtrend
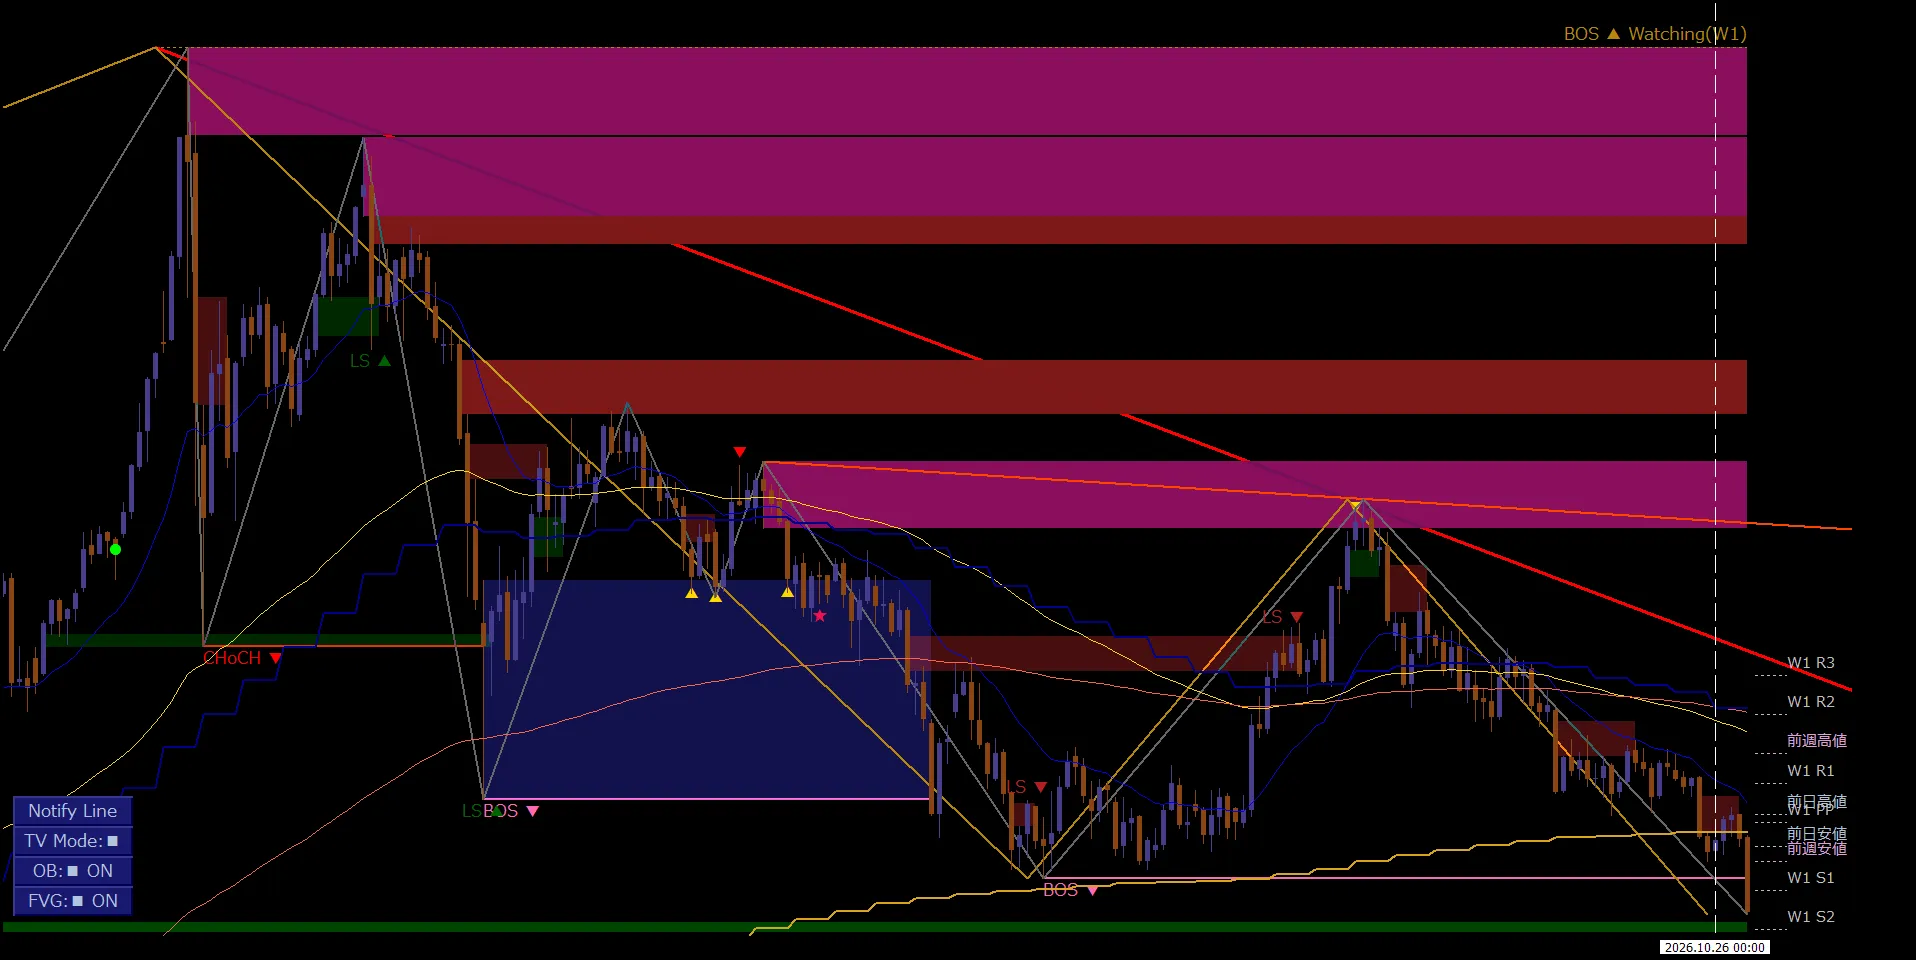
On the daily chart, the price continues to push lower, forming a lower high against the prior downtrend structure.
As of October 30, the price was below the major moving averages, and the daily downtrend remained in control.
Note that the higher-timeframe BOS▲ Watching (W1) is a candidate display and not a confirmed upward BOS.
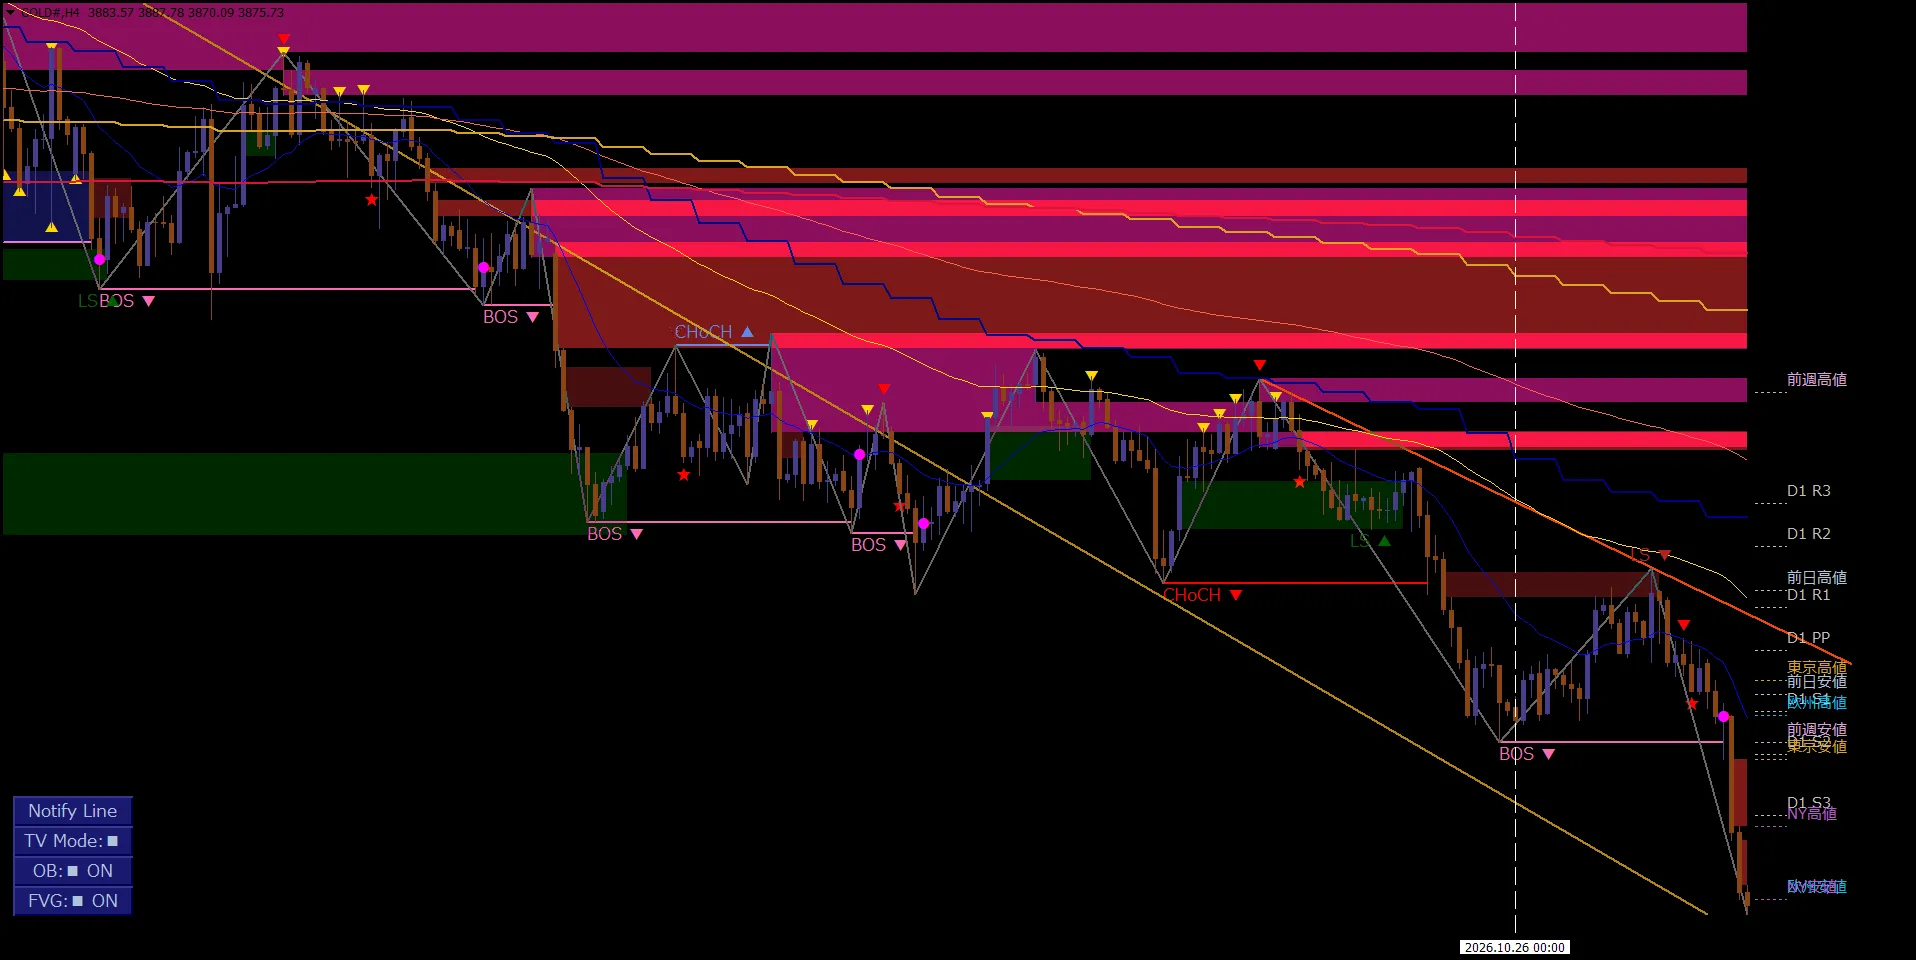
On the 4-hour chart, price retraced into the middle of the week andapproached a region where FVG and nearby mid-term MA converge.
However, a clear breakout above the mid-term MA could not be achieved, and price reversed.
The decline resumed, and toward the end of the week the downside momentum strengthened.
We should not attribute the reversal solely to FVG; rather, view it as a region where the retracement high, higher-timeframe MA, and the FVG align structurally.
By doing so, we can confirm not only whether price rose, but also“where the rise was capped”.
02 / H1 STRUCTURE
1-hour: Upward CHoCH and BOS and the difference from higher timeframes
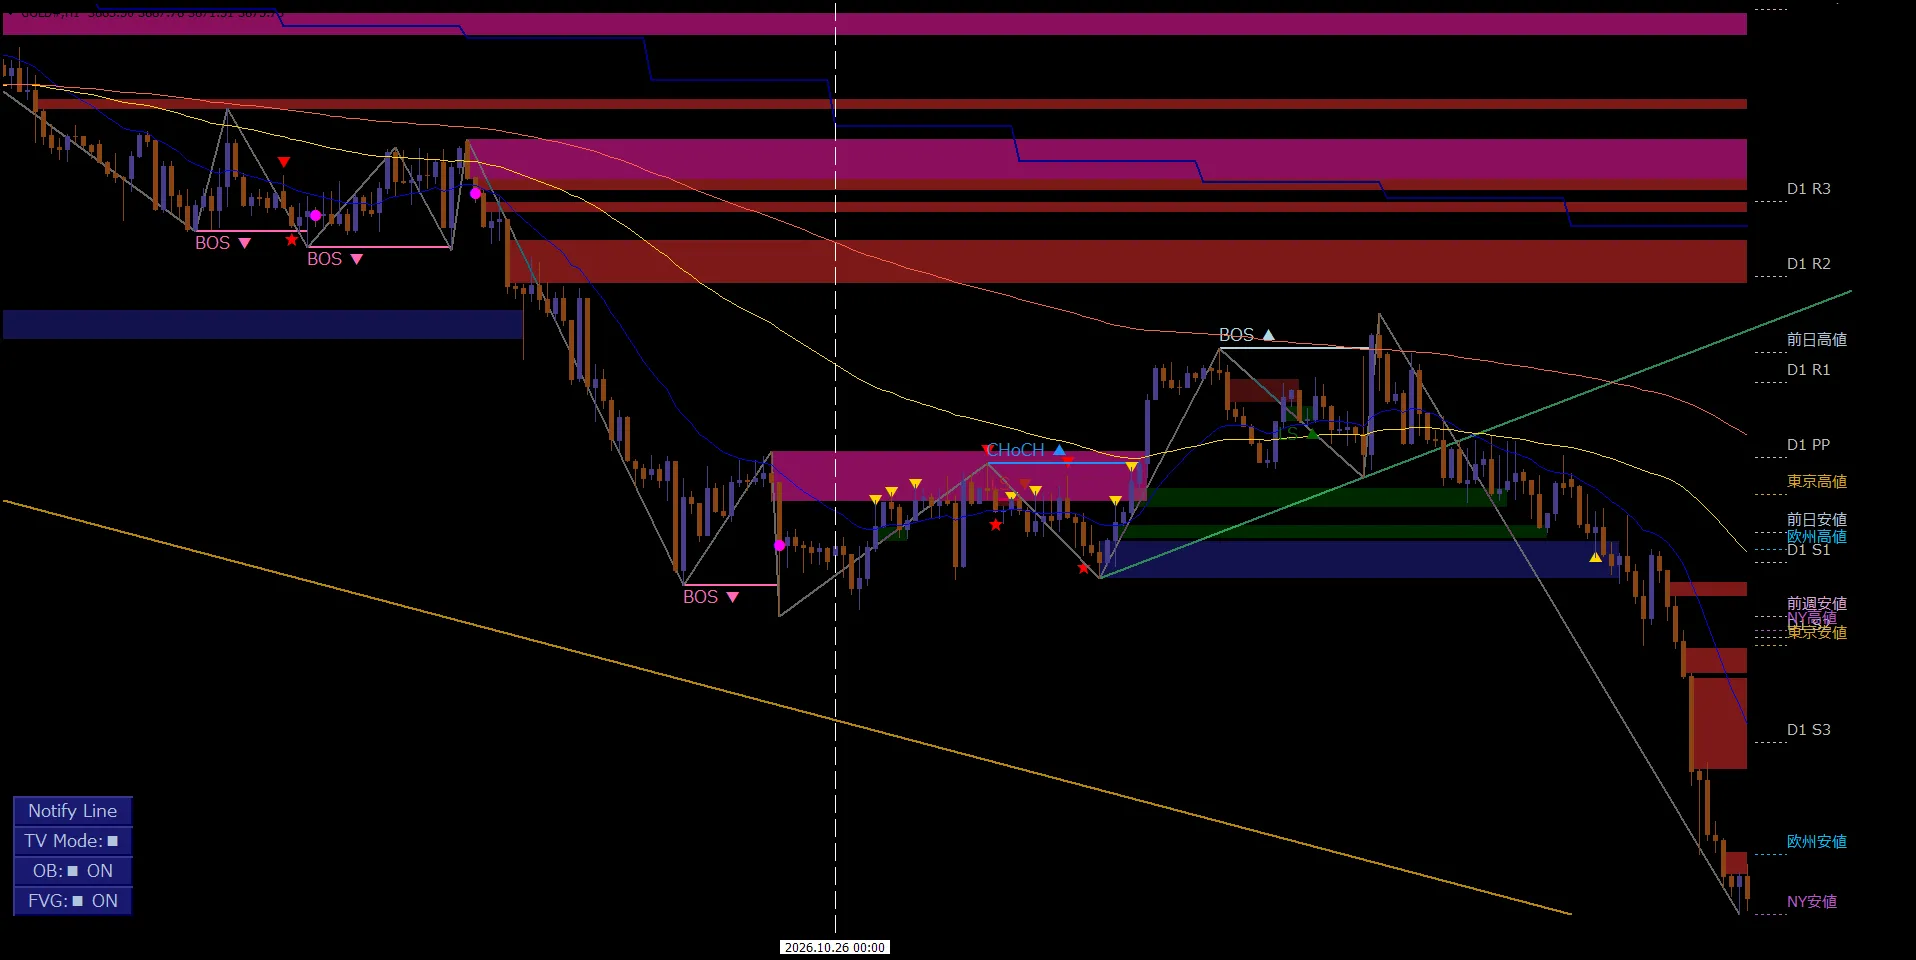
On the 1-hour chart, there was temporarilyan upward CHoCH followed by an upward BOS.
Viewed in isolation, the structure favored upside movement on the 1-hour chart.
However, on the higher timeframes of 4-hour and daily, the downside bias continued.
In reality, the upward move on H1 did not sustain, and after retracement near the 4-hour mid-term MA and FVG, price moved downward again.
It is important to evaluate CHoCH/BOS as the structure of the time frame on which they occur, separate from the higher-timeframe environment..
03 / M15 EXECUTION
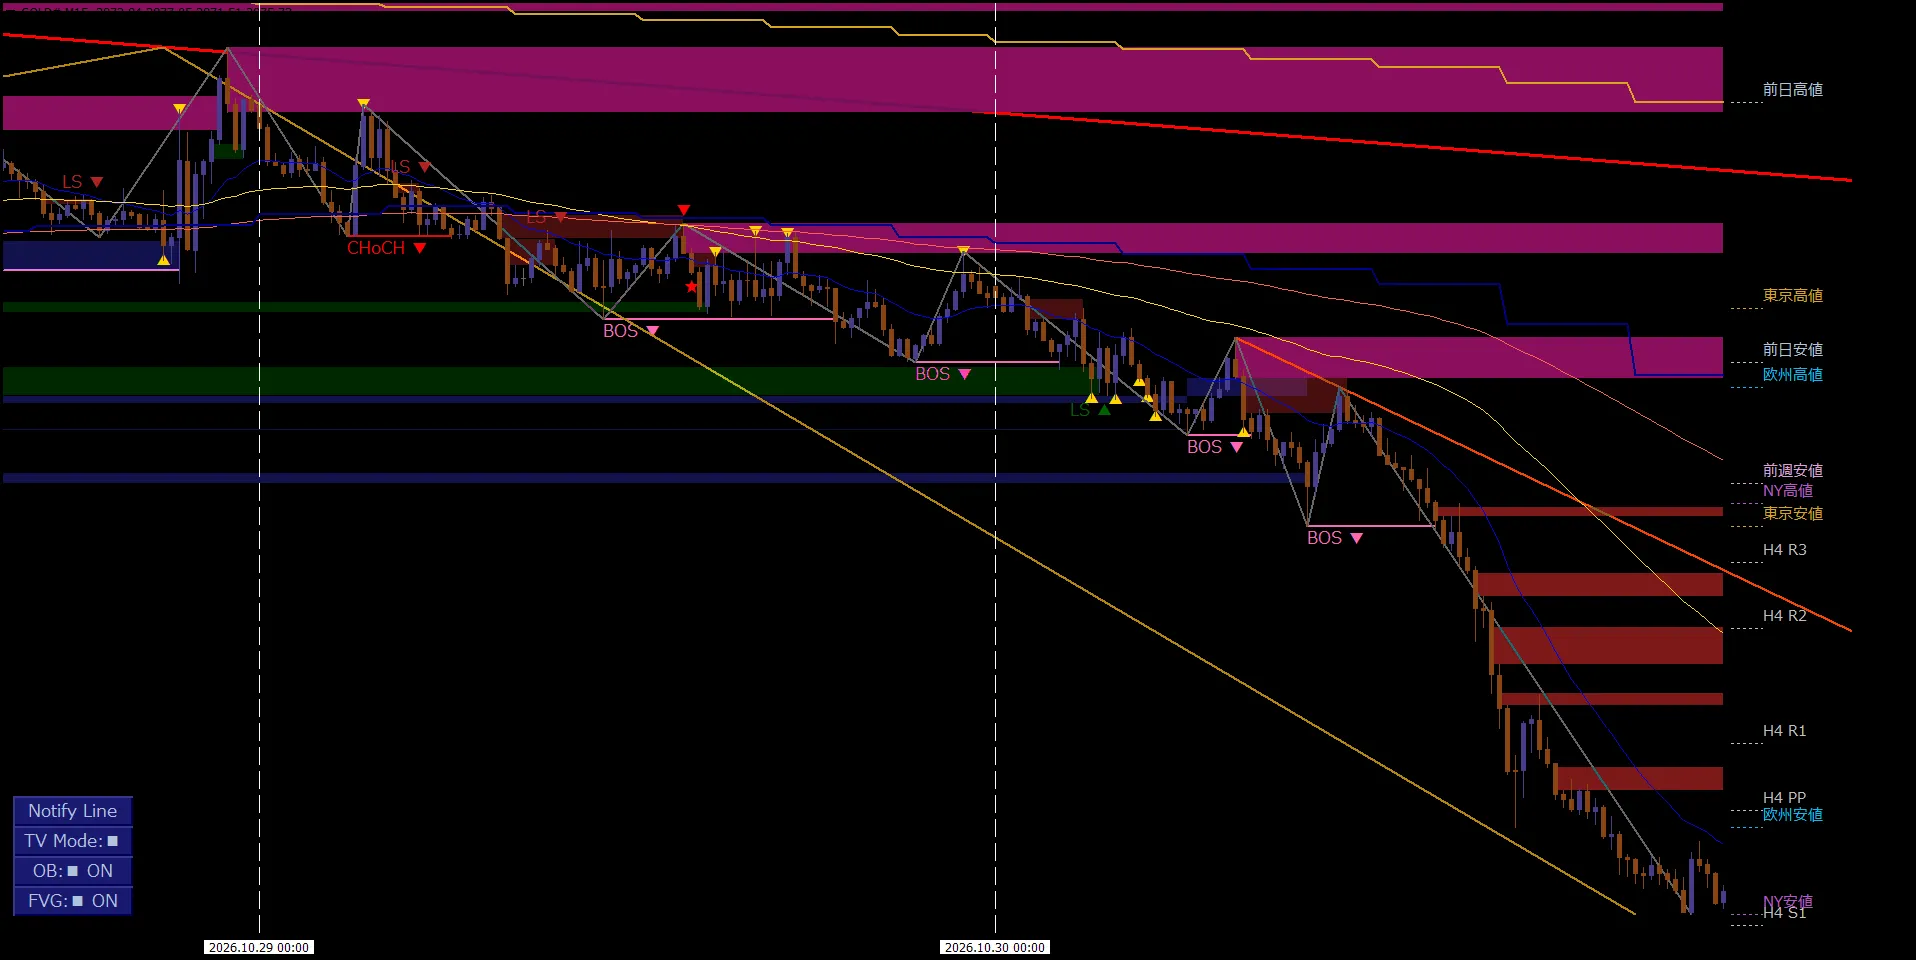
15-minute: Downward BOS continues while retracing
The 15-minute screenshot predominantly shows price action from October 29–30.
As price retraced, multiple downward BOS signals appeared, with new swing lows forming.
The downward momentum intensified especially on the 30th.
After the drop, the upper part of the chart displays multiple FVGs and Order Blocks.
Meanwhile, there are key lower levels such as market lows and pivots, and even if the market environment is bearish,it is necessary to evaluate the distance to the new sell entries’ targets and stop losses.
04 / RISK & REWARD
Important levels should be used not only for entry but also for exit decisions
Even if the direction aligns, entering after a large drop may leave insufficient profit room to the nearest important level for a quick exit.
DWMallows you to see market structure and critical price bands on one screen, enabling risk-reward assessment before executing trades.
05 / NEXT WEEK 11.02–11.06
Outlook for the next week: three scenarios by condition
From November 2–6, 2026, starting from the downward-biased environment as of October 30, we predefine the confirmation conditions.
The following are not buy/sell predictions, but scenarios to update our view as market conditions change.
A. If the down structure continues
Check whether the H4 retracement high is suppressed and the down structure remains intact.If the retrace stalls at important zones like the mid-term MA and FVG, and an upward BOS reappears on H1 and M15, the focus shifts to whether new lows are being made this week.
If considering selling, confirm there is still room for profit-taking up to the lower-level support after the move lower.
B. If retracement expands
The first point of note is whether the H4 mid-term MA and FVG can be broken above and then hold above.
Even if CHoCH/BOS is confirmed on H1 for an upside move,do not conclude an upward reversal on daily/H4 based on that alone, and verify whether the higher-highs/high-lows structure on H4 also changes.
Upper-level Order Blocks and FVGs can become next resistance candidates, so evaluate their relative positions when considering following a move.
C. If price remains in a range
If the week's low is not breached and the upper zones are not taken out, a range could form with defined upper and lower bounds.
Rather than deciding direction first, observe the range’s highs and lows and confirm a change from Watching to Confirm on DWM.
Next week, weekly pivots will also update.
Do not treat the October 30 pivot as the confirmed level for the following weekas is.
06 / ABOUT DWM
View market structure and key levels on one screen with DWM
DowWave Marker (DWM)is an environment-aware indicator for discretionary trading that integrates visualization of CHoCH, BOS, Watching, higher-timeframe MAs, FVGs, Order Blocks, market highs/lows, previous day/week highs/lows, Pivots, and more, based on Dow Theory.
In GOLD this time,“temporary upward structure on H1 → return to 4-hour mid-term MA/FVG → reversal → downward BOS and new lows on M15”was exemplified by cross-checking across multiple timeframes.
07 / 14-DAY FREE TRIAL
Verify your environment awareness with a 14-day free trial
Understand how CHoCH/BOS judgments differ between higher timeframes and execution timeframes, and where profit opportunities lie.
You can check DWM features on your own symbol and timeframes as well.DWMis available for MT4/MT5 and includes an integrated SMC model. You can review market structures, higher-timeframe MAs, and key price bands on your own chart during the 14-day free trial.
MT4 / MT5 supported • SMC Integrated Model
08 / SUMMARY
Summary: Overlay higher-timeframe direction with retracement location
GOLD from October 26–30 continued in a daily and 4-hour downtrend, with mid-week retracement suppressed near the 4-hour mid-term MA and FVG, followed by renewed decline.
The upward CHoCH/BOS on H1 also needed interpretation in light of the higher-timeframe environment.
Not only the occurrence of structural change, but also the time frame, the MA position, and the distance to important levels should be combinedto inform environment awareness and risk-reward assessment.
See the Structure. Follow the Trend.Identify market structure and align with the trend.
There are reviews of other symbols in the same week as well:Dollar-Yen Weekly Review | Unable to break higher-timeframe MA and reverses on YouTube
※ The next week's outlook is a set of conditions to check, not a prediction or guarantee of future price movement or profit.
※ The market highs/lows and Watching displayed at the chart's right edge do not imply that those states held at all past times. Please check pivots and other updated levels when weeks change.
※ DowWave Marker is a tool to assist discretionary decisions. Trade decisions should be made at your own responsibility.