
The Way of Investment (Chapter 276)
The Way of Investment(That276)
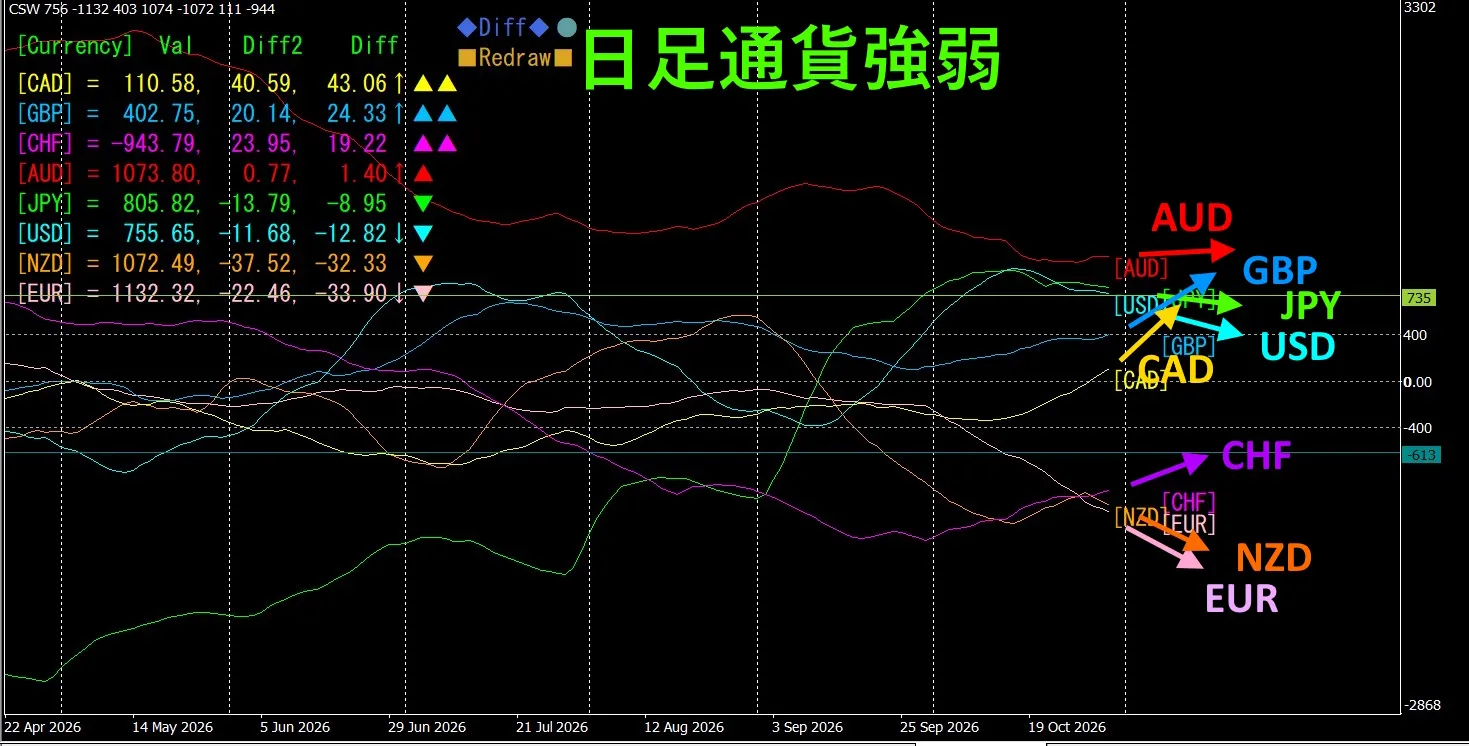
1.First,From the daily chartDaily currency strength charts、4hour charts we will examine in order。
Daily currency strength charts、4hour charts we will examine in order。
CAD, GBP, CHF, AUDare rising.EUR, NZD, USD, JPYare falling..On the daily chart、CADrisesandEURfallsstand out.
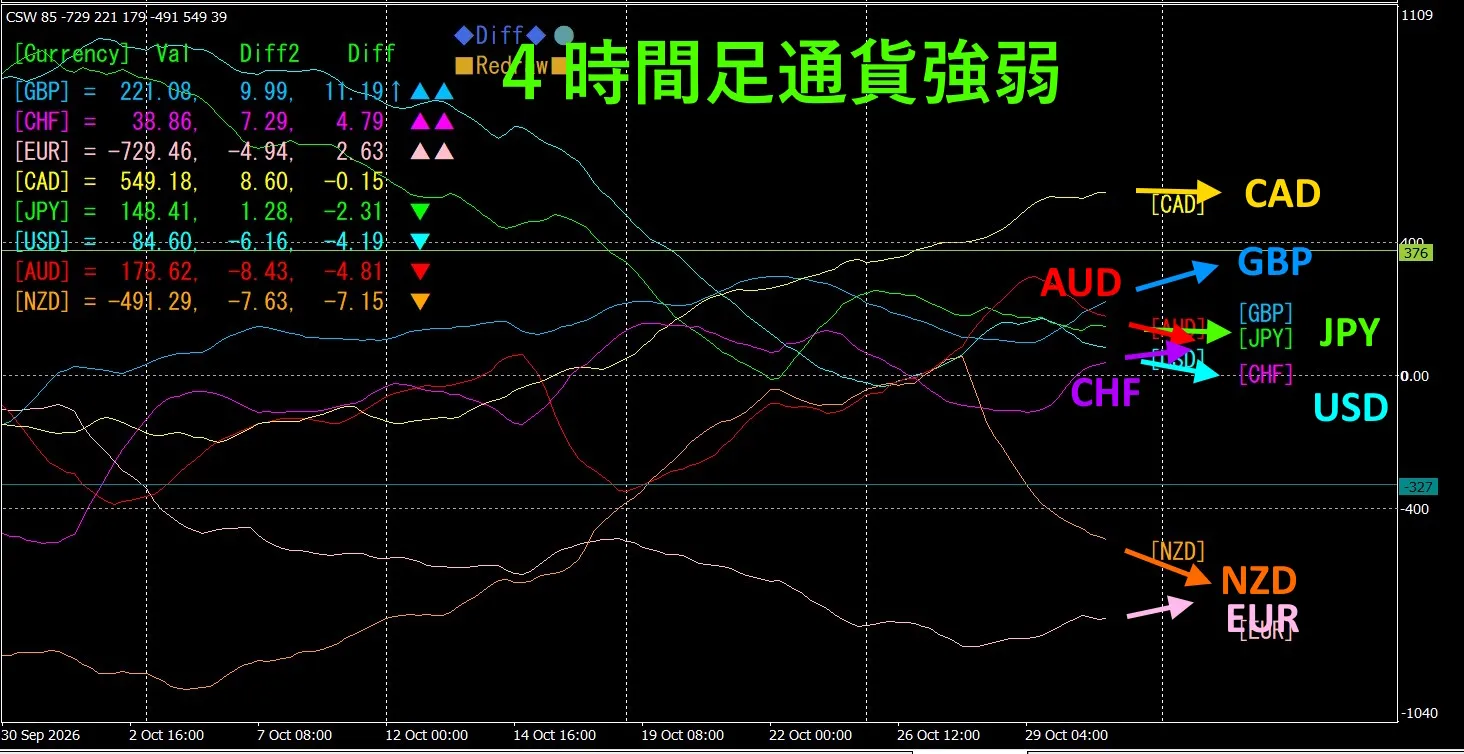
2. 4hour chart
GBP, CHF, EURrise.NZD, AUD, USD, JPYfall.
CADis horizontal.
3.Movements of precious metals, GOLDwillplummet
Using the “8CFD Visualization Indicator Any Version”, displaythe movements of precious metals on the 1-hour chart.
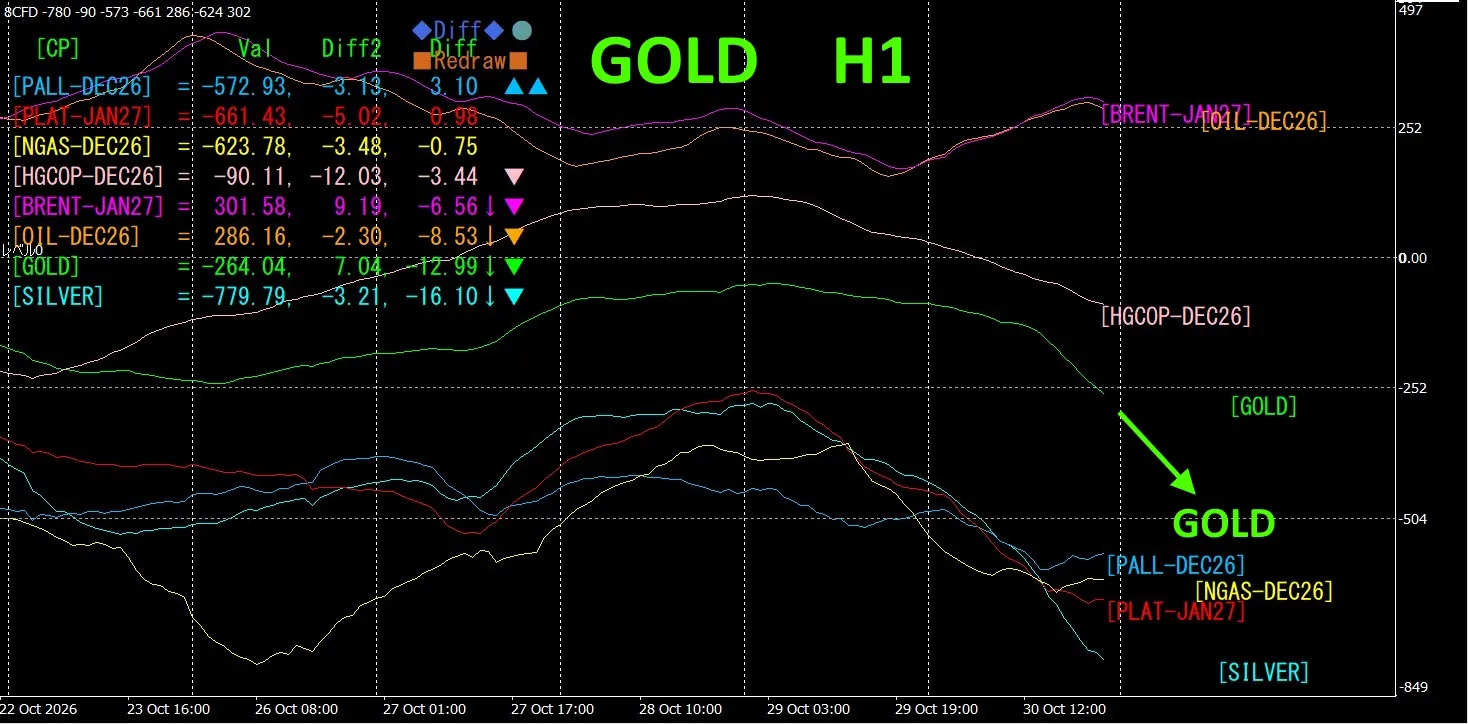
GOLDis dropping sharply.Precious metals in general are also bearish.Conversely, oil-related assets are moving up.For a whileGOLDis unlikely to rise much in this market environment.
4. 【New Plan】 Market environment analysis by AI
We developedanew indicator, trend-detection indicator “MTR28_TrendMACD” (not released yet).This indicator, generates all source code without a human writing a single line, using AI.This indicator is, and the entire output was generated by AI without human coding...

Originally it was created to capture the initial move of the trend, but, by combining this indicator with currency strength charts, we created a prompt to hand the market analysis entirely to AI.As a result, we obtained outputs that seem quite usable, so, we will publish it as a【New Plan】 project.
The screen copy of the “MTR28_TrendMACD” indicator is shown below.
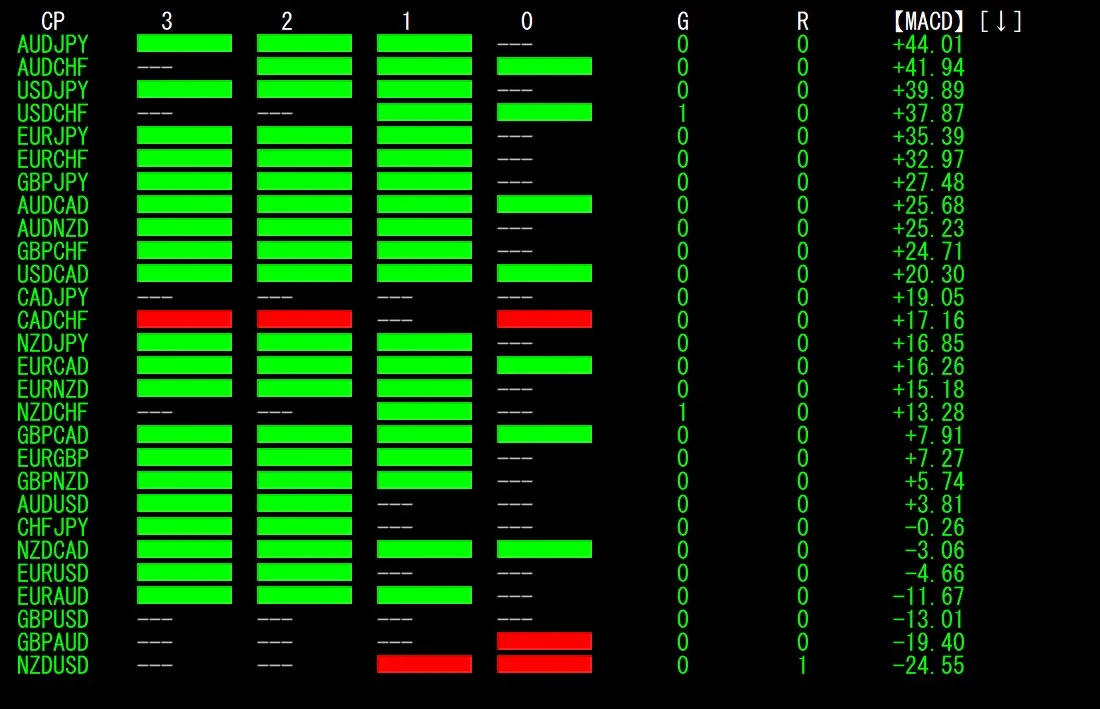
Red and green bars, red indicates a downward trend, green indicates an upward trend.Trendless is, --- shown.The first column is the currency pair name, 3,2,1,0 denote,. respectivelyG Time[3],Time[2],Time[1],Time[0] and R show, whether a trending pair is emerging or reversing, as 1 and 0.In the G column, a pair with 1 is a rising trend, and in the R column, a pair with 1 is a falling trend.
The rightmost column shows the, standardized MACD value, which decides how far the rate is deviating from the moving average based on this value.
The overall flow is as follows。
(1) “MTR28_TrendMACD”, AI automatically selects 8 currency pairs.
↓
(2) combines it with the data from (1), performs environment analysis, and assigns a score from 0-100.
↓
(3).
It will be a somewhat lengthy report, but, below is the text output by AI.