Utilization of the "Visualization Indicator" (Part 275)
“Visualization Indicator” Utilization(Part275)
1. Further evolving the “28 Currency Pair List Indicator” into the advanced indicator
“8CP Visualization Indicator”toAUDNZDDraw
The “8CP Visualization Indicator”hasOceania version, London version, NewYork version, and AnyCP versions available.This time, the Oceania version was used.
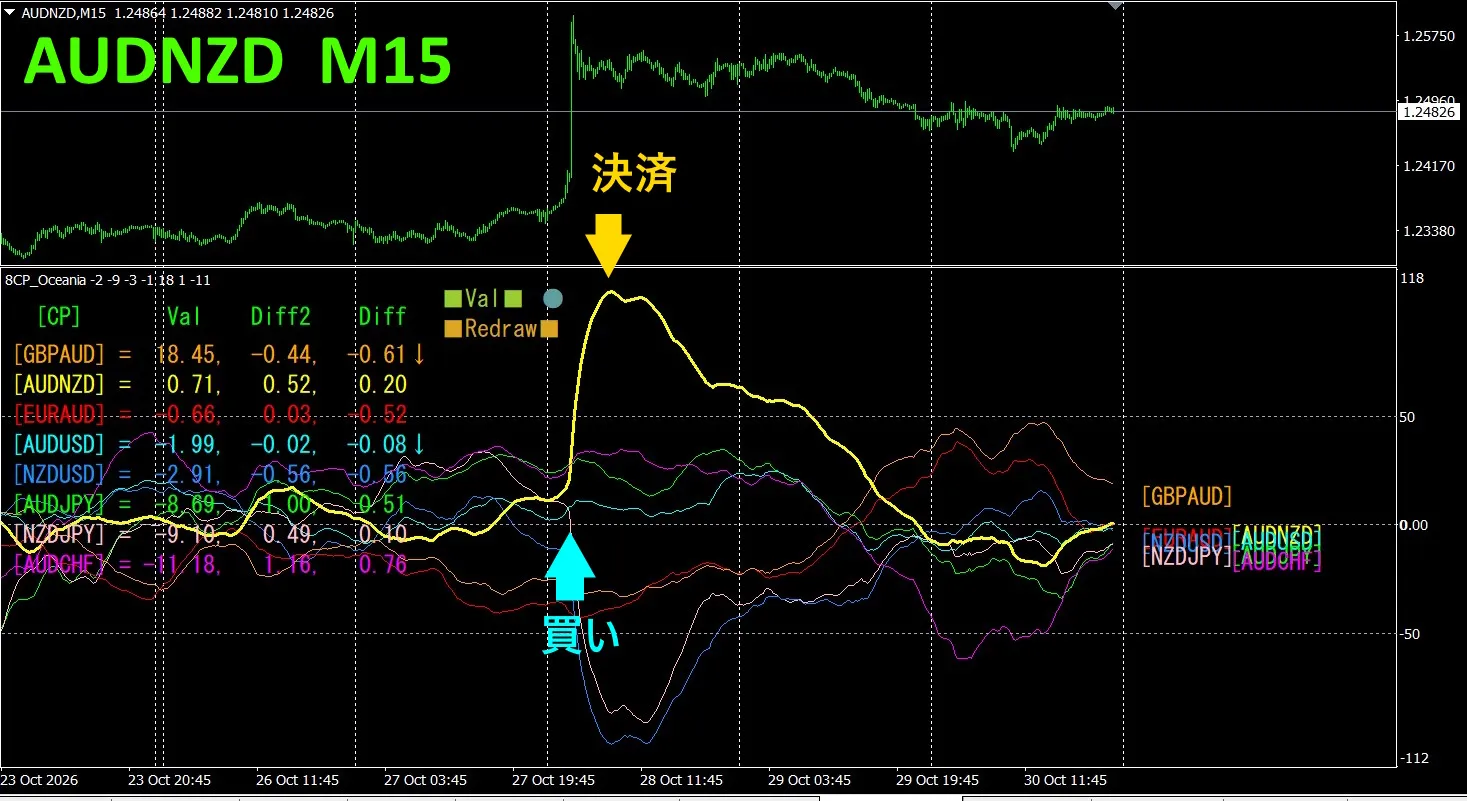
The upper half,AUDNZDis a15-minute chart.The lower halfis by the “8CP Visualization Indicator”.,the thick yellow linegraphcorresponds to AUDNZD.
On Wednesday, the AUDNZDgraph,shot up above the other group of graphs,so we buy.We closed at the day’s topfor about140pipsof profit.
Currency Strength Graph
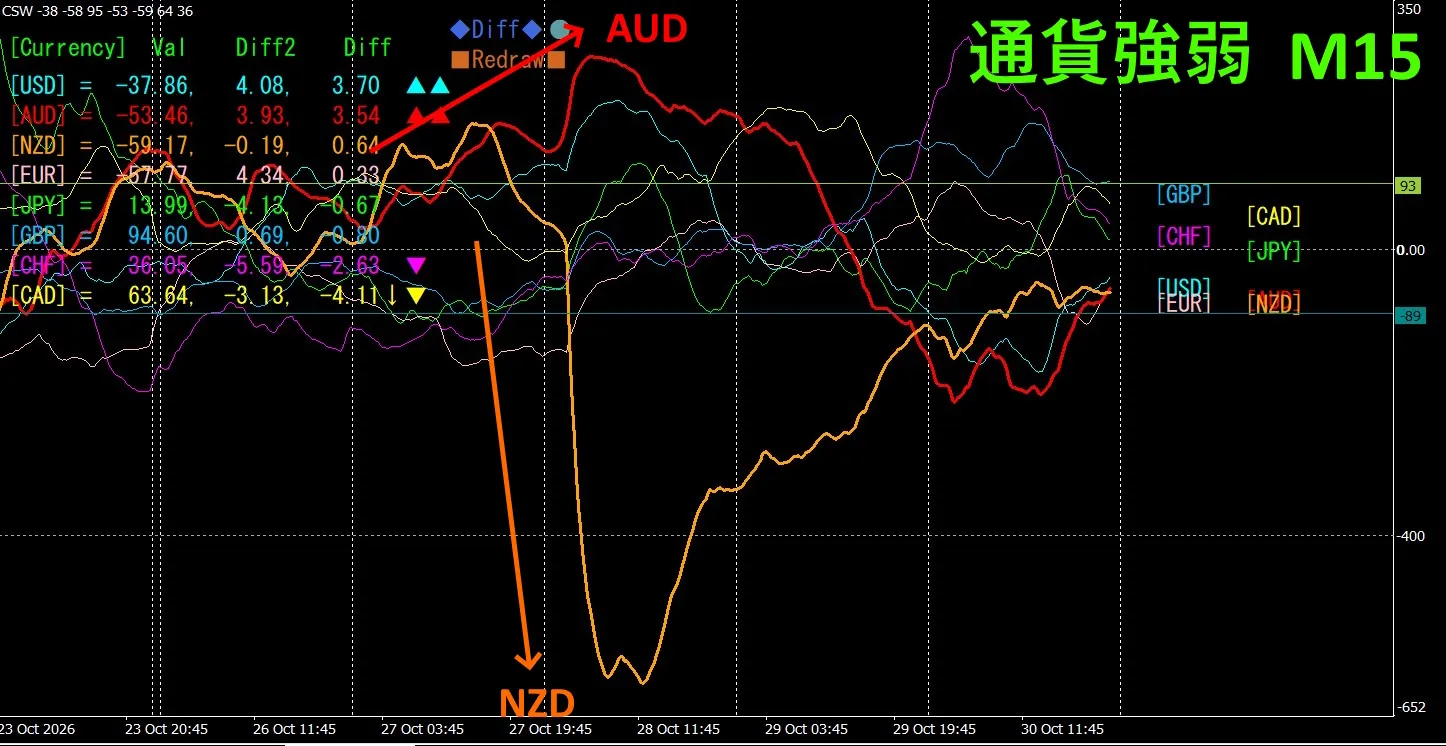
Looking at the 15-minute currency strength graph,AUDandNZDare,in an inverse correlation.AUDandNZDare diverging and spreading apart—we only trade in those areas. Since AUD > NZD,during the divergencewe buyAUDNZDand that’s all you need to do.Because of the inversecorrelation,we aim only at those points to trade.
In FX,if you pick the pair that is currently extending the most,and is inversely correlated,results will naturally follow.
“Aim for currency strength inverse correlation!”isan iron ruleof FX.
If you use “TrendLine-EX”,you can automate entries and exits on diagonal trendline breaks.You can leave it as is,makingtradingeasy.“TrendLine-EX”isa semi-automatedEAthat can auto-sell on a trendline break below,and auto-close on a break above.
2. Best SelectTry using the indicator
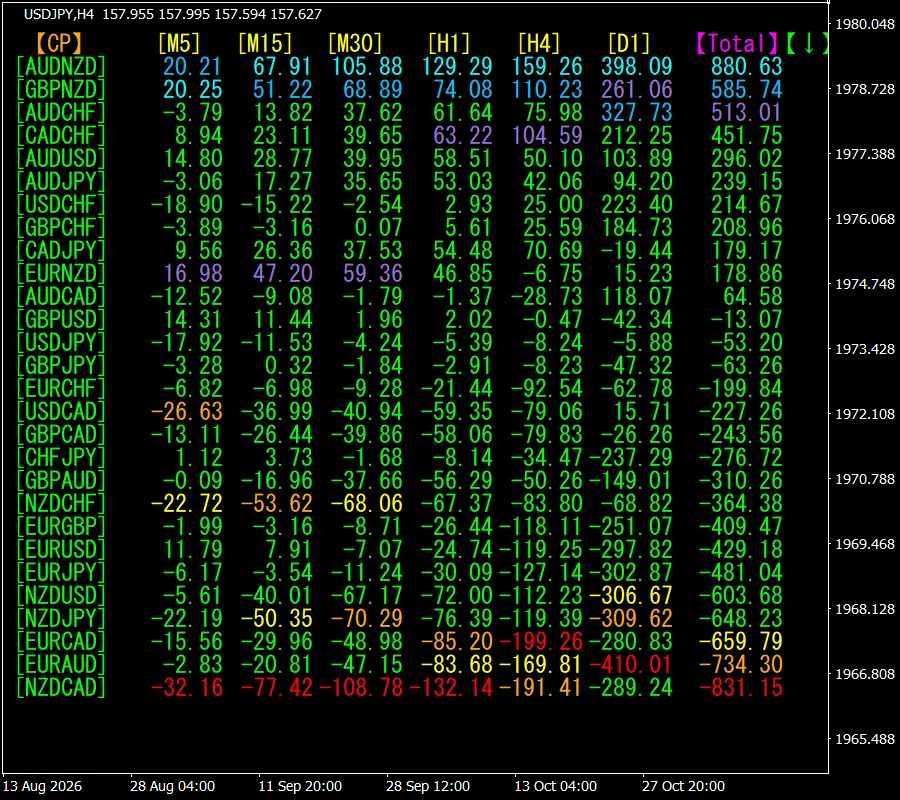
Thefigure below is a screenshot from 2026/10/29 11:23(JST) .
[Total]is sortedin descending orderof value.At the top,AUDNZDhas,blue-ishdisplay colorsacross all timeframes. Totalvalueis+880.63,apositivenumber.This suggeststhatanuptrendis developing in AUDNZD.
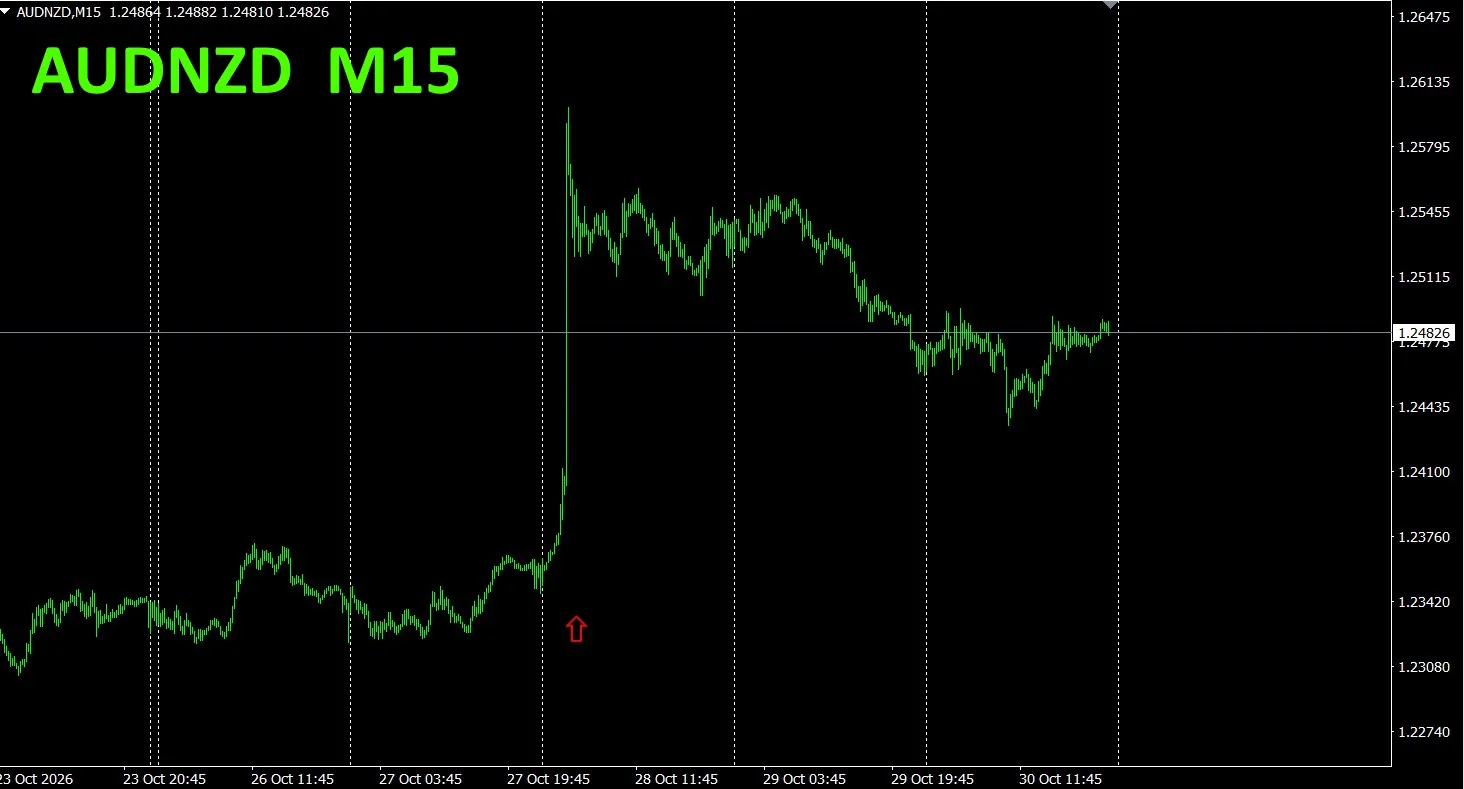
Now then,let’s look attheAUDNZD chart.
The red arrow marks where the screenshot was taken.It capturesthe point where the chart spiked up. “28 Currency Pairs Best Select Indicator”can,among the 28 currency pairs, identify which currency has the most developed trend,quite easily,butwhat happens afterwards and how it unfolds,is not guaranteed.It captures the“instantaneous maximum wind speed”of a trend,but whether that was just the ultimate bottom,and whether the trend ends thereafter,needs to be confirmed on the chart—this is a good example.
The “28 Currency Pairs Best Select Indicator”can,among the 28 currency pairs,easily find which currency has the most developed trend.Also,the “28 Currency Pairs Divergence Comparison Indicator”will,among the 28 currency pairs,tell youwhich pair has the greatest degree of divergence.From all currency pairs,it is an excellent indicator that lets you determine at a glancewhich pairs you should trade.
“28 Currency Pairs Best Select Indicator”

https://www.gogojungle.co.jp/tools/indicators/35128
3. 2021/5 onward we’ve been trackingEURJPY—how has it moved?
Since May 2021, we have been tracking EURJPY’s movement.
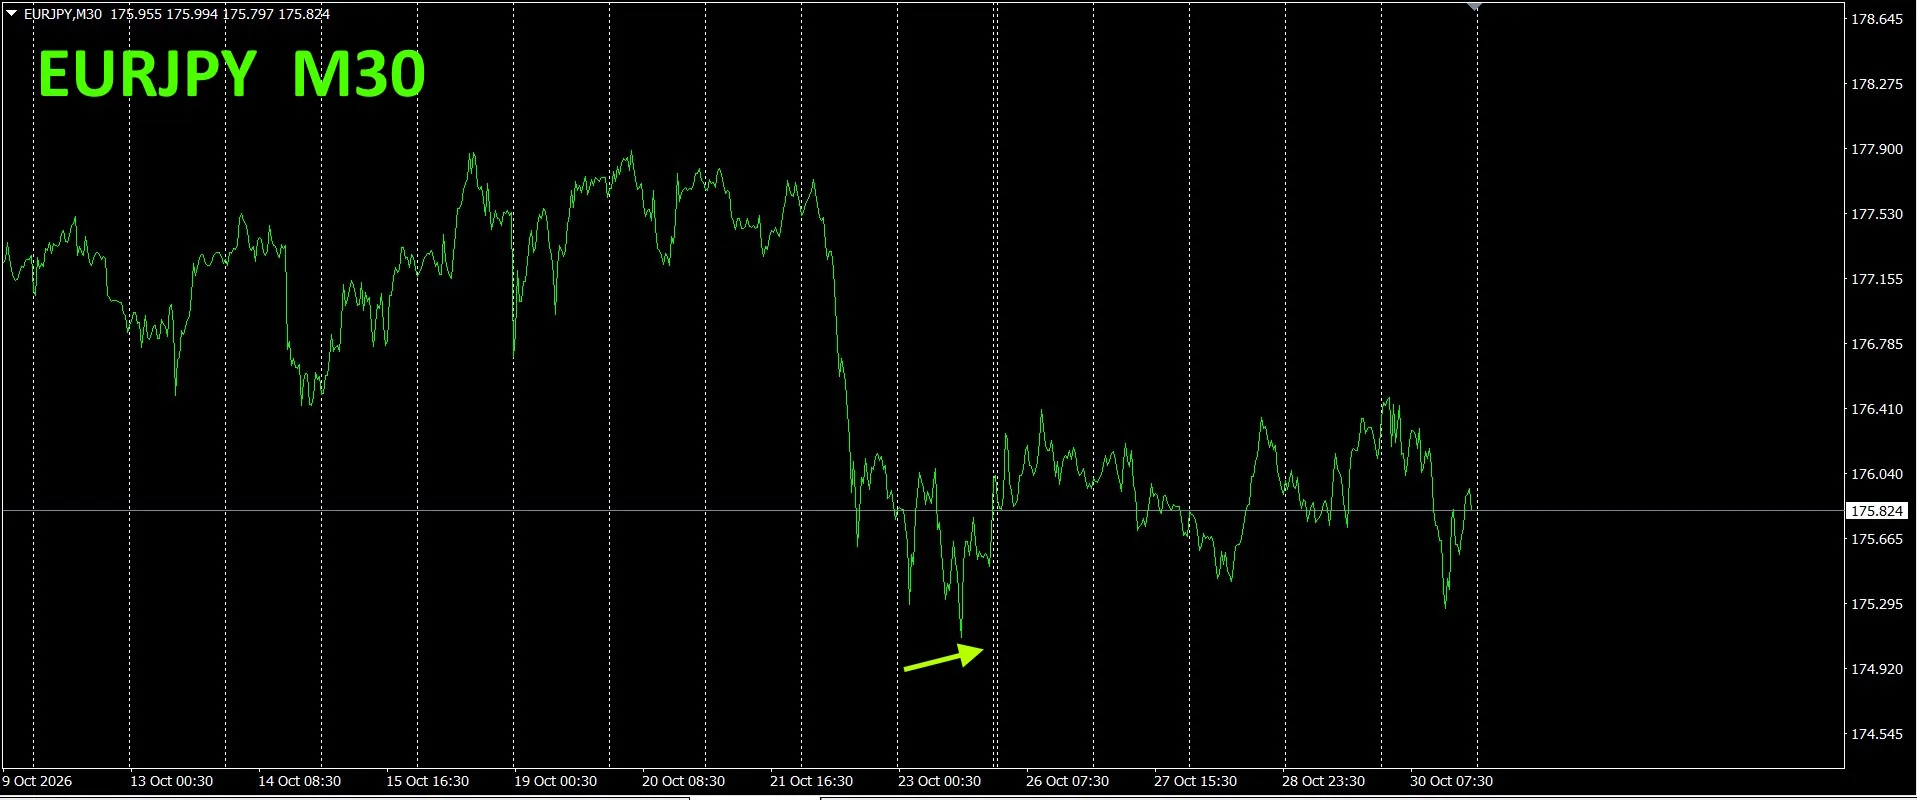
To view the overall flow,we plotted roughly the most recent3 weeks on a 30-minute chart.
Previously,we wrote as follows.
Pink isEUR,green isJPY.EURis sloping upward, JPYis slightly downward,so going forwardEURJPYis expected to be on an upward trend.
The downside appears to be supported.
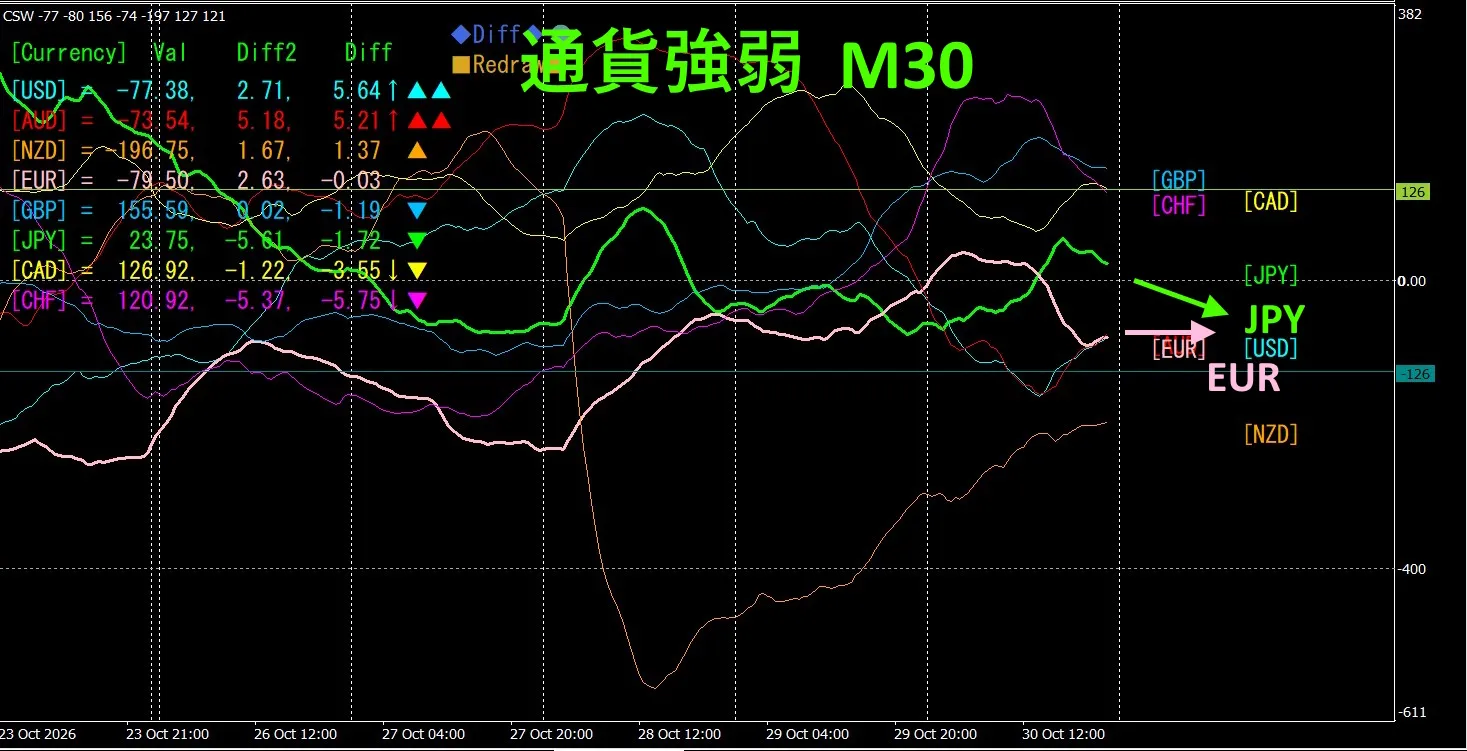
This is the currency strength chartfor the 30-minute timeframe.
Pink isEUR,green isJPY.EURis almost flat, JPYis slightly downward.There isn’t a clear sense of direction,butEURJPYis,likely to be slightly bullishgoing forward.
4. NewIndicator Dual_MACD_Trend_IndicatorTried Using It
See the new indicator “Dual_MACD_Trend_Indicator” below.
MT4 Version:https://www.gogojungle.co.jp/tools/indicators/62199
MT5 Version:https://www.gogojungle.co.jp/tools/indicators/62202
This indicator clearly shows the trend direction with colors.If the color bar isLimeit’s a buy, if it’s Redit’s a sell,making it easy for beginners to use.If the bars are green, it’s an uptrend,if red, a downtrend,and if there’s no color, there is no trend.Because it’s color-based,you can grasp the trend state at a glance.
We introduced this indicatorto theAUDNZD1-hour chart.
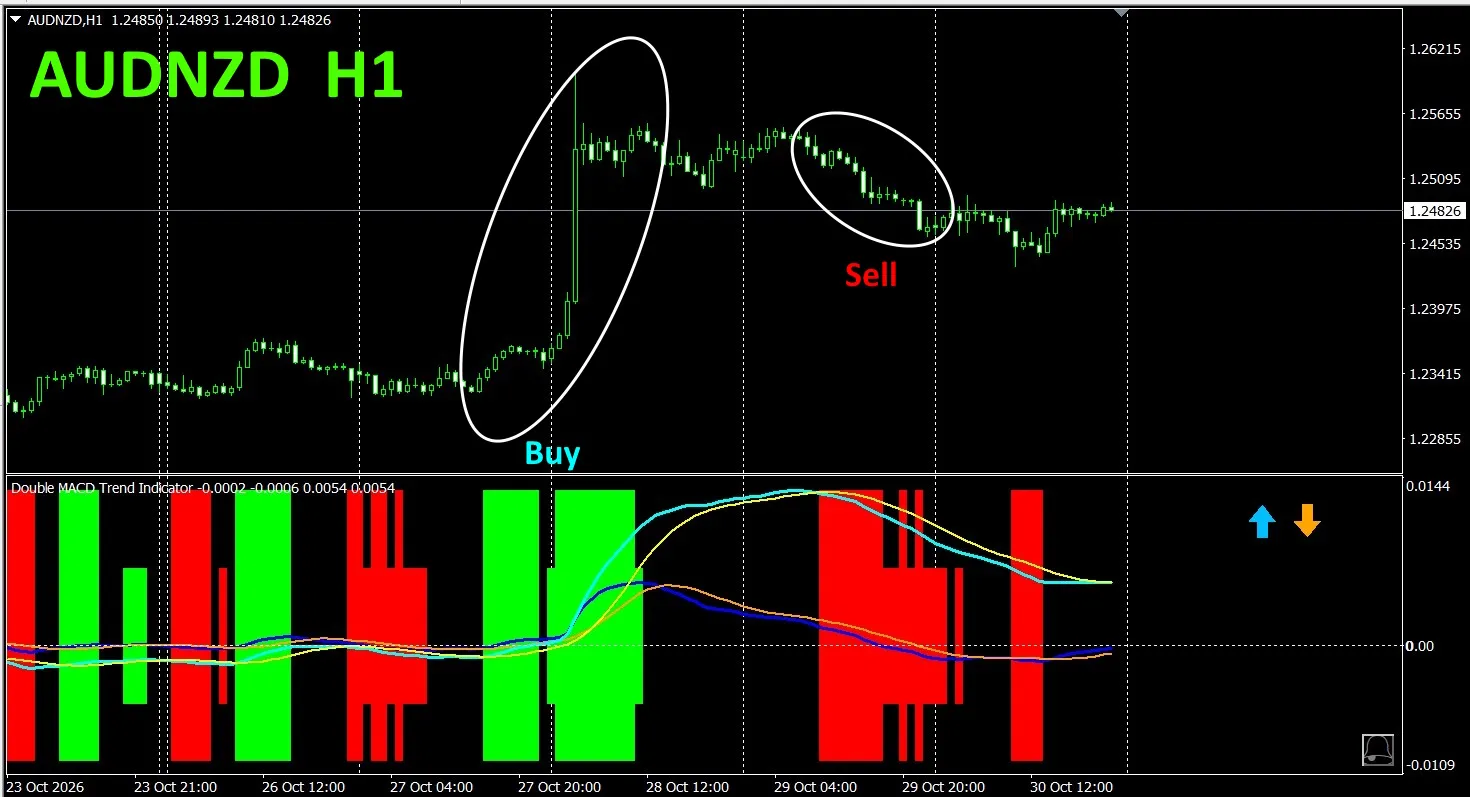
The red sell zones,and the green buy zones,are neatly separated,making trading at a glance easier.In the figure above,you buy in the areas with green color enclosed by white ellipses,and sell in the areas with red color enclosed by white ellipses.The slope of the indicator’s long-termMACDis also informative.If the long-termMACDis sloping down to the right, it’s a sell,if it’s rising to the right, it’s a buy.
With “Dual_MACD_Trend_Indicator”,the simple rule is: buy in green zones,sell in red zones,and do not trade otherwise.
“Dual_MACD_Trend_Indicator”removesany hesitation about trade direction.
Additionally,“Dual_MACD_Trend_Indicator”has been upgraded,with a two-tier bar display,and improved to show the trend directions of the top2higher timeframes with arrows.
5. “Trend_Color_MA_MTF”has beennewlyreleased
From the sales page
“Trend_Color_MA_Dual_MTF”wasdevelopedto transform your trading.This tool is not just a moving average.It visualizes trend direction with“color”,and when opportunity arrives,it alerts you with“sound”and“notifications”—your personal assistant.
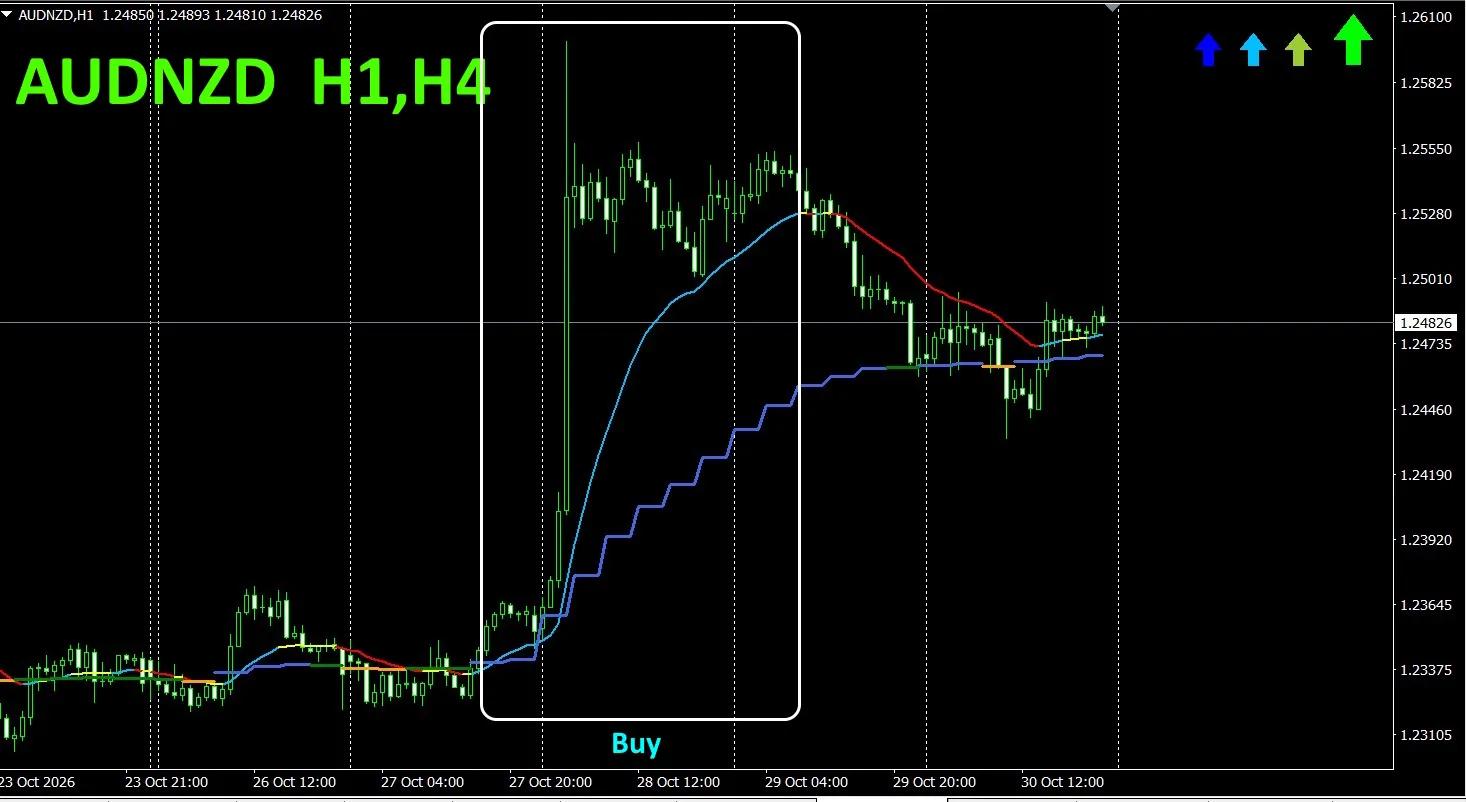
As an example,on theAUDNZD1-hour chart, we simultaneously displayed the4-hour moving average
The jagged, step-like lineis the4-hour moving average.The 1-hour moving average as well as the4-hour moving averageare shown in blue-ish colors when rising,and in red-ish colors when falling,so the current chart’s trend direction,and the higher timeframe’s trend direction,can be identified at a glance by color.
When the colors of the higher and current timeframes align,trade short if red-ish,and long if blue-ish.
For a buy,the 1-hourMAlight blueand rising, the 4-hourMAisblueand rising—buy at such spots.
In the figure above,focus on the areas enclosed by white squares and trade long.
For details,please see the following link.
https://www.gogojungle.co.jp/tools/indicators/75985
“8CFD Visualization Indicator Any version”
https://www.gogojungle.co.jp/tools/indicators/32288
“ToreTore Indicator”
https://www.gogojungle.co.jp/tools/indicators/50115
“TrendLine-EX”
https://www.gogojungle.co.jp/tools/indicators/42257
“8C Currency Strength Visualization Indicator”,pleaserefer to the following page.

MT4 Version https://www.gogojungle.co.jp/tools/indicators/39150
MT5 Version https://www.gogojungle.co.jp/tools/indicators/39159
[My Listed Products]