
【11/1 Night USDJPY】Moved in a range of 157.0–157.9 yen, ending Friday around the 157.5 yen level|Market structure and near-term targets as seen on LIGHTHOUSE
About LIGHTHOUSE
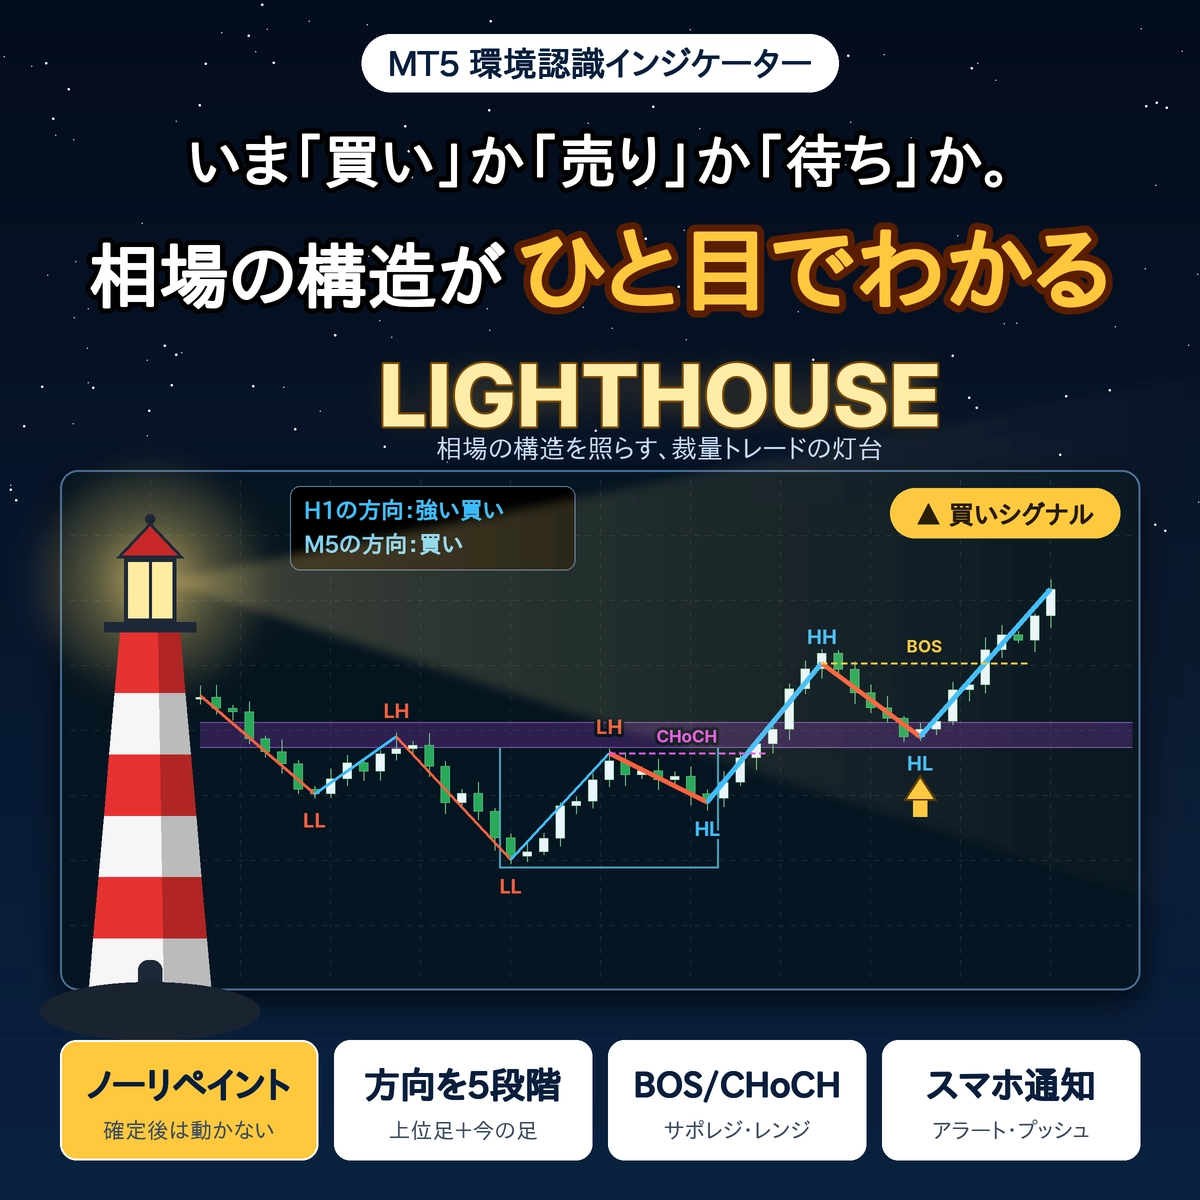
LIGHTHOUSE (Lighthouse) automatically displays the “reading” part of the chartas a discretionary trading aid indicator.
・Displays the direction of the higher timeframe and the current candle on the top left of the chart in five steps
・Automatically displays the high/low updates (HH/HL/LH/LL) and the BOS/CHoCH lines
・Displays pullback and retracement zones, support-resistance reversal zones, and the range box
・Mountains and valleys marks appear after confirmation and do not move or disappear later (no repaint)
・Since the meanings of terms are displayed at the bottom left of the chart, you can memorize them while looking
while making trading judgments yourself, this tool is to gather the basis for decisions at a glance.
【Key points】Dollar-Yen market memo through Oct 30 (Fri) close
・Low on Oct 23156.072to the high on the 28th158.340then fell back to the 30th156.957
・The close on Oct 30 (Fri) is157.557(high 157.890 / low 156.957)
・The highs are157.635・157.890, the lows are157.256・156.957, which are commonly watched price levels
1. Recent Market Feel (Weekly/Daily/Hourly)
Weekly: from 156.835 in the week of Oct 19–23 to 157.557 in the week of Oct 26–30
The weekly close: week of Sep 21 was 157.271, week of Sep 28 was 157.828, week of Oct 5 was 158.268, week of Oct 12 was 157.992, week of Oct 19–23 was 156.835, week of Oct 26–30 was 157.557. The week of Oct 26–30 had a high of 158.340 and a low of 156.644, closing about 0.72 higher than the previous week’s close.
Daily: after returning to 158.340 on the 28th, fell to 156.957 on the 30th and closed at 157.557
On Fri Oct 23, movement ranged between 156.072 and 157.153, closing at 156.835. Mon Oct 26 moved between 156.644 and 157.636, settling at 157.491; Tue Oct 27 moved between 157.415 and 157.969, closing at 157.938; Wed Oct 28 hit a high of 158.340 and closed at 157.846. Thu Oct 29 moved between 157.597 and 158.119, closing at 157.700; Fri Oct 30 moved from a high of 157.890 to a low of 156.957, closing at 157.557.
Hourly: after reaching 157.890 at 3:00, fell to 156.957 by 14:00 and recovered to 157.557
On the 28th, after forming a high of 158.340 in the 21:00 hour and then retreating, on the 29th, a high of 158.119 was formed in the 16:00 hour and closed at 157.700. On the 30th, after a high of 157.890 at 3:00, it declined, reaching 157.111 at 6:00, and 156.957 at 14:00, then recovered to 157.635 by around 19:00, ending at 157.557 at 23:00.
Price levels that attract attention (facts from the chart)
| 158.119 | High on the 29th (16:00 hour) |
| 157.890 | High on the 30th (3:00 hour) |
| 157.635 | High on the 30th (19:00 hour) |
| 157.557 | Close on Oct 30 (Fri) |
| 157.256 | Low on Oct 30 (21:00 hour) |
| 156.957 | Low on Oct 30 (14:00 hour) |
Before/after economic announcements or statements by key figures often causes larger price moves, so please check the schedule yourself. The numbers in the text are values as of server time 23:00 on Fri Oct 30.
2. When you view the same chart with LIGHTHOUSE
From here, we will view the same USD/JPY chart with LIGHTHOUSE added.
Daily chart (upper frame is weekly): both weekly and daily show a “sell” signal

Top left shows “W1 direction: Sell” and “D1 direction: Sell.” In the low-price zone,LL is formed, followed by a mountainLH, a valleyHL, and another mountainLH is formed.
Above price, around 160–160.7, asupport-resistance reversal zone is displayed. Near the price, around 157.4–158.0, aretracement zone exists, and the current price lies within this zone.
1-hour chart (daily is the higher frame): daily shows “sell”, 1-hour shows “strong sell”
Top left shows “D1 direction: Sell” and “H1 direction: Strong Sell,” with a “Sell Signal 6:30 PM” also displayed. On the 30th, at the valley in the 6:00 hourLL, at the mountain in the 10:00 hourLH, and at the valley in the 14:00 hourLL, aBOS also appears.
Near the price, asupport-resistance reversal zone is shown around 157.55–157.71, and below there is aretracement zone around 157.26–157.44, and asupport-resistance reversal zone around 157.1–157.2.
5-minute chart (hourly is the higher frame): hourly shows strong sell, 5-minute shows “strong buy”
Top left shows “H1 direction: Strong Sell” and “M5 direction: Strong Buy.” On the night of the 30th, after the valley at 21:00,LL formed, then the high at 22:00 was 157.583 withHHHL formed,CHoCH also appears.
, a valleyAbove the price, asupport-resistance reversal zone is shown around 157.59–157.63, the price position includes aretracement zone, below there is a around 157.11–157.15 asupport-resistance reversal zone is displayed. This is a situation where the higher timeframe direction and the current candle direction diverge.